Article Text

Abstract
Unscheduled admissions to hospital place great demands on the use of limited healthcare resources in health systems worldwide. A range of approaches exist to manage demand; however, interventions within hospitals have received less attention, and the evidence base on effectiveness is limited. This study aimed to assess the effectiveness of a novel intervention, implemented in National Health Service Lothian, to reduce the number of unscheduled attendances, and to estimate the impact on hospital admissions, length of hospital stay and overall total acute hospital costs.
Methods Before and after observational study of an anticipatory care planning intervention targeted among people identified by a prediction algorithm (Scottish Patients at Risk of Readmission and Admission) as being at high risk of future unscheduled hospital admissions. The statistical significance of the difference in outcomes observed before and after implementation of the intervention between August 2014 and July 2015 was tested using difference-in-difference analysis.
Results The intervention was estimated to reduce the number of unscheduled hospital admissions and emergency department (ED) visits by approximately 0.36 (95% CI −0.905 to 0.191) per patient per year (based on 954 and 450 patients in the intervention and control groups, respectively). There was also non-significant reductions in length of hospital stay for unscheduled admissions and hospital costs for ED visits and inpatient care. The overall predicted effect of the intervention for the average participant was a saving of around £2912 (95% CI −7347.0 to 1523.9) per patient per year.
Conclusion An anticipatory care planning intervention focused among people judged to be at higher risk of future unscheduled hospital admissions can be effective in reducing the number of unscheduled admissions to hospital and ED visits, and may lead to an overall saving in use of hospital resources.
- BMJ health informatics
- patient care
- information management
Data availability statement
Data may be obtained from a third party and are not publicly available. Data access has to be applied with the NHS Lothian Caldicott Guardian.
This is an open access article distributed in accordance with the Creative Commons Attribution Non Commercial (CC BY-NC 4.0) license, which permits others to distribute, remix, adapt, build upon this work non-commercially, and license their derivative works on different terms, provided the original work is properly cited, appropriate credit is given, any changes made indicated, and the use is non-commercial. See: http://creativecommons.org/licenses/by-nc/4.0/.
Statistics from Altmetric.com
Summary
What is already known?
Approaches to manage healthcare demand, ranging from provision of self-management support and interventions in primary care, to better integration between healthcare and social care, as well as other specific community-based interventions to reduce hospital re-admission, have been assessed in the literature. Some are beneficial and cost-effective, while others are not, but less is known regarding hospital based interventions.
What does this paper add?
This paper focused on impacts of an anticipatory care planning intervention based on a prediction algorithm to reduce unscheduled acute hospital care. This approach can be an effective intervention within a hospital to lower unscheduled hospital admissions and emergency department visits, and may potentially reduce overall hospital costs.
Introduction
A large focus for healthcare systems worldwide is to improve the efficiency of resource use, especially the amount devoted to unscheduled care in hospital. For example, almost a quarter of National Health Service (NHS) England overall expenditure in 2013/2014 was spent on unscheduled care.1 Unscheduled care has been defined as ‘any healthcare provided with less than 24 hours notice’. Unscheduled hospital admissions form a growing part of hospital care: between 2006/2007 to 2017/2018, the number of unscheduled admissions from accident & emergency (A&E) departments has been steadily rising.2
The UK House of Commons Public Accounts Committee3 estimates that 24% of the total 5.8 million emergency admissions in England during 2016–2017 might have been avoided if more effective community healthcare and case management had existed.4 Examples here include interventions co-ordinated in primary care, where one study in NHS Highland showed significant reductions in unplanned hospitalisation for patients with multiple morbidities.5 Other initiatives, ranging from self-management support to better integration between healthcare and social care, have also been tested to reduce hospital readmission (See6 for a detailed review). The evidence base relating to the effectiveness of such interventions is however rather mixed, and also challenging to interpret, given patient heterogeneity in terms of case-mix.
Relative to primary and community care, less attention has been devoted to initiatives within the hospital setting. However, there is now growing provision of enhanced information support between healthcare professionals. For example, within Scotland, the key information summary aims to enhance communication between primary and secondary care.7 It allows selected parts of the general practitioner (GP) electronic patient record to be shared electronically with other parts of the NHS, and currently covers 2%–3% of the Scottish adult population with the most complex health and/or social care needs.
Predictive modelling tools to identify patients at high risk of being a frequent A&E attender or being readmitted are now available, for instance Patients at Risk of Readmission and Adjusted Clinical Groups-Predictive Model used in the USA and UK,8 as well as Hospital Admission Risk Prediction in Canada (see ref. 9 for a rapid review on predictive validity of these tools). In Scotland, an algorithm called Scottish Patients at Risk of Readmission and Admission (SPARRA) is an available risk prediction tool that predicts an individual’s risk of unscheduled admission to hospital within the next 12 months. It has been used to proactively manage future hospital demand among population groups likely to make greater use of hospital resources.10 11 While modelling studies predict that such tools should lead to reductions in the number of unplanned hospital admissions,11 there is a paucity of evidence from real world implementation studies regarding whether they do in practice reduce the volume and costs associated with unscheduled hospital admissions.12
The aim of this paper therefore is to report the effectiveness of a novel intervention, implemented in NHS Lothian, Scotland, that aimed to reduce the risk of future unscheduled hospital admission. The intervention involved application of the SPARRA tool to identify patients at high risk of future unscheduled hospital admission, followed by deployment of appropriate key workers (eg, addictions or psychiatric nurses or consultants) to engage with patients, relatives, GPs and the wider hospital team to develop patient-centred care plans. This paper focuses on four potential effects of the intervention: the number of unscheduled attendances to emergency department (ED) and unscheduled hospital admissions, length of hospital stay, total costs of unscheduled admissions and overall total acute hospital costs. Unlike many interventions that prioritise older adults,13–15 this intervention focused on a wider group of participants with long term conditions and younger frequent ED attenders. Therefore, it contributes to the literature on hospital based interventions among a wider patient group.
Data
The intervention (entitled ‘PACT’: Patient Anticipatory Care Team) was implemented at the Royal Infirmary Edinburgh (RIE) for 2 years and commenced in August 2014. Frequent hospital attenders were defined as an individual with a SPARRA score of 80 or more, or meeting the conventionally accepted definition of ED frequent attender: 10 or more ED attendances in the previous year or 5 or more in the previous 3 months. Frequent attenders were triaged for interventions and allocated an appropriate PACT key worker, with some patients then receiving anticipatory care plans (ACPs). Staff were able to access this ACP to manage future ED visits.16 For example, a typical ACP of patients with multiple long-term conditions consisted of background information on physical and mental problems, and family circumstances, for example, carer or care responsibilities. Many included consultant names, as well as flagging specific issues such as need for support from other services, for example, social care or police.
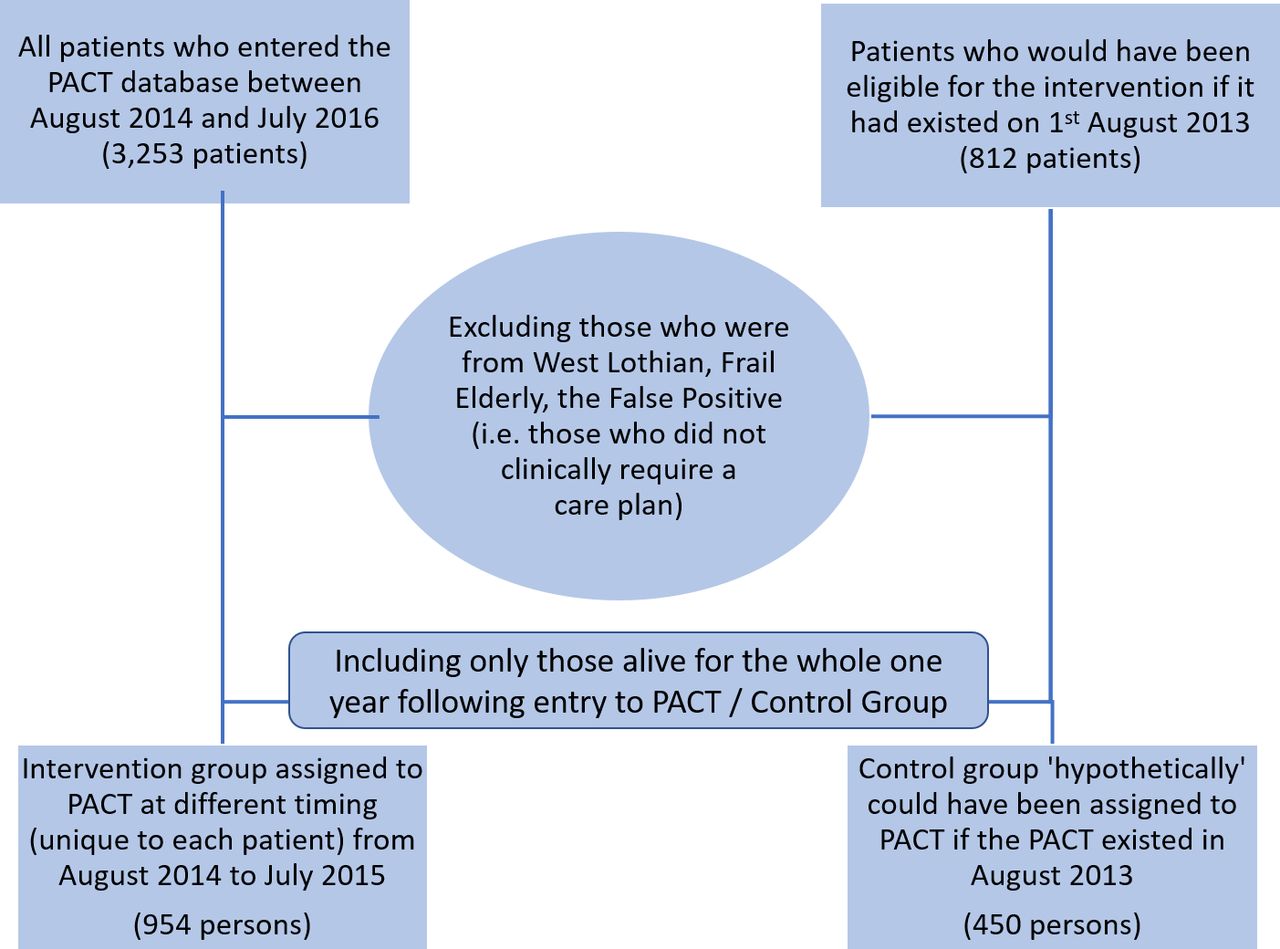
A total of 954 patients were identified as frequent hospital attenders eligible to receive the intervention and were assigned a key worker between August 2014 and July 2015. The algorithm identified a cohort of potentially eligible individuals, which was further refined by removing individuals resident outwith the hospital catchment area or who clinically did not require a care plan (this process also excluded frail elderly patients, who were signposted to dedicated care of the elderly services). Further, for the purposes of analysing full-service outcomes 1 year before and after implementation, only patients alive for the whole outcomes measurement period were included in the statistical analysis (Retaining patients who died during the evaluation period could bias the results in either direction. While greater mortality might drive down the cost due to shorter span of those patients in the sample, end of life care could be much more expensive for some patients.).
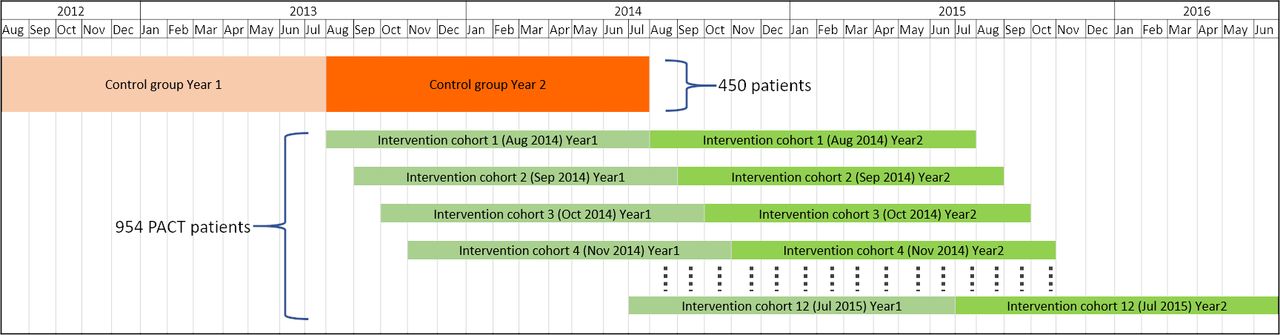
In addition, a synthetic control group was created using archived data to identify patients who would have been eligible for the intervention if it had existed on 1 August 2013 (812 patients). After applying the same inclusion criteria, this generated a control group of 450 patients. The flow chart for the triage into intervention and control groups in figures 1 and 2 illustrates the timeline for sample recruitment. The intervention group consists of multiple cohorts of patients identified as high-demand patients at different dates in a monthly staggered pattern. The first cohort of the intervention group was triaged in August 2014. Here, the year 1 (or ‘before’ period) covers 12 months prior to August 2014, while year 2 (the ‘after’ period) includes 12 months from August 2014. We combined all cohorts based on triages from August 2014 to July 2015 into ‘the intervention group’.

Timeline of the administrative data used for the control and intervention groups.

The triage of our study sample.
Methods
The effectiveness of the intervention was estimated using a ‘difference-in-differences (Dif-in-Difs) design’. The main regression model was specified as follows:

where  is a dependent variable for the outcomes of interest, which are numbers of ED visits, unscheduled hospital admissions, length of stay or total hospital cost as described in table 1.
  is a dummy variable equal to one if patient i was allocated to the intervention,
  is a dummy variable equal to one if the time period t (=1, 2) of the data is within 1 year after patient i was allocated to the intervention and 1 year after the hypothetical intervention date (1 August 2013) for the intervention and control groups respectively, and γ, a coefficient of
  , is the estimated impact of the intervention on the outcomes (treatment effect).
  is a vector of control variables including age, gender, SPARRA score when identified by the algorithm as a frequent attender, and quintile of the patient’s neighbourhood based on the 2016 Scottish Index of Multiple Deprivation (SIMD), where the first quintile is the most deprived area whereas the fifth quintile is the least deprived area.
  is an error term. There were a small number of missing observations in the SPARRA score and the SIMD (n=154). Thus, the data were treated as missing at random and therefore those observations were excluded from the main analysis. Negative binomial regression was used to model the number of hospital admissions and length of stay, while generalised linear model regression with gamma distribution and logarithmic link function was used for total hospital costs.
Summary statistics
Summary statistics by group and period
Results
table 1 shows per patient mean, SD, minimum and maximum value of the main outcomes and all explanatory variables.
The average number of unscheduled admissions and visits to the ED was 3.86 per person per year (pp/py), of which the ED visit is 0.95 and the unscheduled admission is 2.91. All values of number of admissions/visits presented in tables 1 and 2 as well as in the regression analysis of total cost in online supplemental table 1 and 2 are calculated assuming one admission/visit per episode of care, for example, when a patient visited the ED and was then transferred to another ward, we count that as one admission/visit only (using a different approach, ie, counting them as separate admissions or visits, makes little difference to the regression analysis results.). The average length of stay for unscheduled hospital admissions is 9.4 days pp/py. The average total cost for unscheduled hospital admissions is £10 830 pp/py, and the average total cost for all ED visits and all admissions is £22 250. Regarding explanatory variables, there are approximately the same proportion of males and females in the sample. Approximately 40% of the sample is aged between 16–44 years of age, 40% aged 45–64 years of age, and those aged 65 years of age or older represent 20% of the sample. Approximately 60% of the sample live in less privileged neighbourhoods (quintiles 1 and 2), as measured by SIMD. The average baseline SPARRA score is 70.
Supplemental material
Table 2 compares descriptive statistics for the explanatory variables: age, gender, SIMD and SPARRA between the control and intervention groups. The groups appear comparable on most indicators, with no large differences evident. Summary statistics of the four main outcome variables are also shown. The average number of admissions and ED visits show a clear downward trend between the before and after period for both the intervention group and the control group (average decline of 1 visit pp/py in both groups). The average length of stay associated with unscheduled admissions also shows a decline in both groups, with a smaller decline in the intervention group (3 days) vs the control group (4 days) (However, these are not adjusted for the compositional differences (such as age or risk score) between the intervention and control groups.). A similar pattern emerges with the costs associated with these stays: a decline in both groups, but a larger decline in the control group. Finally, the total costs from all ED visits and all hospital admissions showed a similar level decline for both intervention and control groups between the before and after period.
Regression analysis
Table 3 shows the intervention group has a significantly lower number of unscheduled admissions and ED visits. Also, there were significantly fewer admissions and ED visits in the period after intervention. The effect of the intervention is shown by the interaction term (intervention*after). This estimates a reduction in the number of unscheduled admissions and ED visits, and is statistically significant at the 10% level. This result is robust to a change in the method used to correct the standard errors, that is, the p value of the treatment effect is equal to 0.070 and 0.085 for homoscedastic errors and bootstrapping errors with stratification between control and intervention group, respectively. Most of the remaining control variables in table 3 have insignificant coefficients. The exceptions relate to the youngest age group, SIMD 1 and the SPARRA score.
Negative binomial regression with bootstrapped SEs (1000 replications) without stratification for unscheduled admissions and ED visits*
Predicted number of unscheduled admissions estimated at means of all other control variables based on bootstrapped SE without stratification
To interpret the estimated coefficients shown in table 3, marginal effects and CI are computed, based on the delta method. table 4 shows the predicted number of unscheduled admissions and ED visits per year in the intervention group is around 3.30 compared with 3.86 in the control group, while the number in the period after intervention falls by around 0.91. In summary the intervention is associated with a reduction of approximately 0.357 (95% CI –0.905 to 0.191) admissions and visits per year (This is approximately equal to (2.8424–3.8477) – (3.5538–4.2023)). The treatment effect and 95% CI are computed according to a suggestion in reference 17. Further, the predicted effects of the intervention may be larger for those with higher SPARRA scores or younger patients (see online supplemental table A1).
Supplemental material
table 5 shows the impact on hospital length of stay from unscheduled admissions. There was no statistically significant difference in length of stay between intervention and control groups, or in the time period before and after the intervention. The interaction term (intervention*after) is not statistically significant, suggesting that the intervention did not influence length of stay. Female patients were associated with a longer length of stay. Those from the most deprived areas were associated with a shorter length of stay (Although this result sounds counter-intuitive, this coefficient becomes significant only when SPARRA score is included. In other words, for those with the same risk score, patients from the most deprived area stay in the hospital for shorter periods of time than those from the least deprived area.). Higher SPARRA score was significantly associated with a longer length of stay. Overall, while the ‘average’ patient is predicted to have a shorter length of stay by approximately 1 day, the effect is not statistically different from zero.
Negative binomial regression with bootstrapped SEs (1000 replications) without stratification for length of stay due to unscheduled admissions
Online supplemental table 1 estimates the association between the intervention and unscheduled hospital admission costs. The coefficient of the interaction variable— (intervention* after)—is not significantly different from zero, indicating no statistically significant association with unscheduled admission costs. Similar to previous tables, gender, area deprivation and SPARRA score were all significantly associated with costs. Using the estimated coefficients, our model predicts a £717 (95% CI −2752.1 to 1318.5) reduction in unscheduled hospital admission costs for the average patient.
Online supplemental table 2 considers the effect on total hospital costs for ED visits and all lengths of stay (both scheduled and unscheduled). The coefficient of interest (intervention*after) is not significantly different from zero. Similar to previous estimates, gender, area deprivation and SPARRA score were all significantly associated with costs (male respondents, younger age groups, more deprived area and lower SPARRA score were all associated with lower hospital costs).
We also ran bootstrap regressions of the model in online supplemental table 2 for 10 000 replications and plotted the histogram of the estimated coefficients of the intervention effects in online supplemental figure A1. The average value of these estimates is around −0.18, and in more than 90% of the replications the intervention effects are negative, showing a reduction in total costs from all scheduled and unscheduled admissions as well as ED visits.
Online supplemental table 3 presents the marginal effects for different groups. For example, the predicted value of the total cost per year in the intervention group is around £17 230 compared with £19 985 for the control group. Furthermore, for both groups, the total cost observed after the intervention period is around £3230 lower than observed in the year prior to intervention. Our predicted effect of the intervention for the ‘average’ patient is a saving of around £2912 (95% CI −7347.0 to 1523.9) per patient per year. Online supplemental table A2 indicates that the predicted savings are likely to be larger among those patients with higher SPARRA score, for example, £4484 (95% CI -11 309.7 to 2342.8) and £5133 (95% CI −12 948.9 to 2683.6) pp/py for those with SPARRA score at 75th and 90th percentile respectively. In addition, the absolute size of the reductions is increasing with age except for the oldest patients, while female patients are predicted to have a higher decrease in costs than males.
Discussion
The results reported in this paper suggest that the ACP intervention developed in this study had a statistically significant association with the number of unscheduled hospital admissions and ED visits. However, while the intervention was associated with a reduced length of hospital stay for unscheduled admissions, and was associated with lower hospital costs for ED visits and inpatient care, these reductions were not statistically significant. Such insignificant effects are consistent with literature on case management in older people and care pathway guidelines for specific diseases.13 18
Our finding of a statistically significant reduced volume of unscheduled hospital admissions and ED visits is consistent with systematic reviews of similar interventions that aim to reduce hospital readmissions (19,20). A meta-analysis of 42 RCTs (Randomised Controlled Trials)19 found a significant reduction in the risk of 30 days medical and surgical readmissions (pooled relative risk=0.82 (95% CI 0.73 to 0.91). The ingredients within successful interventions targeted patient characteristics (eg, multimorbidity and socioeconomic variables factors) as well as caregiver availability. A further systematic review of 26 RCTs20 found that interventions initiated during the hospital stay and continuing after discharge for a minimum of 1 month were effective in reducing readmissions over the subsequent 1 year period (pooled relative risk=0.58 (95% CI 0.46 to 0.75)).
One explanation for the insignificant findings on three of the four outcomes is that there was a clear downward in the second year of follow-up in both groups. This is most likely due to regression to the mean, that is, the trajectory of hospital care use reverting to a trend that reflects more typical longer term use patterns. The use of the SPARRA algorithm and prior admission data will by design detect high users of hospital care. One implication is that reductions in admissions and length of stay are more likely to be difficult to detect, and may lead to zero effects, or weakly significant treatment effects.
An explanation for the insignificant effect of the intervention on costs is that the intervention is focused on prevention of admission rather management of length of stay while in hospital. A further explanation is that length of stay may be influenced by bed capacity, and this may have fluctuated year on year, thereby diluting any treatment effect.
A potential limitation of this study is that the estimates relied on historical control data. Other than standard Dif-in-Difs assumptions (Ideally, a better control group could be contemporaneous data from other health boards that did not implement the PACT intervention. However, we do not have access to data outside the RIE.), one extra assumption is needed when using patients’ historical data as a control group. Specifically, the change in outcomes of patients in the control group 1 year before and after 1 August 2013 (our hypothetical intervention date) is assumed to mimic what would have happened to patients in the intervention group if they had not been treated with the intervention (similar to the ‘parallel trend’ assumption).
However, we encounter two complications. First, due to data availability, we are unable to show that the trends between the intervention and control groups were similar prior to the actual and hypothetical dates respectively. Second, the dummy  is not able to control for macro trends affecting both intervention and control groups in the year after intervention because these periods are not contemporaneous. Consequently, the analysis assumes no significant change in resource constraints between different time periods. Overall, these limitations and the unavailability of data on other patients’ characteristics, may limit the generalisability of our findings to other settings. Further research in other settings is required to establish whether the results observed here can be generalised to other areas.
Conclusions
An anticipatory care planning intervention focused on people at high risk of future unscheduled hospital admissions can be effective in lowering the number of unscheduled admissions to hospital and ED visits, and may help to save overall hospital costs. Furthermore, potential benefits of the intervention in terms of health for the patient were not measured. These benefits may include better health outcomes and positive patient experience.21 Although feedback from patients, relatives and staff was overwhelmingly positive,16 evaluation of the intervention in terms of these aspects was beyond the scope of this study.
Data availability statement
Data may be obtained from a third party and are not publicly available. Data access has to be applied with the NHS Lothian Caldicott Guardian.
Ethics statements
Ethics approval
Ethics approval and consent to participate was obtained from the NHS Lothian Caldicott Guardian (Application Number 1751).
Acknowledgments
We thank Information Statistics Division and the data analytical team from NHS Lothian for data linkage.
Supplementary materials
Supplementary Data
This web only file has been produced by the BMJ Publishing Group from an electronic file supplied by the author(s) and has not been edited for content.
Footnotes
Contributors AL performed data analysis, undertook data interpretation and wrote drafts of the manuscript. PM undertook data interpretation, wrote drafts of the manuscript and edited the manuscript prior to publication. CC helped with data preparation, data linkage and organised information governance permissions. RS led the original study on which the paper is based and contributed to the writing of the manuscript. All authors read and approved the final manuscript.
Funding This work was supported by NHS Lothian through an award from the Invest to Save Fund. The Health Economics Research Unit is funded by the Chief Scientist Office of the Scottish Government Health and Social Care Directorates.
Competing interests None declared.
Provenance and peer review Not commissioned; externally peer reviewed.
Supplemental material This content has been supplied by the author(s). It has not been vetted by BMJ Publishing Group Limited (BMJ) and may not have been peer-reviewed. Any opinions or recommendations discussed are solely those of the author(s) and are not endorsed by BMJ. BMJ disclaims all liability and responsibility arising from any reliance placed on the content. Where the content includes any translated material, BMJ does not warrant the accuracy and reliability of the translations (including but not limited to local regulations, clinical guidelines, terminology, drug names and drug dosages), and is not responsible for any error and/or omissions arising from translation and adaptation or otherwise.