Article Text

Abstract
Introduction Healthcare policy formulation, programme planning, monitoring and evaluation, and healthcare service delivery as a whole are dependent on routinely generated health information in a healthcare setting. Several individual research articles on the utilisation of routine health information exist in Ethiopia; however, each of them revealed inconsistent findings.
Objective The main aim of this review was to combine the magnitude of routine health information use and its determinants among healthcare providers in Ethiopia.
Methods Databases and repositories such as PubMed, Global Health, Scopus, Embase, African journal online, Advanced Google Search and Google Scholar were searched from 20 to 26 August 2022.
Result A total of 890 articles were searched but only 23 articles were included. A total of 8662 (96.3%) participants were included in the studies. The pooled prevalence of routine health information use was found to be 53.7% with 95% CI (47.45% to 59.95%). Training (adjusted OR (AOR)=1.56, 95% CI (1.12 to 2.18)), competency related to data management (AOR=1.94, 95% CI (1.35 to 2.8)), availability of standard guideline (AOR=1.66, 95% CI (1.38 to 1.99)), supportive supervision (AOR=2.07, 95% CI (1.55 to 2.76)) and feedback (AOR=2.20, 95% CI (1.30 to 3.71)) were significantly associated with routine health information use among healthcare providers at p value≤0.05 with 95% CI.
Conclusion The use of routinely generated health information for evidence-based decision-making remains one of the most difficult problems in the health information system. The study’s reviewers suggested that the appropriate health authorities in Ethiopia invest in enhancing the skills in using routinely generated health information.
PROSPERO registration number CRD42022352647.
- BMJ Health Informatics
- Health Information Management
- Health Information Systems
- Health information exchange
Data availability statement
Data are available upon reasonable request.
This is an open access article distributed in accordance with the Creative Commons Attribution Non Commercial (CC BY-NC 4.0) license, which permits others to distribute, remix, adapt, build upon this work non-commercially, and license their derivative works on different terms, provided the original work is properly cited, appropriate credit is given, any changes made indicated, and the use is non-commercial. See: http://creativecommons.org/licenses/by-nc/4.0/.
Statistics from Altmetric.com
- BMJ Health Informatics
- Health Information Management
- Health Information Systems
- Health information exchange
Introduction
The health information gathered from sources at the facility and population level influences the quality of healthcare policy formulation, programme planning, monitoring, and evaluation, and healthcare service delivery as a whole.1 2 Alternatively, facility-level data sources can sometimes be referred to as ‘routine health information data sources’, whereas population-level data sources are known as ‘non-routine health information sources’.3
The administrative and operational processes that take place in routine health information sources produce data. Data about the morbidity and mortality of service users, the services delivered, the medications and goods provided, the availability and quality of services, case reporting, and resource, human, financial, and logistical data are just a few of the many categories of health service data. While non-routine (population) health information sources provide data on each individual within defined populations, including overall population counts (such as the census and civil registration) and data on representative populations or subpopulations (such as household and other population surveys).3
However, routine health information utilisation is the main emphasis of this review. The term ‘routine health information system’ refers to the process of consistently recording, reporting, analysing and presenting data from health facilities. Daily patient management, disease prioritisation, health education, resource allocation and decision-making, as well as the planning, monitoring and evaluation of healthcare service activities, all depend on the use of routine health information.4 A regularly operating health information system enables policy-makers, managers and service providers to make decisions based on evidence by getting the appropriate information into the right hands at the right time.5
Although there are regional variations across developing nations including Africa, routine health information is not properly used to support evidence-based decisions and enhance performance.6 The most frequently cited causes of poor routine health information utilisation in developing countries are related to its untimeliness, incompleteness, accuracy and consistency.7–10 Even the available information is too often left unattended in databases, documents or on shelves.6
In Ethiopia, the use of routine health information for evidence-based decision-making is not different from the case of developing nations all over the world. For instance, a systematic review and meta-analysis11 as well as other independent studies conducted across the nation came to the conclusion that routine health information was not used effectively for making evidence-based decisions.12–25 The most often mentioned factors affecting routine use of health information in Ethiopia included training15 16 18 20 23 26–29 competency related to data management15 18–20 23 27 28 30 and the availability of standard guidelines (such as indicator definition guideline, Health Management Information System Recording and Reporting Procedures Manual, etc).15 16 20 26–28 30 31
The rationale for the review
In Ethiopia, the magnitude of using routine health information for evidence-based decision-making was evaluated by different scholars. However, the review result indicated that there were inconsistent findings ranging from the lowest 22.5%12 to the highest 78.5%30 both in Amhara National Regional State, Ethiopia. Moreover, the lowest and the highest effect sizes were obtained from relatively low (395) and high (720) sample sizes, respectively. Because of this, it would be challenging for managers, planners and health practitioners to decide which evidence to employ for making decisions. Thus, the primary goal of this review was to aggregate the findings of many studies to derive a single impact estimate.
Review questions
What proportion of routinely generated health information is used by healthcare providers in Ethiopia?
What are the factors that are associated with routine health information use among healthcare providers in Ethiopia?
Methods
Protocol and registration
The Preferred Reporting Items for Systematic Reviews and Meta-Analyses 2020 checklist was used to develop the review protocol.32 This review has been registered at PROSPERO with registration identification number CRD42022352647.
Eligibility criteria
The primary research included in the review should focus on the routine health information use, with or without its associated factors. The papers may be published or unpublished but must be written in English. All of the papers reviewed should have been produced and published at any time prior to August 2022. However, publications without a full text and abstract as well as editorial reports, letters, reviews and commentaries were excluded from the study.
Search strategy
Between 20 August 2022 and 26 August 2022, a thorough and methodical search of the literature was conducted using electronic databases such as PubMed, Global Health, Scopus, EMBASE, African journal online, Advanced Google Search and Google Scholar.
Study selection and data extraction
The Mendeley software, author names, location and setting, participant counts, study dates and study duration were all used to remove duplicate papers found in various databases. The inclusion and exclusion criteria of the review were also used for the study selection process. To ensure the homogeneity of our search, each reviewer independently selected the appropriate papers for the review, which were then gathered. This method was in line with the Cochrane review handbook’s fundamental guidelines for choosing studies and extracting data, which note that data may be presented in a number of formats but are commonly translated into a format appropriate for meta-analysis. Additionally, multiple reports of the same study need to be linked together, and data should be extracted from study reports by at least two people, independently.33 So that, this review employed two individuals (MMT and TMY) for both study selection and data extraction.
Both experts received a set of agreed-upon inclusion and exclusion criteria (MMT is the lead researcher and TMY volunteered). Each of them evaluated the articles and decided which ones to include or leave out of the analysis. In light of this, MMT rated 23 articles to be included but rated to exclude 867 articles out of the total articles accessed (890), while TMY rated 20 items to include but rated 870 articles to omit. However, both raters agreed to combine their exclusion of 865 items and inclusion of 18 articles. It was discovered that the computed kappa statistics was 0.80. According to the interpretation of Cohen’s kappa,34 there was a high level of agreement between raters because the kappa value was 0.80, which was between 0.80 and 0.90 and meant that 64% to 81% of the data were considered credible. Because both raters used dialogue to resolve their differences, a third rater was not required. Data about study region, study setting, study year, publication status, study design, sample size, sampling technique and response rate was collected using a checklist.
Outcome measurement and quality assessment
Data extraction was made after a careful review of outcome measurement. The outcome of interest for this review was routine health information use which was defined as the use of routine health data to track daily health service activities, create weekly plans, improve service delivery, display updated data, purchase drugs, mobilise resources, assist community mobilisation, identify the root of a health issue in the community, predict outbreaks and prioritise diseases.11 In order to reduce garbage in, garbage out problem of meta-analysis and Newcastle-Ottawa Quality Assessment Scale (adapted for cross-sectional studies)35 was used as indicated in table 1 below. MMT graded the articles’ quality using an evaluation tool that has three parts: selection (five stars), comparability (two stars) and outcome (three stars) (table 1).
Determining the quality of the original studies that were used in the meta-analysis of routine health information use among healthcare workers in Ethiopia, 2022
Data synthesis and statistical analysis
A Microsoft Excel spreadsheet was used to extract the data, which was then imported into STATA V.14 for analysis. Tables, figures and forest plots were used to describe and summarise the major investigations. A random effects model with a 95% CI was used to pool the magnitude of routine health information use among healthcare providers in Ethiopia. The OR with 95% CI was used to quantify the measure of association for factors that affect routine health information use among healthcare providers. Cochran’s Q and I2 statistics have been used to evaluate the heterogeneity between studies. The percentages of about 25% (I2=25), 50% (I2=50) and 75% (I2=75) would, respectively, indicate moderate, medium and high heterogeneity.36 In order to identify the apples and oranges’ problem of a meta-analysis, subgroup analysis, meta-regression and the Galbraith plot test were conducted. Egger’s regression tests and visual assessment of funnel plot asymmetry were used to determine ‘the file drawer’ problem of meta-analysis (publication bias).
Results
Search results
A total of 890 articles were included for this particular study. From these articles, 345 removed due to duplication and 508 were removed after reviewing its title and abstract for its relevance to the topic. Finally, 23 articles were included for the review (figure 1).

Flow chart of the study selection for systematic review and meta-analysis of utilisation of routine health information and associated factors among health workers in Ethiopia, 2022.
Characteristics of included studies
A total of 20 (97%) primary studies we found were published between 2006 and 2022; the other 3 (13%) primary studies included in the review were not published yet. The majority of these studies (7; 30.43%) were carried out in the Amhara,12 15 18–20 27 30 while 1 (4.3%) was from the Tigray region37 (table 2).
Descriptive summary of primary studies included in the systematic review and meta-analysis of utilisation of routine health information among health workers in Ethiopia, 2022
Meta-analysis
Routine health information use
The summary effect is an estimation of the common effect size in a fixed-effect model, which implies that the true effect size is the same across all studies (sampling error is the only reason for variability). According to a random effects model which also assumes that the true effect size varies from study to study, the studies included in the analysis constitute a random sampling of effect sizes that could have been observed in each study. Our estimation of the mean of these effects is the summary effect (variability of the effect sizes is due to systematic error).33 As can be seen from the forest plot, the existence of high heterogeneity between included studies which could be explained by I2=97.4% (interpreted as 97.4% of the variation in effect sizes is due to between-study heterogeneity not caused by sampling error) at p<0.001. Therefore, a random effects model has a mechanism to handle this variability so that this review employed a random effects model to combine the extent of routine health information use in Ethiopia.
The prevalence of routine health information use in primary studies ranged from 22.5%12 to 78.5%.30 The pooled prevalence of routine health information use in Ethiopia was found to be 53.7% with 95% CI (47.45% to 59.95%) (figure 2).
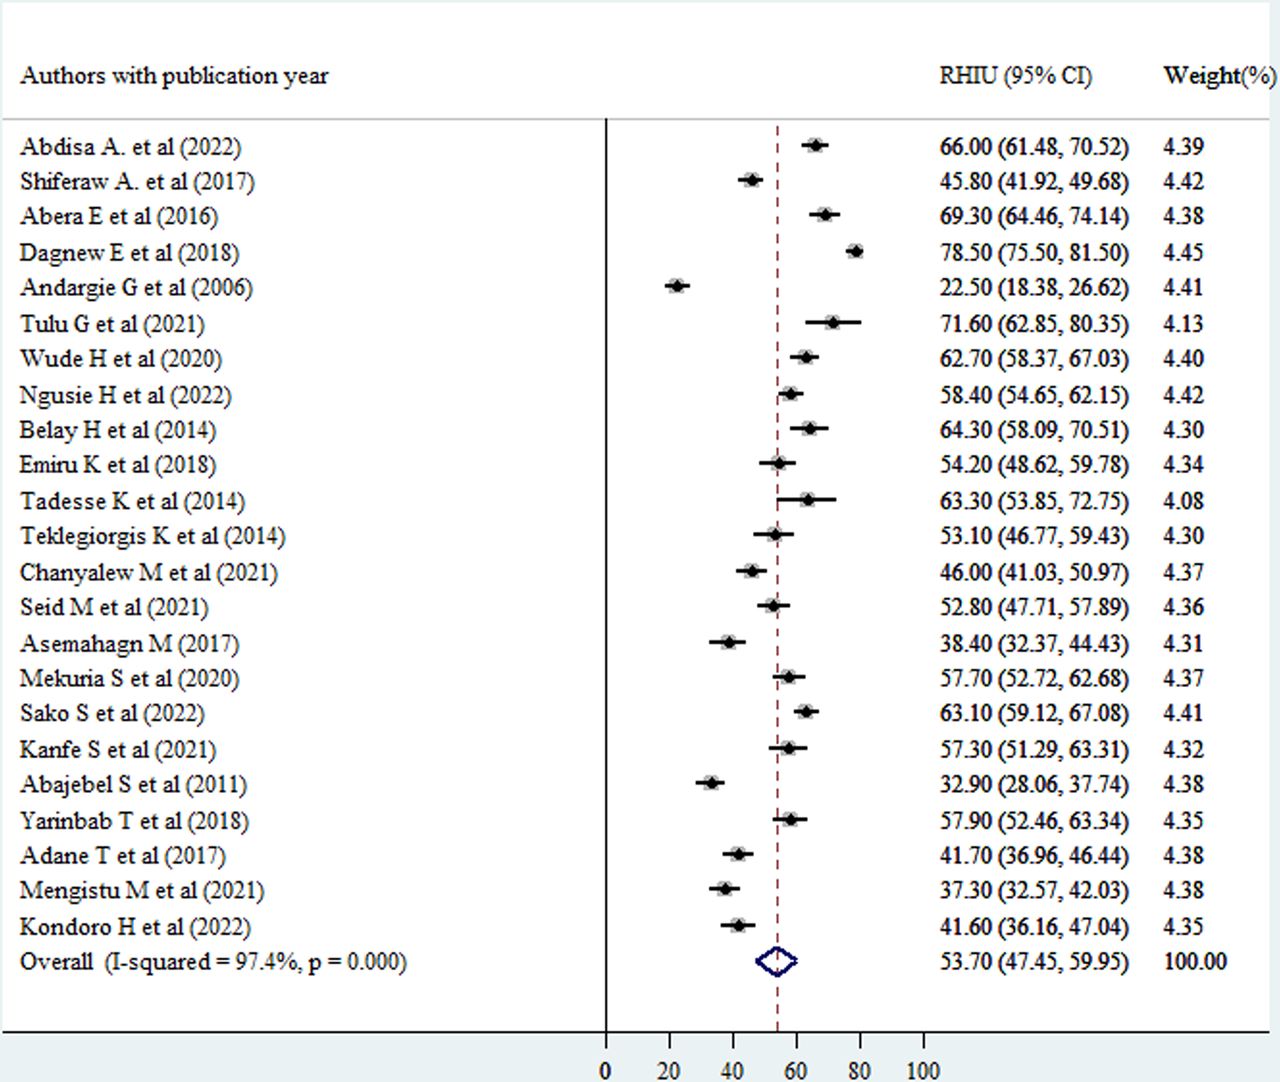
Forest plot showing the pooled level of good routine health information use (Good RHIU) among healthcare providers in Ethiopia, 2022. Note: weights are from random effects analysis.
Subgroup analysis
The authors hypothesised that region and sample size might be the sources of the high heterogeneity between studies included in the review, which was confirmed at the forest plot. In order to determine the most likely reason for heterogeneity, subgroup analysis was carried out by dividing the effect sizes by study region and sample size. The effect size showed a statically significant subgroup effect for study region and sample size at p<0.001, according to the subgroup outcome.
The pooled level of routine health information use was significantly higher in southern Ethiopia (57.2% with 95% CI (48.2% to 66%)), northern Ethiopia (56% with 95% CI (39.8% to 72.3%), eastern Ethiopia (55.83% with 95% CI (51.4% to 60.3%) and western Ethiopia (49% with 95% CI (41.2% to 57%) compared with research articles from central Ethiopia (39.5% with 95% CI (35.19% to 43.81%). There is a statistically significant unexplained variation among articles from northern Ethiopia (I2=98.8%), southern Ethiopia (I2=96.2%) and western Ethiopia (I2=89.3%) at p<0.001, but there was none for eastern Ethiopia (I2=20.2%, p=0.263) and central Ethiopia (I2=39.8%, p=0.198) (figure 3). This suggests that region may be a factor in some subgroups’ heterogeneity but not in others.
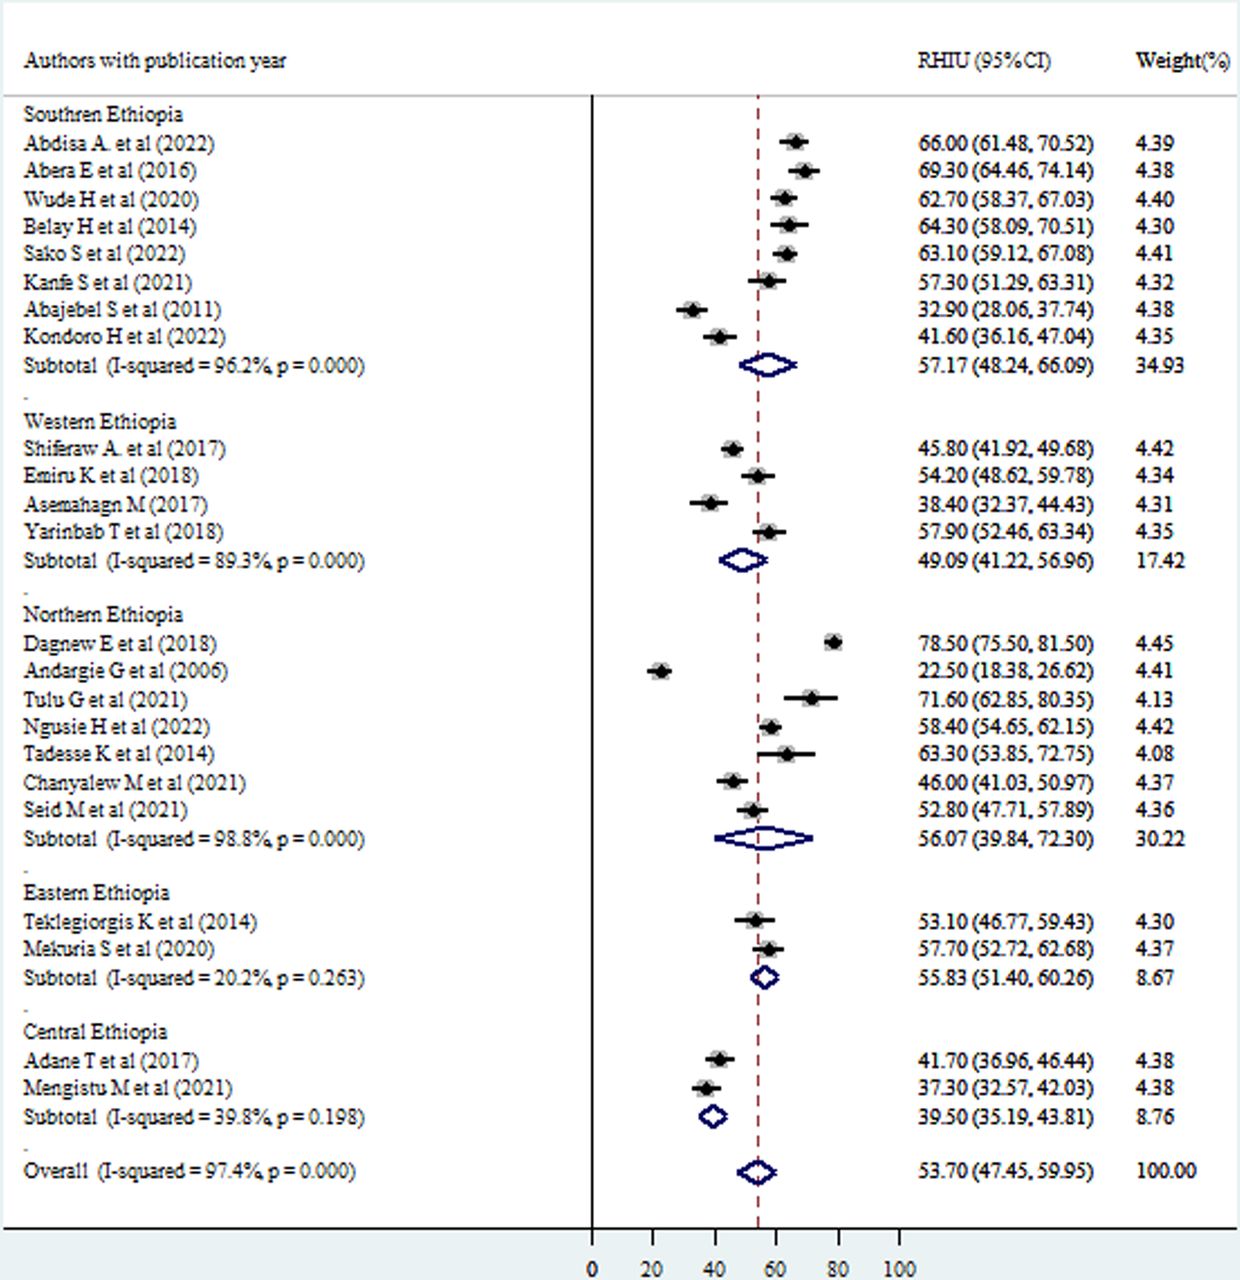
Subgroup analysis of good routine health information use (Good RHIU) by region of the study. Note: weights are from random effects analysis.
Regarding sample size, the pooled magnitude of routine health information use was 67.7% (95% CI (59.5% to 75.8%)), 61.5% (95% CI (47.4% to 75.6%)), 53.3% (95% CI (42.5% to 64%)), 52% (95% CI (37.8% to 66%)) and 48.3% (95% CI (38% to 58.5%)) among subgroups having a sample size of <201, >500, 201–300, 401–500 and 301–400, respectively. There was in fact a substantial heterogeneity within subgroups having a sample size of 201–300 (I2=91.9%), 301–400 (I2=97.3%), 401–500 (I2=97.4%) and >500 (I2=98.4%) at p<0.001, but there was no statistically significant heterogeneity among studies in a subgroup of having a sample size of <201 (I2=37.3%, p<0.206) suggesting sample size is a cause for heterogeneity for some subgroups while it was not for others (figure 4).

Subgroup analysis of good routine health information use (Good RHIU) by sample size. Note: weights are from random effects analysis.
Meta-regression
A meta-analysis with a significant amount of unexplained heterogeneity across the studies included in the review can use the statistical technique of meta-regression. It seeks to determine whether there are differences in study characteristics (methodological diversity) that could account for heterogeneity. This only works for meta-analyses that use a random effects model. Hence, study year and Performance of Routine Information System Management (PRISM) framework use were regressed to explain the existence of heterogeneity. However, the results of the regression analysis showed that there was no statistically significant association between heterogeneity in routine health information use and between study year (p=0.228), and use of PRISM framework (p=0.099) which could be interpreted as sample size and use of PRISM framework were not identified as the causes of heterogeneity as well (table 3).
Meta-regression output for further assessment of causes of heterogeneity of good routine health information use between studies included in meta-analysis in Ethiopia
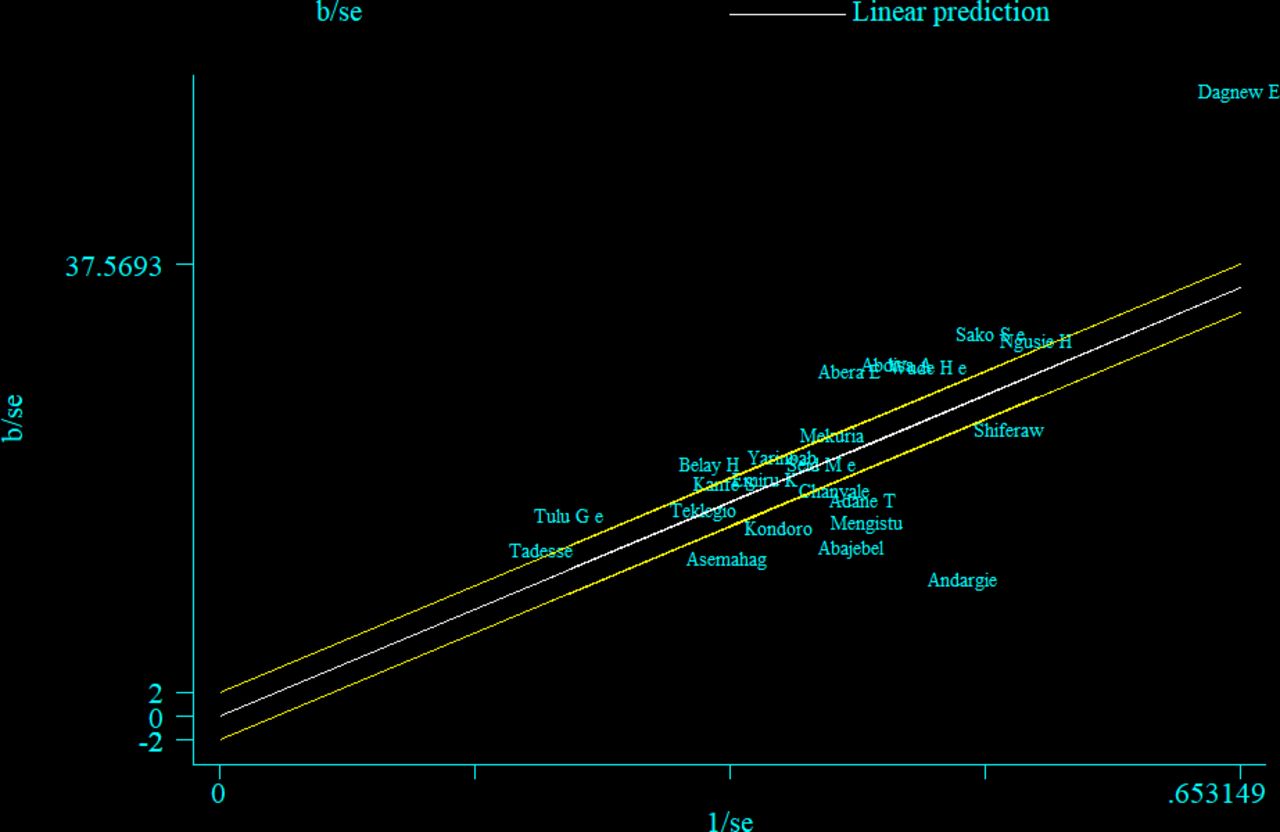
A Galbraith plot test
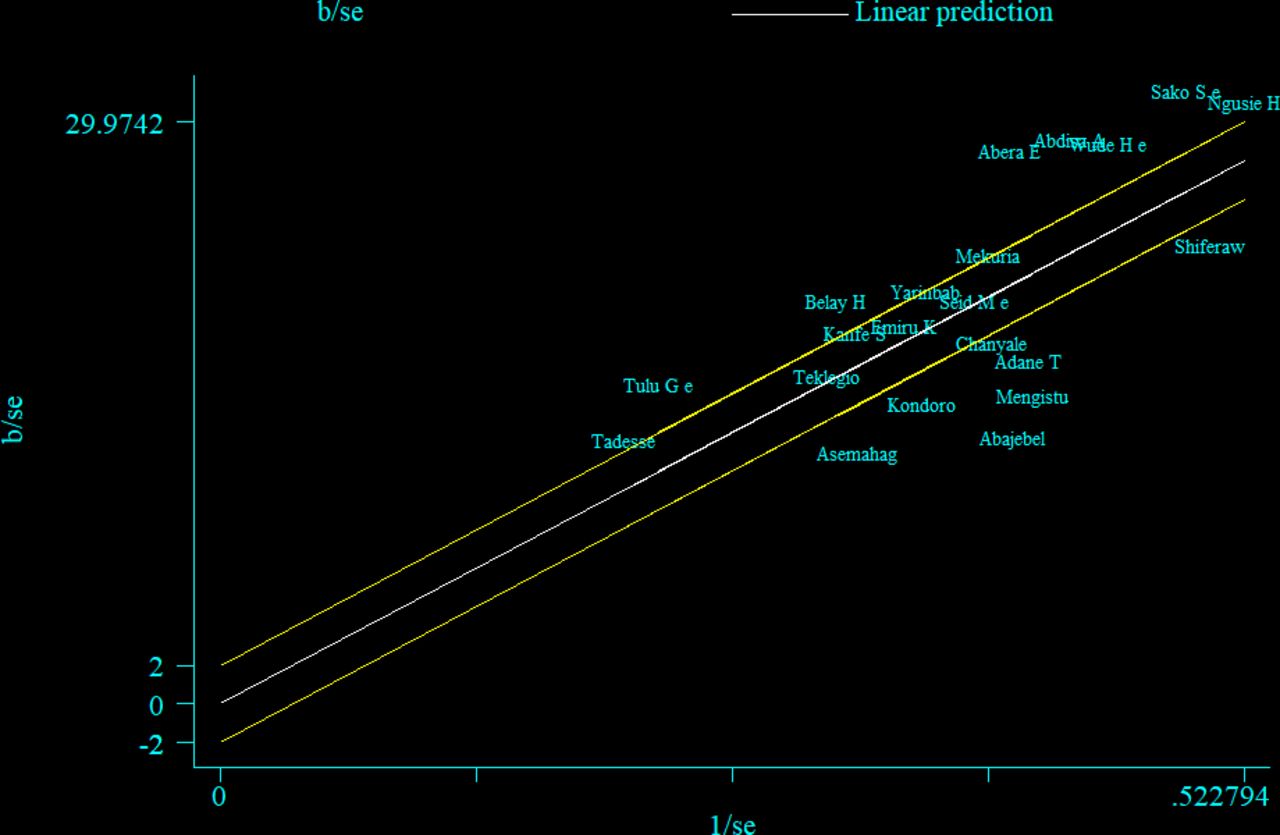
The Galbraith plot was also used to assess heterogeneity and detect potential outliers. In the absence of substantial heterogeneity, we expect around 95% of the studies to lie within the 95% CI region: hence, 17 out of the 23 studies were outside the 95% CI region, which indicates considerable heterogeneity among the effect sizes. Two studies lie further far away from the 95% CI region considered as outliers12 30 (figure 5). Even after removing these studies, 14 out of 21 studies were still outside the 95% CI region (figure 6)

A Galbraith plot of articles included in the review to look for existence of heterogeneity.

A Galbraith plot of articles included in the review to look for existence of heterogeneity after removing outliers.
Assessment of publication bias
A funnel plot was inspected graphically to determine whether it was symmetrical, with the horizontal axis showing the effect estimates from individual studies and the vertical axis reflecting the SE of the effect estimate. Studies with large effect sizes were dispersed at the top of the funnel plot in the diagram, whereas studies with small effect sizes were located at the bottom. The plot’s outcome resembled an inverted funnel with symmetry, showing that there was no publication bias (figure 7). Moreover, the Egger’s test for small-study effects was also performed but unable to show evidence of the existence of publication bias at p=0.396.
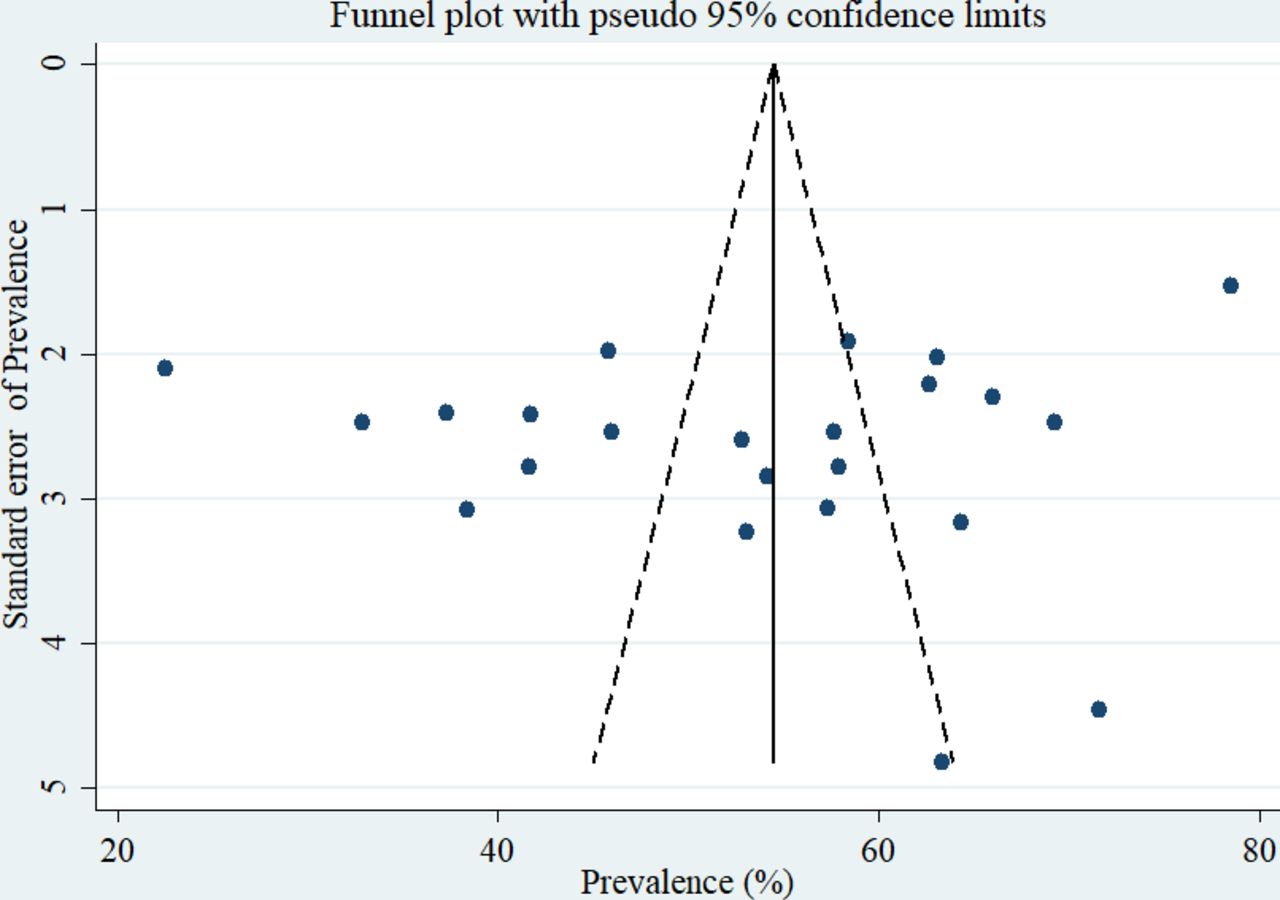
A graphical inspection of publication using a funnel plot of effect sizes versus the SE of the effect sizes in.
Determinants of routine health information use
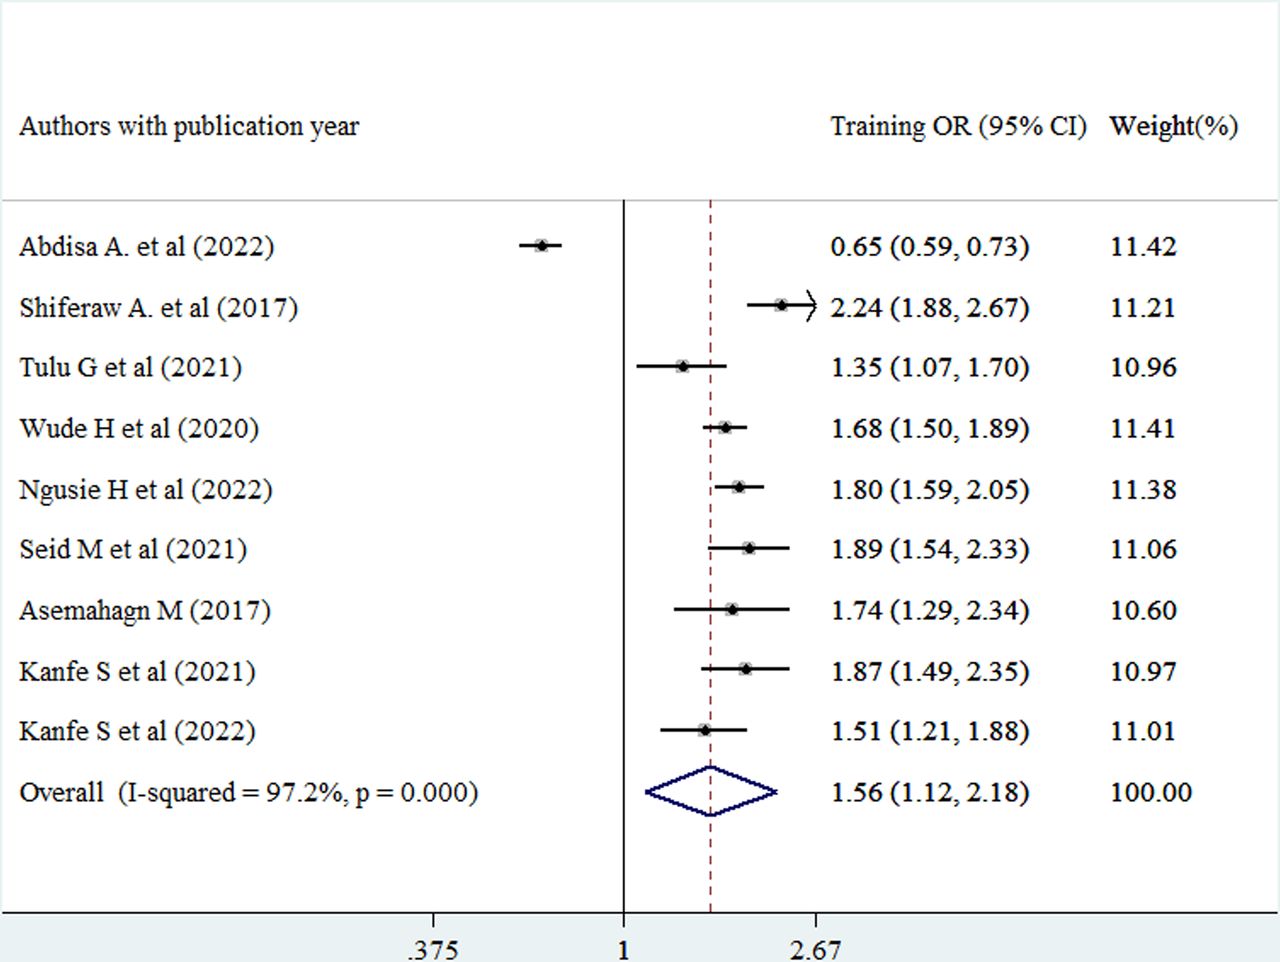
In this review, the pooled estimate indicated that healthcare providers who had training on routine health information use were 1.56 times more likely to use routine health information compared with those who did not have training towards routine health information use (adjusted ORs (AOR)=1.56, 95% CI (1.12 to 2.18)) (figure 8).

Forest plot of the adjusted ORs with corresponding 95% CIs of studies on the association of training against good routine health information use. Note: weights are from random effects analysis.
Healthcare providers competency related to data management was also pooled and healthcare providers having good data management competency were 1.94 times more likely to use routine health information compared with those healthcare providers with poor data management competency (AOR=1.94, 95% CI (1.35 to 2.8)) (figure 9).
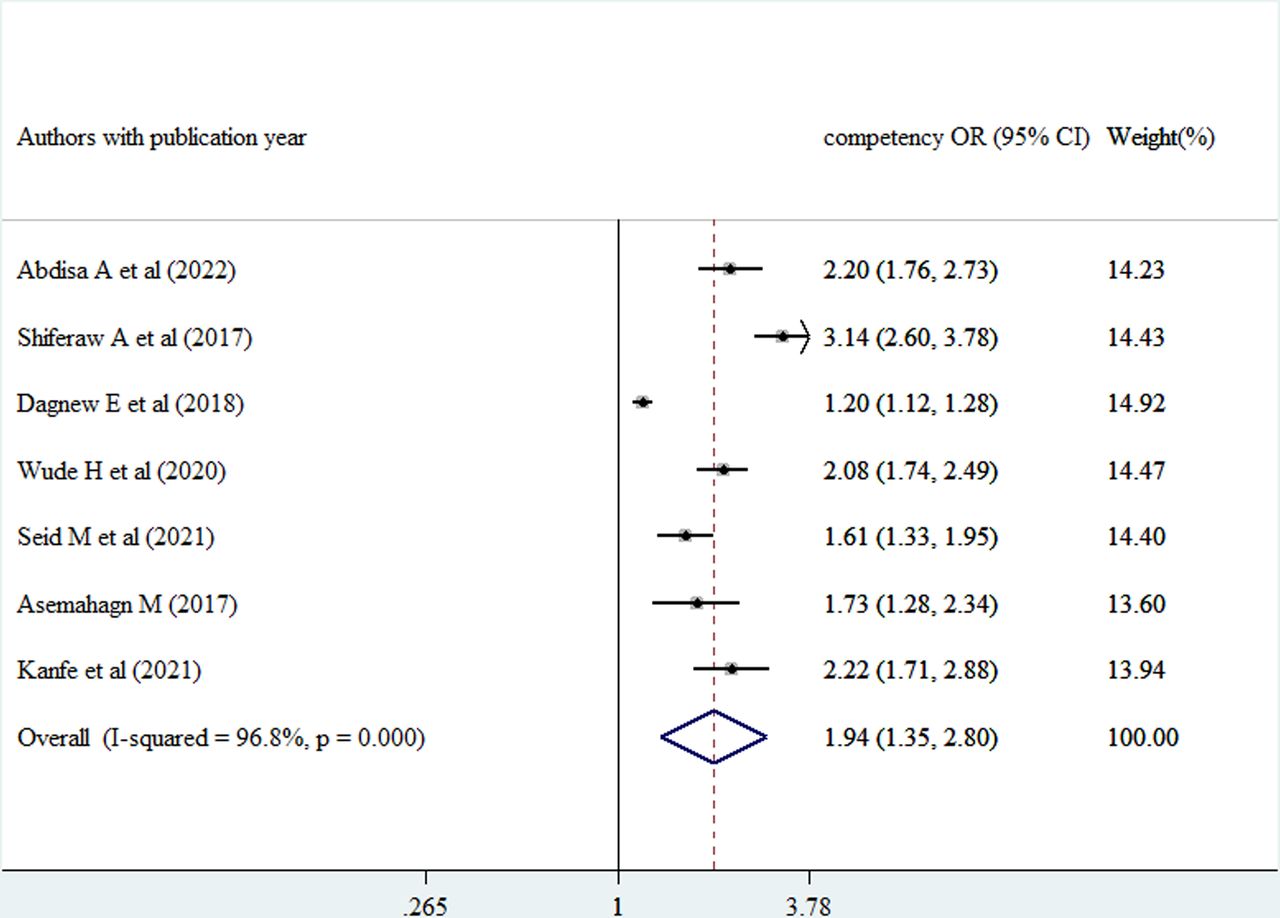
Forest plot of the adjusted ORs with corresponding 95% CIs of studies on the association of competency related to data management against good use of routine health information. Note: weights are from random effects analysis.
The pooled estimate of meta-analysis also indicated that the likelihood of using routinely generated health information was 1.66 times higher among healthcare providers working in institutions with available standardised health information guideline compared with those who were working in institutions without a standardised health information guideline (AOR=1.66, 95% CI (1.38 to 1.99)) (figure 10).

Forest plot of the adjusted ORs with corresponding 95% CIs of studies on the association of availability of standardised guideline against good use of routine health information. Note: weights are from random effects analysis.
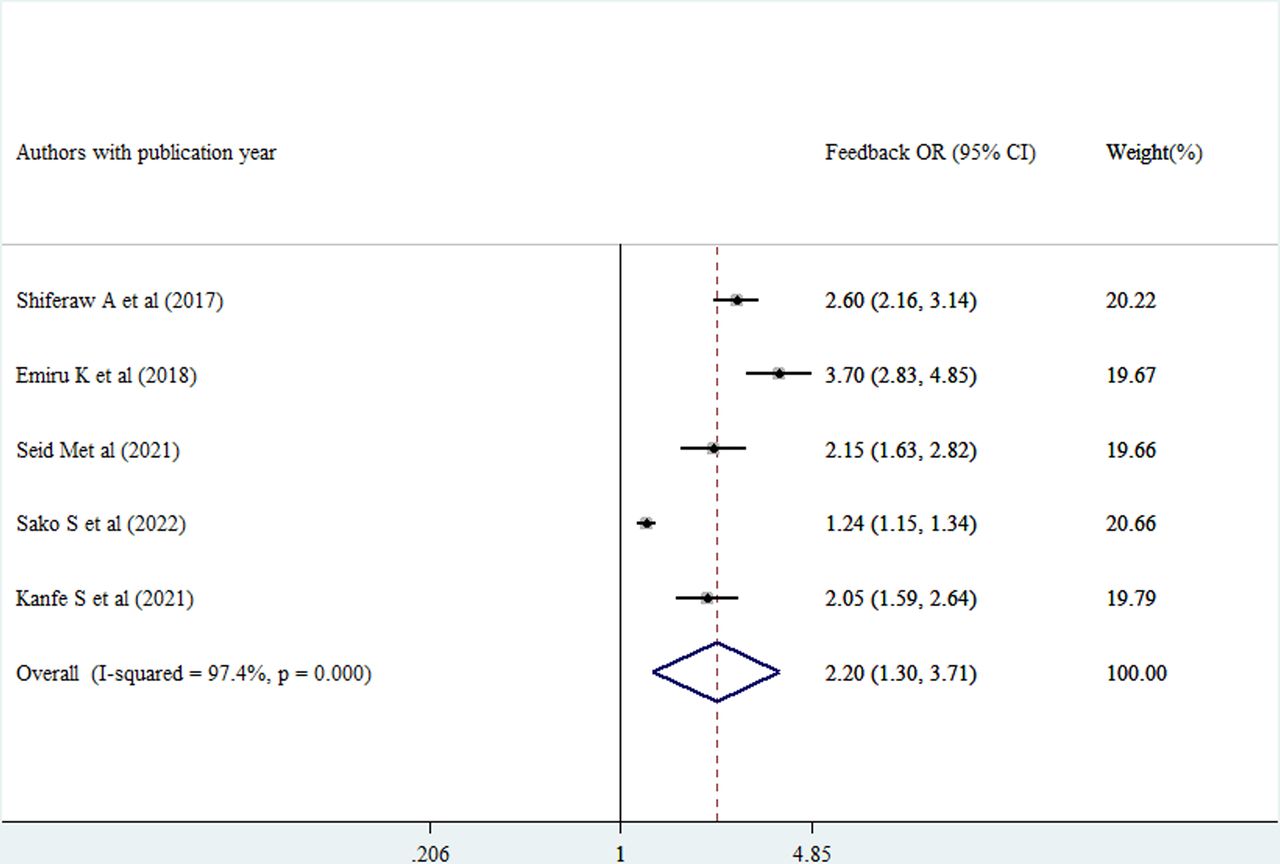
Routine health information use was 2.07 times higher among healthcare providers getting supportive supervision compared with those who did not (AOR=2.07, 95% CI (1.55 to 2.76)) (figure 11). Moreover, the probability of using routine health information was 2.2 times higher among healthcare providers who received feedback compared with those who did not (AOR=2.20, 95% CI (1.30 to 3.71)) (figure 12).
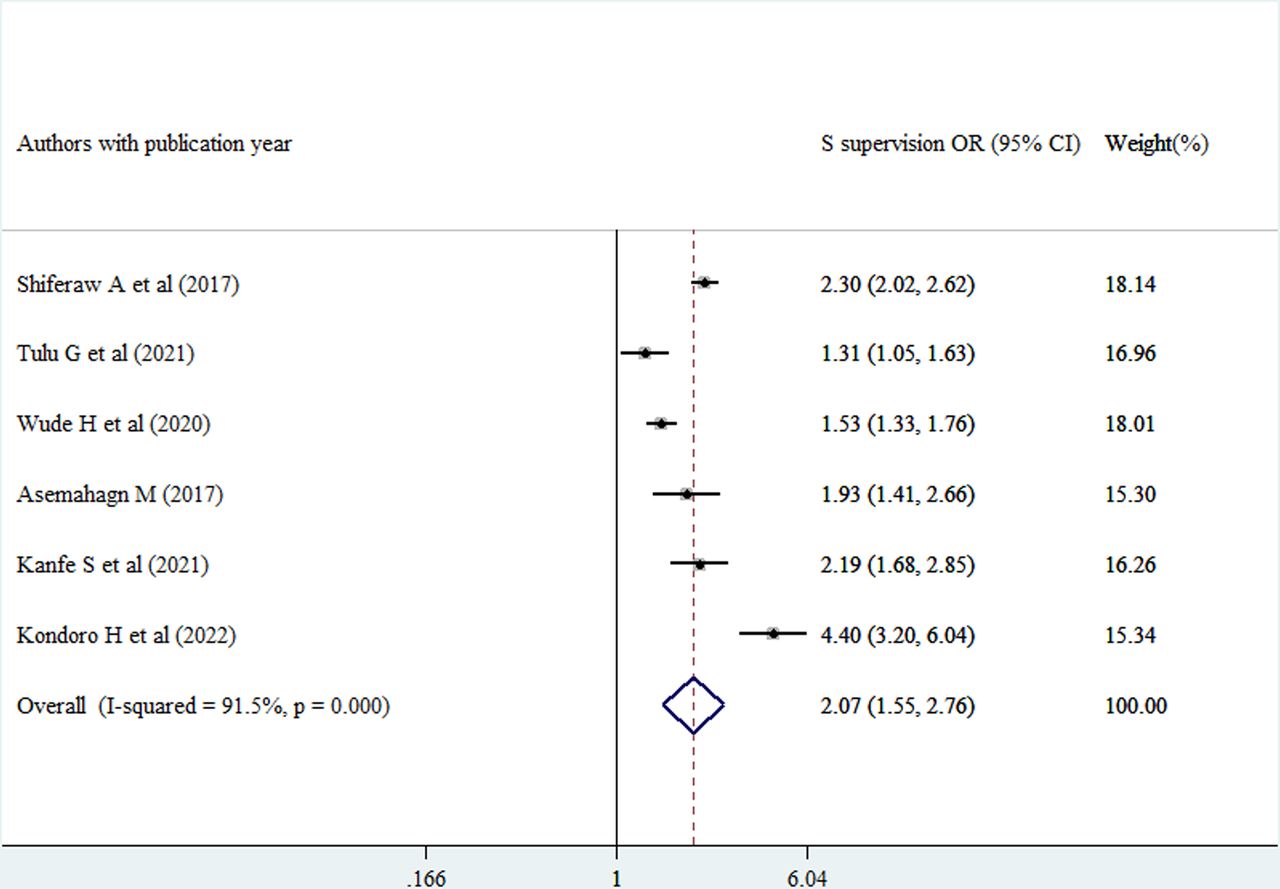
Forest plot of the adjusted ORs with corresponding 95% CIs of studies on the association of Supportive supervision against good use of routine health information. Note: weights are from random effects analysis.

Forest plot of the adjusted ORs with corresponding 95% CIs of studies on the association of feedback against good use of routine health information. Note: weights are from random effects analysis.
Discussion
Most often, healthcare administrators and practitioners fall short of exploiting the everyday data generated in their organisations. Planning, monitoring and evaluation of the services offered are compromised when health information generated daily in facilities is not used. Additionally, it lowers preventative and promotion health services as well as the standard of care provided to patients.38 This review’s main objective was to combine the extent of routinely used health information in Ethiopia after examining conflicting results from several individual research studies.
The pooled prevalence of routine health information use in Ethiopia was found to be 53.7%. In fact, the findings of individual articles across the country significantly vary from region to region and study to study. However, this is less than a systematic review and meta-analysis finding from Ethiopia which was 57.42%11 and other individual research findings from Kenya 66%,39 Tanzania’s of 58%40 and 60%.41 Compared with other earlier review in Ethiopia,11 this review included a lot more articles in its analysis, most of which were published recently. Moreover, the results of individual articles39–41 might have been slightly inflated because systematic reviews are more reliable than individual research findings. Therefore, the evidence produced by this review is much more reliable than the previous review in Ethiopia.11
The pooled estimate of the reviewed literature showed that healthcare professionals who had received training on how to use routine health information were 1.56 times more likely to use routine health information than those who had not. This was consistent with the individual research findings from Kenya,39 Tanzania40 and a systematic review and meta-analysis finding in Ethiopia.11 Moreover, a capacity building and mentorship programme (which included training as part of its intervention) was found to be beneficial at boosting study participants’ ability to use the routine HIS for decision-making19 where all of the literature described existence of a positive association between routine health information use and training.
Healthcare professionals’ data management skills were combined, and those with good data management skills used routine health information 1.94 times more often than those with poor data management skills. This was in line with research from Ethiopia,11 19 42 where data management expertise was found to be favourably linked with routine use of health information by healthcare professionals. Having high proficiency in data management from generation to utilisation is a means to meet that demand. Knowing how crucial it is to base decisions on the correct information is often a requirement for information demand. As a result, the routine use of health information may rise, which may benefit healthcare practitioners with strong abilities in health data management.
The pooled estimate of the meta-analysis also revealed that healthcare professionals were 1.66 times more likely to use routinely generated health information when working in institutions with standardised health information guidelines than when working in institutions without such guidelines. This was in line with the findings from Ethiopia.11 19 The Ethiopian health information system specifically mentions guidelines such as the Revised HMIS indicators definition guide and the HMIS recording and reporting processes handbook that are intended to be used as a reference by all experts in the industry. The instructions’ guidance and clarity may encourage healthcare workers to employ commonly produced health information in the facilities.
Healthcare providers getting supportive supervision were using routinely generated health information two times as high as those healthcare providers who did not get supportive supervision. In Ethiopian healthcare settings, supportive supervision is generally practised, and competency gaps are found using a standardised checklist. In light of the findings, the supervisors are obligated to provide on-the-job training to people who were unable to use the routinely produced health information on their own. Therefore, supportive supervision’s on-the-job training could raise the likelihood that Ethiopian healthcare providers will use routinely generated health information for evidence-based decision-making.
The provision of feedback to healthcare providers’ right after supportive supervision was found to increase 2.2 times routine health information use. Every constructive observation in the Ethiopian healthcare system should be followed by written feedback so that the healthcare professionals being supervised could learn from their mistakes and improve their use of routinely generated health data in their area of responsibility.
Limitations of the review
Even if the review’s researchers did their best to include all pertinent data, some pieces of the literature may still have been left out by the authors.
Though we used different methods to assess causes of heterogeneity, it remained unresolved.
Furthermore, despite using extreme caution when searching, including and omitting publications, the pooled estimate could be affected by these practices.
Conclusion
Ethiopian Ministry of Health and its partners are doing their best to make sure that data generated at all levels of the health system should be transformed into information and the transformed information should be used as evidence to make decisions.
However, this review found that only around half of the information generated routinely in healthcare facilities was used by the healthcare professionals. Routine use of health information in Ethiopia was positively correlated with training, competency related to health data management (data generation to use) and working in facilities having standardised guidelines.
The study’s reviewers suggested that the ministry of health and the appropriate regional health authorities in Ethiopia invest in enhancing the skills of using routinely generated health information among Ethiopian healthcare practitioners through training, encouraging supportive supervision with feedback and the provision of standardised guidelines. Also, the authors of this review would like to recommend to health authorities that they make use of the research’s conclusions when making plans to enhance how routinely healthcare professionals use health information.
Supplemental material
Data availability statement
Data are available upon reasonable request.
Ethics statements
Patient consent for publication
Ethics approval
Not applicable.
Acknowledgments
We would like to thank Yilkal Tefera for his willingness to select study and extract data and Muluneh Alene for his willingness to access commercial databases.
Supplementary materials
Supplementary Data
This web only file has been produced by the BMJ Publishing Group from an electronic file supplied by the author(s) and has not been edited for content.
Footnotes
Contributors MMT, BT, TMY and ZAM were involved in the design, collection, analysis and interpretation of data; in writing the manuscript; and in the decision to submit for publication. MMT designed the study, prepared the protocol, supervised data collection, and analysed and interpreted the data. MMT, BT, TMY and ZAM coached the research from protocol development to data interpretation. MMT drafted and prepared the manuscript. All authors read and approved the final manuscript.
Funding The authors have not declared a specific grant for this research from any funding agency in the public, commercial or not-for-profit sectors.
Competing interests None declared.
Provenance and peer review Not commissioned; externally peer reviewed.
© Author(s) (or their employer(s)) 2023. Re-use permitted under CC BY-NC. No commercial re-use. See rights and permissions. Published by BMJ.
Supplemental material This content has been supplied by the author(s). It has not been vetted by BMJ Publishing Group Limited (BMJ) and may not have been peer-reviewed. Any opinions or recommendations discussed are solely those of the author(s) and are not endorsed by BMJ. BMJ disclaims all liability and responsibility arising from any reliance placed on the content. Where the content includes any translated material, BMJ does not warrant the accuracy and reliability of the translations (including but not limited to local regulations, clinical guidelines, terminology, drug names and drug dosages), and is not responsible for any error and/or omissions arising from translation and adaptation or otherwise.