Article Text

Abstract
Objective To identify undercompensated groups in plan payment risk adjustment that are defined by multiple attributes with a systematic new approach, improving on the arbitrary and inconsistent nature of existing evaluations.
Methods Extending the concept of variable importance for single attributes, we construct a measure of ‘group importance’ in the random forests algorithm to identify groups with multiple attributes that are undercompensated by current risk adjustment formulas. Using 2016–2018 IBM MarketScan and 2015–2018 Medicare claims and enrolment data, we evaluate two risk adjustment scenarios: the risk adjustment formula used in the individual health insurance Marketplaces and the risk adjustment formula used in Medicare.
Results A number of previously unidentified groups with multiple chronic conditions are undercompensated in the Marketplaces risk adjustment formula, while groups without chronic conditions tend to be overcompensated in the Marketplaces. The magnitude of undercompensation when defining groups with multiple attributes is many times larger than with single attributes. No complex groups were found to be consistently undercompensated or overcompensated in the Medicare risk adjustment formula.
Conclusions Our method is effective at identifying complex undercompensated groups in health plan payment risk adjustment where undercompensation creates incentives for insurers to discriminate against these groups. This work provides policy-makers with new information on potential targets of discrimination in the healthcare system and a path towards more equitable health coverage.
- delivery of Health Care
- health care sector
- health equity
Data availability statement
No data are available. Under the requisite data use agreements, data for the analyses are not publicly available. We created a simulated data set and provide our analysis code on GitHub (https://github.com/zinka88/Identifying-Groups).
This is an open access article distributed in accordance with the Creative Commons Attribution Non Commercial (CC BY-NC 4.0) license, which permits others to distribute, remix, adapt, build upon this work non-commercially, and license their derivative works on different terms, provided the original work is properly cited, appropriate credit is given, any changes made indicated, and the use is non-commercial. See: http://creativecommons.org/licenses/by-nc/4.0/.
Statistics from Altmetric.com
Summary
What is already known?
Risk adjustment for health plan payment is known to undercompensate some groups of enrollees.
Undercompensation can lead to discrimination against groups through advertising and insurance benefit design choices.
No standardised method for identifying undercompensated groups exists today.
What does this paper add?
We present a novel method for identifying marginalised groups defined by multiple attributes, with a focus on chronic conditions in plan payment risk adjustment.
Applying our new tool in the health insurance Marketplaces and Medicare, we identify previously unknown undercompensated groups.
This work provides policy-makers a tool for uncovering incentives for selection in insurance markets and a path towards more equitable health coverage.
Introduction
Risk adjustment is an essential tool in regulated health insurance markets. It redistributes health plan payments to insurers with higher cost patients, aiming to decrease the relationship between health and profits to ensure that sicker individuals are not discriminated against by insurers.1 Risk adjustment for health plan payments has been successful in reducing selection incentives for many individuals, but incentives to discriminate still exist for groups of individuals whose costs are underpredicted by the risk adjustment formula, including those with mental health and substance use disorders.2 3
The ability of insurers to discriminate against some groups of patients has been curbed since the passage of the Affordable Care Act (ACA) in 2010, which prevents insurers from refusing enrolment or changing premium prices based on enrollee health. However, insurers are able to attract more profitable enrollees or discriminate against less profitable enrollees through advertising as well as benefit design choices, such as which providers comprise their provider networks and which drugs are placed in higher cost tiers or subject to drug formulary management tools.4–7 Recently, machine learning methods have been used to identify individual conditions that are underpaid by the risk adjustment formula as well as drugs predictive of unprofitability, but these studies did not focus on groups defined by more than one attribute.5 8 In Germany and the Netherlands, researchers have incorporated interactions of variables into the risk adjustment formula based on the partitioning of a single regression tree predicting the residual, but only considered groups defined within the current risk adjustment formula.9 10 To date, no systematic method exists for identifying groups at risk for discrimination in the healthcare payment system, or more broadly in the algorithmic fairness literature, especially groups defined with a more complex set of attributes. Even groups defined by a single sensitive attribute are typically prespecified.11
In this paper, we present the first data-driven method for identifying undercompensated groups in health plan payment risk adjustment that are defined by multiple attributes. Extending the concept of variable importance for single attributes or predefined groups, we construct a new measure of ‘group importance’ in the random forests algorithm that relies on multiple attributes.12–15 Groups are defined based on demographic and clinical categories susceptible to benefit redesign, namely chronic conditions, age and documented sex. We designed our method for the purposes of studying the risk adjustment formulas used in the individual health insurance Marketplaces created by the ACA as well as Medicare. Our newly proposed method for identifying undercompensated groups overcomes the arbitrary nature of existing evaluations of risk adjustment, providing policy-makers with a tool for uncovering incentives for selection that persist in insurance markets and a path towards more equitable health coverage.
Methods
Defining groups
Our primary objective is to identify complex groups vulnerable to discrimination in the health insurance market through benefit design. Therefore, in defining groups, we consider what factors are necessary for this type of discrimination. To start, the groups must be actionable for insurers, meaning the insurers must know which groups are profitable or unprofitable and be able to act on this information via the design of provider networks or drug formularies.16 The losses or gains caused by the group must also be large enough to substantially impact insurers’ revenue. There are a number of factors that could lead to this type of large impact for insurers, including the size of the group, the size of the undercompensation of the group and the persistence of the undercompensation over time.1 For these reasons, we focus on identifying groups defined by prevalent chronic conditions that require specialist care or drug treatments. In addition to chronic conditions, we consider whether age and documented sex affect the size of undercompensation.
Notation
The canonical risk adjustment formula estimates individual annual spending Y using a vector of input variables X that contains j demographic variables,  and k health condition categories,
  or
or  . The risk adjustment formula is some function fmapping X to Y,
  . The residual of the risk adjustment formula,
  , measures the underprediction or overprediction for each individual, where
  is predicted spending. We are interested in the set of groups G predictive of the residual R. To define the groups, we select s indicator variables
  that will comprise the components of the groups in G: a set of chronic conditions, documented sex, and age categories. A group in G is defined as any combination of components in I. This allows us to consider various levels of complex groups. For example, older women with cancer and mental health disorders would be one group and women with mental health disorders another. We examine only binary variables; relaxing this restriction would increase the number of groups substantially.
Estimation
Insurers can adjust their premiums at defined market levels to account for differences in costs in different geographical regions.17 Because we are interested in undercompensated groups within markets, we want to adjust for market-level differences in spending. Therefore, we start by estimating a slightly modified risk adjustment formula using ordinary least squares regression:
where, beyond X, we additionally control for geographic market, Market, to account for routine premium adjustments made at the market level.
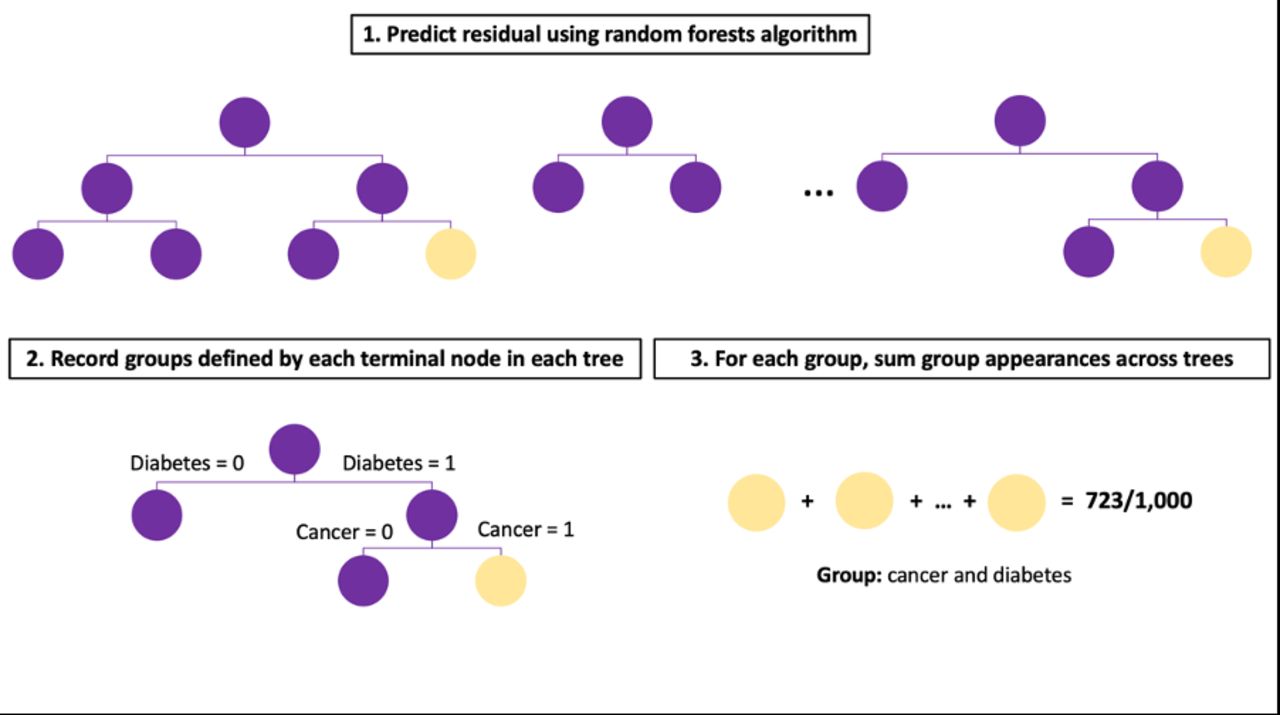
To find the groups in G most predictive of the residual R, we predict R with the group component variables I using the random forests algorithm. The random forests algorithm grows many decision trees to predict R. Each tree uses a bootstrapped sample from the original data to decrease the variance. This is often referred to as bagging, but unlike other forms of bagging, the random forests algorithm also selects a subset of variables to consider at each split point in the tree so the same highly correlated variables do not appear in every single tree.18
Tree-based methods are an intuitive way of forming groups because each decision tree splits the sample into a set of mutually exclusive groups. These groups are defined based on the intersections of the input variables used for predicting the outcome. At each split in the tree, a variable is selected that best partitions the variable space in order to reduce variation within each new node. By using the component variables I to predict R, we naturally create groups in G that are interactions of the component variables in I used to split the tree. For each tree, we find the set of groups that are formed in the terminal nodes. We aggregate this information across all trees, recording the number of times a group appears and its mean estimated residual R across trees and years. See figure 1 for an illustration of this process.

Illustration of random forests for group importance.
The hyperparameters of the random forests algorithm are important for defining group criteria (in addition to algorithmic performance). Through hyperparameter specification, we set the minimise size of groups by requiring a minimum size for terminal nodes in the decision tree. We also control the complexity of the groups by limiting the depth of the tree and the number of terminal nodes. The deeper the tree grows, the more attributes the groups will contain. Recall that typically only a subset of randomly selected variables is considered at each split. By selecting a smaller number of variables at each split, we can decorrelate not only variables across trees but also groups, ensuring that the same groups are not favoured by every tree. And finally, the more trees we grow, the more stable our results will be, but this can be computationally costly and after a certain number of trees only trivially improves stability.19
Marketplaces risk adjustment
In 2014, the Department of Health and Human Services (HHS) developed a risk adjustment formula to redistribute insurer payments in the individual and small group Marketplaces established under the ACA.20 Plans with lower-risk enrollees subsidise plans with higher-risk enrollees through a budget neutral risk adjustment transfer programme regulated by the Centers for Medicare & Medicaid Services (CMS).21 Premiums are set within market rating areas defined by counties or Metropolitan Statistical Areas (MSAs) depending on the state.17 The Marketplaces risk adjustment formula is built using the IBM MarketScan Research Databases, which contain claims on over 23 million individuals receiving employer-sponsored private health insurance in the USA.22
We estimated individual annual spending using the 2019 Marketplaces risk adjustment formula inputs plus geographical fixed effects at the MSA level with the following specification:

where  are age and documented sex categories and HCC are Hierarchical Condition Categories (HCC) mapped from diagnosis codes. We used MSAs as a proxy for premium rating areas in all states because we did not have county information.
Data
To evaluate the Marketplaces risk adjustment formula, we sampled adults (aged 21–64) insured for a full year in either 2016, 2017 or 2018 from the MarketScan data. We calculated individual annual spending as the total spending across the individual’s outpatient, inpatient, and carrier claims in the given year. The traditional risk adjustment formula predicts insurer spending, but for simplicity we used total spending, which included patient cost sharing. Age, documented sex and MSA information was obtained from the enrolment file. HCC variables were constructed by mapping International Classification of Diseases 10th Revision (ICD-10) diagnosis codes recorded in the inpatient, outpatient, and carrier claims using the 2019 HHS-HCC software. We considered age categories (21–29, 30–39, 40–49, 50–59, 60–64), documented sex and 12 chronic condition indicators (arthritis, asthma and other respiratory conditions, cancer, diabetes, heart disease, hypertension, kidney disease, hyperlipidaemia, mental health and substance use disorders, nervous system conditions, osteoporosis and viral infections) as component variables to define groups in G. These 12 conditions were selected because they are common chronic conditions monitored by CMS.23 The chronic conditions indicators were created using individual and multilevel diagnosis-based categories from the Agency for Healthcare Research and Quality Clinical Classification Software (see online supplemental table S1 for mapping). These categories incorporate more ICD-10 diagnosis codes than HCCs, and therefore, allow for identification of health states not captured by HCCs.
Supplemental material
Implementation
We sampled 1 million individuals for each sample year and ran separate ordinary least squares regressions to predict annual spending. We then deployed the random forests algorithm to predict the residual for each sample year. We identified groups under different size and complexity hyperparameters holding the number of trees (1000) and the number of component variables selected at each branch (10) constant. This resulted in four hyperparameter settings: (1) minimum size=100 and maximum nodes=8, (2) minimum size=100 and maximum nodes=64, (3) minimum size=10 000 and maximum nodes=8 and (4) minimum size=10 000 and maximum nodes=64. The random forests algorithm was run in R using the randomForest package.24 To ensure that identified groups persisted in all three sample years with some frequency across trees, we limited the results to groups that appeared in at least 1% of the trees in each sample year. Predicted versus observed residuals for each identified group were compared to assess the accuracy of our predictions.
Results
Table 1 summarises the Marketplaces sample characteristics for each sample year. About 52% of the sample was documented as female. The sample was fairly evenly distributed across the five age categories with more enrollees in their 50s than any other age group (26.6%–27.2%). Of the 12 chronic conditions, hypertension was the most common, documented in about 14% of the sample. Osteoporosis, chronic kidney disease and chronic viral infections were the least common, appearing in <1% of the sample. For each sample year, we observed an average undercompensation of around US$1500–US$5000 for most of the selected chronic conditions. Diabetes was the least undercompensated group with an average undercompensation of a few hundred dollars (see table 2). Average annual spending ranged from US$6500 to US$7000 in the study period.
Marketplaces sample characteristics (in per cents)
Marketplaces average residual (US$) by chronic condition
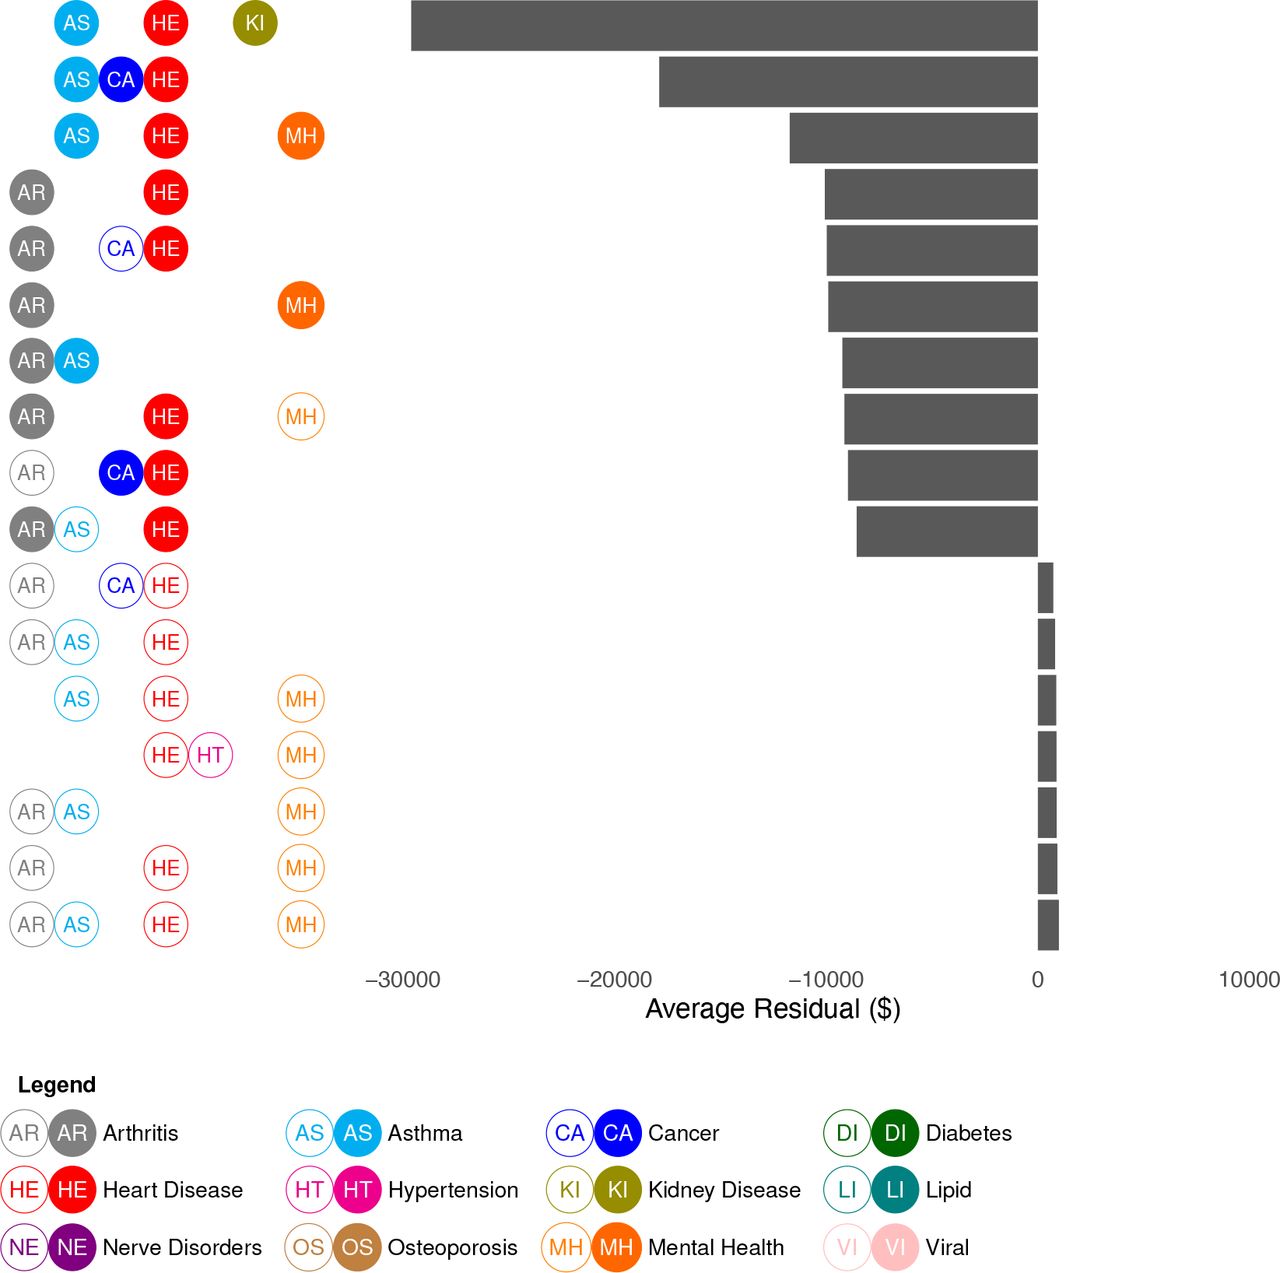
In general, all four hyperparameter settings yielded similar results. Individuals with multiple chronic conditions, in particular enrollees with some combination of asthma, heart disease, arthritis and mental health and substance use disorders, tended to be undercompensated whereas individuals with no chronic conditions were overcompensated. In figure 2, we present the top undercompensated and overcompensated groups (measured by the average residual across the three sample years) limiting the group size to 10 000 and maximum nodes to 8. Predicted undercompensation was substantially larger than overcompensation. The groups we identified with multiple chronic conditions were undercompensated, on average, by at least US$10 000 and up to US$29 600, whereas overcompensated groups were all overcompensated by less than US$1000. Also, the predicted residuals for groups defined by multiple attributes were larger than the average residuals for each condition individually. For example, individuals documented as having a combination of asthma, heart disease and mental health and substance use disorders were estimated to be undercompensated by up to US$12 000 on average, which is more than the sum of their observed average residuals.

Top undercompensated and overcompensated groups in the Marketplaces risk adjustment (minimum node size: 10 000, maximum nodes: 8). Unfilled circles indicate the lack of a condition. Only seven overcompensated groups were identified in this setting, after removing groups that appeared in less than 1% of trees across the 3 years.
When we allowed for smaller (minimum group size=100) and more complex groups (maximum nodes=64) we saw groups with more conditions appear in the top 10 (figure 3). Namely, we identified more groups with asthma, cancer, hypertension, chronic kidney disease and mental health and substance use disorders. Interestingly, we also found that most top overcompensated groups were older, but relatively healthy individuals. In general, tuning the maximum node size, which limits the depth of the trees, was more important for determining group complexity than limiting the size of the groups. Some chronic conditions, such as chronic viral infections and disorders of lipid metabolism as well as documented sex, rarely if ever appeared as components in our identified groups.

Top undercompensated and overcompensated groups in the Marketplaces risk adjustment (minimum node size: 100, maximum nodes: 64). Unfilled circles indicate the lack of a condition.
When we disaggregated the results by year, we observed the same pattern of undercompensation for enrollees with multiple chronic conditions and overcompensation for those without, but there was some temporal variation in the types of conditions that were identified (online supplemental figure S1). For example, in 2016, 5 out of the 10 top undercompensated groups were identified as having a hereditary and generative nervous system in addition to other chronic conditions, but this attribute did not appear in later years.
In online supplemental text, we present results from the other setting we considered: identifying undercompensated groups in the Medicare risk adjustment formula used by CMS to set capitation rates for Medicare Advantage plans. We found no groups that were consistently undercompensated or overcompensated across the three sample years.
Discussion
In this research, we presented a new approach for identifying undercompensated groups defined by multiple attributes, extending the random forests algorithm to determine group importance without requiring groups to be prespecified. We implemented our group importance algorithm on the Marketplaces and Medicare risk adjustment formulas. The Marketplaces formula favoured healthier individuals compared with those with multiple chronic conditions. In particular, groups that had some combination of asthma, heart disease, arthritis and mental health and substance use disorder were largely undercompensated. These results expand on and re-enforce earlier work exploring issues of undercompensation in risk adjustment for people with multiple chronic conditions.25 Undercompensation in the Medicare risk adjustment formula was smaller in magnitude compared with the Marketplaces formula and no groups were persistently undercompensated or overcompensated across the three sample years. This suggests that the Medicare risk adjustment formula may induce fewer incentives to discriminate with respect to the twelve selected conditions.
Our results raise the question of how to address incentives in insurance markets, especially for people with multiple health conditions. There are numerous approaches for improving risk adjustment performance aimed at removing selection incentives in regulated insurance markets. The Marketplaces aim to partly address undercompensation for enrollees with two chronic health conditions, where one condition is severe, by including interactions in the risk adjustment formula.20 Given our results, additional interactions for those with multiple chronic conditions could be beneficial. However, in Germany and the Netherlands, researchers found mixed results when they included the interactions found in a single regression tree predicting the residual, sometimes leading to negative consequences for other groups.9 10 While not yet used in practice, machine learning methods have also been proposed as an alternative to predict spending and may be better able to capture non-linear spending trends for enrollees with multiple chronic conditions.26 Another plausible option could be to enforce improved fit for selected groups through constrained or penalised regression, incorporating group fairness directly into the loss function where negative consequences for other groups were not observed.27 28 Solutions to discrimination via insurance benefit design may lie outside of the risk adjustment formula itself and be better addressed by, for example, additional legal remedies, such as requiring adequate coverage of treatments and services by insurers for the set of conditions we identified.
This work has several limitations. We developed a methodology that focused on groups with the largest magnitude average residual that appeared in all three sample years. The groups were composed of conditions that we considered actionable for insurers, but we did not consider a priori whether certain combinations of conditions (or lack of conditions) would be more actionable for insurers compared with others. In our algorithm, we set the size and number of terminal nodes in order to restrict the size and complexity of a group, but future work could develop more sophisticated algorithms that aim to empirically examine whether specific combinations of chronic conditions are actionable for insurers within the decision rules of the tree rather than post hoc.
The techniques we presented are relevant to other insurance markets relying on risk adjustment. They can be used by developers and evaluators of risk adjustment formulas to identify and assess performance across many different groups defined by multiple attributes. In this paper, we focused on 12 chronic conditions, but our method allows for the inclusion of additional chronic conditions and other variables appropriate for identifying groups, subject to computational constraints and ethical factors. Variable choices will be limited by data availability: while countries like the USA and the Netherlands have rich data sources to construct and assess their risk adjustment formulas, not all countries have access to such detailed data.1
Our group importance method may be relevant in a wide range of applications beyond risk adjustment, although we caution researchers to carefully consider the context before attempting to identify potentially marginalised groups. In some settings, identifying groups could actively cause harm, for example, may involve collecting or amplifying stigmatising information. In other cases, our tool may be useful in mitigating ongoing harms. Machine learning predictions for clinical outcomes have been found to be less accurate for groups defined by age, race or other attributes, contributing to health disparities.29 Our new method could help ensure that algorithms deployed in such settings remedy inequities for currently unidentified marginalised groups. We recommend researchers create a social impact statement and follow an ethical pipeline for building algorithms when considering adapting our tool to any setting.29 30
Data availability statement
No data are available. Under the requisite data use agreements, data for the analyses are not publicly available. We created a simulated data set and provide our analysis code on GitHub (https://github.com/zinka88/Identifying-Groups).
Ethics statements
Patient consent for publication
Acknowledgments
The authors thanks Thomas G. McGuire, Richard van Kleef, and participants at the 2020 Risk Adjustment Network Meeting for helpful comments.
References
Supplementary materials
Supplementary Data
This web only file has been produced by the BMJ Publishing Group from an electronic file supplied by the author(s) and has not been edited for content.
Supplementary Data
This web only file has been produced by the BMJ Publishing Group from an electronic file supplied by the author(s) and has not been edited for content.
Footnotes
Contributors Both authors contributed to the conceptualisation of the work. SR supervised the work. AZ performed the analysis and drafted the manuscript. Both authors reviewed and edited the manuscript.
Funding This work was supported by National Institute of Health Director’s New Innovator Award grant number DP2-MD012722 and the National Science Foundation Graduate Research Fellowship Programme.
Competing interests None declared.
Provenance and peer review Not commissioned; externally peer reviewed.
Supplemental material This content has been supplied by the author(s). It has not been vetted by BMJ Publishing Group Limited (BMJ) and may not have been peer-reviewed. Any opinions or recommendations discussed are solely those of the author(s) and are not endorsed by BMJ. BMJ disclaims all liability and responsibility arising from any reliance placed on the content. Where the content includes any translated material, BMJ does not warrant the accuracy and reliability of the translations (including but not limited to local regulations, clinical guidelines, terminology, drug names and drug dosages), and is not responsible for any error and/or omissions arising from translation and adaptation or otherwise.