Article Text

Abstract
Background Consistent and standardized coding for chronic conditions is associated with better care; however, coding may currently be limited in electronic medical records (EMRs) used in Canadian primary care.
Objectives To implement data management activities in a community-based primary care organisation and to evaluate the effects on coding for chronic conditions.
Methods Fifty-nine family physicians in Toronto, Ontario, belonging to a single primary care organisation, participated in the study. The organisation implemented a central analytical data repository containing their EMR data extracted, cleaned, standardized and returned by the Canadian Primary Care Sentinel Surveillance Network (CPCSSN), a large validated primary care EMR-based database. They used reporting software provided by CPCSSN to identify selected chronic conditions and standardized codes were then added back to the EMR. We studied four chronic conditions (diabetes, hypertension, chronic obstructive pulmonary disease and dementia). We compared changes in coding over six months for physicians in the organisation with changes for 315 primary care physicians participating in CPCSSN across Canada.
Results Chronic disease coding within the organisation increased significantly more than in other primary care sites. The adjusted difference in the increase of coding was 7.7% (95% confidence interval 7.1%–8.2%, p < 0.01). The use of standard codes, consisting of the most common diagnostic codes for each condition in the CPCSSN database, increased by 8.9% more (95% CI 8.3%–9.5%, p < 0.01).
Conclusions Data management activities were associated with an increase in standardized coding for chronic conditions. Exploring requirements to scale and spread this approach in Canadian primary care organisations may be worthwhile.
- chronic diseases
- clinical audits
- electronic medical records
- meaningful use
- primary health care
Commons license http://creativecommons.org/licenses/by/4.0/
Statistics from Altmetric.com
INTRODUCTION
Chronic diseases are largely managed in the primary health care setting.1–3 The adoption of electronic medical records (EMRs) in primary care has been associated with expectations that these applications would support quality improvement efforts for chronic conditions.4,5
However, the implementation of EMRs has not been consistently associated with better care.6–10 Improvements in care require management of data to support quality improvement activities.11,12 Gaps exist in terms of the EMR software used to manage data, the availability of data management personnel in primary care and the quality of data in the EMRs.
EMR applications were built to help record care for individual patients rather than for analyzing data to manage quality for practice populations.12,13 These applications often have rudimentary reporting, data export and analytic capabilities.14 In addition, running large queries can tax servers, slowing them down and interfering with daily clinical activities.15
In primary care, EMR-based measurement has often relied on the efforts of individual physicians in querying their own applications. Physicians may be often be too busy with daily patient care and may not have time to undertake these activities.16,17 Primary care teams may be able to reallocate some of the work of measuring and reporting care and outcomes to nonclinical team members such as data managers.18–20
The quality of data in EMRs continues to present challenges.21–24 Diagnostic coding may be missing.25 Free text may be used instead of structured data and data may be entered in inconsistent fields.26–34 EMRs often require structured or coded data to enable automated recalls, point of care reminders, practice population quality improvement activities and computerized decision support.4,11,35,36
A recent analysis of 11.5 million primary care electronic records in the U.S. found significantly better quality of care for patients when a coded diagnosis of diabetes was present in the problem list.25 Lack of standardization and coding in EMRs is associated with challenges in benchmarking and comparisons, which are important activities for primary care clinical quality improvement efforts.37,38 As a result, there have been calls to improve data and implement consistent coding for chronic conditions in primary care.39
Changes in the organisation of primary care in Ontario, Canada
Primary care in Ontario, Canada, has recently evolved through the formation of interdisciplinary family health teams (FHTs)40 and the adoption of EMRs. Currently, almost 3000 family physicians are working in 240 FHTs and are serving 3 million patients or 25% of Ontario’s population.41,42 Eighty-five percent of Ontario’s family physicians report using an EMR.43
Evidence to date on improvement in FHT performance is limited,44,45 and until recently, FHTs had not been required to systematically report quality of care.
As of 2013, the Excellent Care for All Act 2010 in Ontario46 mandated the development and public reporting of quality improvement plans by FHTs. The Ministry of Health and Long Term Care of Ontario recently funded quality improvement and decision support specialist (QIDSS) positions to provide analytic services to FHTs.47
Our objectives were to describe the adoption of data management activities in a primary care organisation in Ontario, Canada, and to evaluate effects on coding to support the formation of registries of specific chronic conditions.
METHODS
Setting
This project was conducted at North York Family Health Team (NYFHT). At the time of the study, the FHT included 67 community-based family physicians and 43 allied health professionals practicing out of 17 clinical locations and providing care for over 65,000 patients (http://nyfht.com).
EMR systems had been adopted by physician groups prior to the foundation of the organisation. Physicians in the FHT used two of the most common EMR applications in Ontario: Nightingale onDemand® and TELUS Practice Solutions Suite®. These software applications accounted for 45% of the Ontario market share as of 31 October 2014.48 Data were distributed across multiple servers with no communication across servers. A major challenge for the organisation was therefore the management of data residing in different server silos and different EMR systems, leading to substantial difficulties in merging data into a single reporting system, conducting analyses and generating amalgamated reports across the FHT.
Planning the intervention
We based this project on the data infrastructure provided by the Canadian Primary Care Sentinel Surveillance Network (CPCSSN). CPCSSN is Canada’s largest multi-disease EMR surveillance system.26 It includes 11 primary care practice based research networks in seven provinces and one territory across Canada. Consenting family physicians and other primary care providers participating in CPCSSN contribute EMR data; anonymized data extracted from different EMR applications are further deidentified in several stages of processing and are sent via secure electronic file transfer protocols to a CPCSSN regional data repository where they are cleaned, standardized and then aggregated into a single national database.26,49 Case definition algorithms in the CPCSSN database have been validated using chart audits for eight chronic conditions (diabetes, hypertension, chronic obstructive pulmonary disease (COPD), depression, osteoarthritis, dementia, parkinsonism and epilepsy).50
The Data Presentation Tool reporting software
The CPCSSN Data Presentation Tool (DPT) was developed by one of the CPCSSN data managers (DJ). The DPT allowed intuitive visualization and reporting using CPCSSN data. It used Boolean terms to query both original data as extracted by CPCSSN from EMRs and cleaned, standardized data. Figure 1 presents a screenshot of the DPT. DPT can export the results of queries for further manipulation, analysis or importing to statistical software.

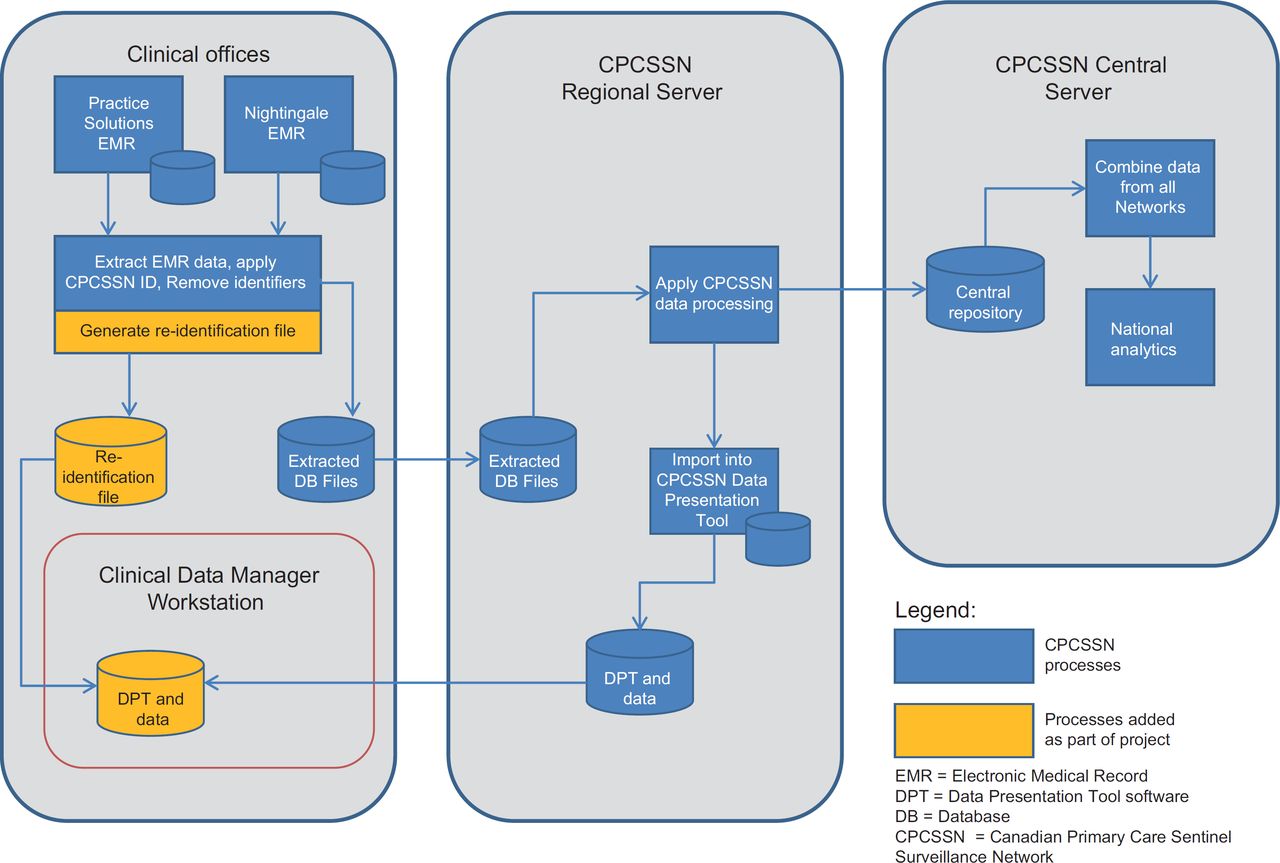
For this project, data originating from NYFHT were merged and cleaned as part of the usual CPCSSN processes. These data were then transferred back to the organisation along with the DPT software as shown in Figure 2.

Patient and provider re-identification processes
In order to implement data and quality improvement activities, both patients and physicians needed to be identified. This required the reidentification of the returned CPCSSN data. During the quarterly data extraction for the CPCSSN, a data linkage file was generated and remained on site at NYFHT. This file contained an identifier generated by the patient’s EMR and a linked, randomly generated number for CPCSSN and enabled reidentification.
Development of data governance, privacy and security procedures
The demonstration project required a team-based approach for data governance and privacy. The NYFHT Information Management–Information Technology Committee oversaw data governance. A privacy impact assessment and threat risk assessment were conducted by independent, external reviewers to ensure that sufficient physical, organisational and technological safeguards were operationalized.
Planning the study of the intervention
Data standardization for selected chronic conditions
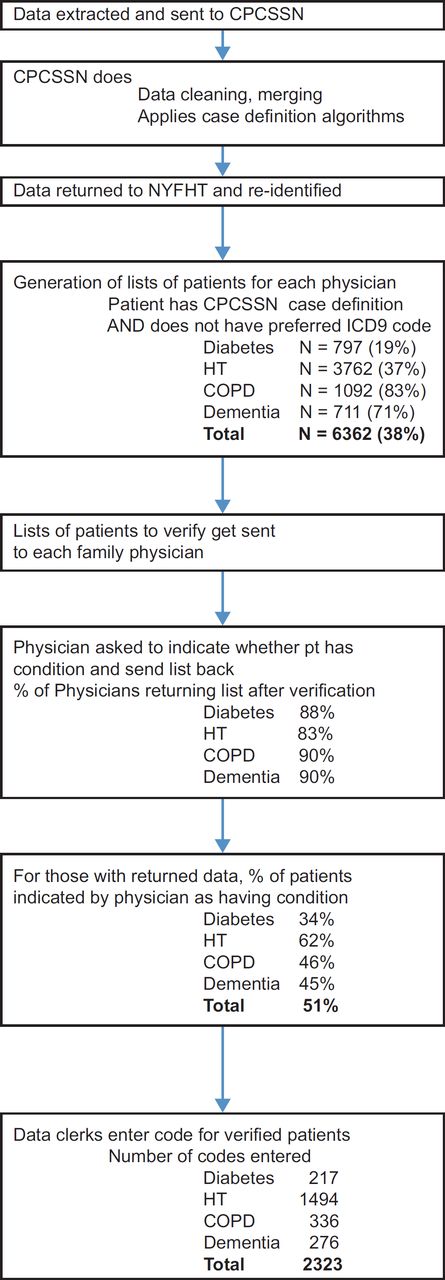
Following team discussions, the Information Management–Information Technology Committee oversaw the implementation of registers of chronic conditions through standardized coding for chronic diseases. International Classification of Diseases, version 9 (ICD9) codes were used; physicians were familiar with this coding method as it was used for provincial billing. The codes were diabetes-ICD9 250, chronic obstructive pulmonary disease-496, hypertension-401 and dementia-290. These codes were used in the validated CPCSSN case definitions.51 The FHT chose the codes most commonly used across CPCSSN for each condition as their preferred codes. Following a feasibility project,52 the DPT was used to generate lists of patients that met CPCSSN case definitions and that did not have the approved code in their problem list. Each patient was associated with a physician defined as being most responsible for their primary care in the EMR. The lists were then faxed to physicians for verification. Once verified lists were returned, data entry clerks entered coded data into the EMRs.52
We used a parallel cohort design to study the effectiveness of the intervention. We compared changes in standardized coding for four chronic conditions. The primary outcome was the proportion of coded chronic conditions we studied present in the problem list. We compared the change in the proportion of coded entries over a six month period (31 March 2013 to 30 September 2013) between physicians exposed to the intervention and a parallel cohort of unexposed physicians.
Data sources
We used CPCSSN data extracted from the EMRs as of 31 March 2013 and 30 September 2013. We included data for all patients who had at least one encounter with their practice in the past 24 months as of 31 March 2013 and who did not opt out of participation in CPCSSN. Less than 0.01% of patients decline participation.53 We included data for all physicians participating in both 31 March 2013 and 30 September 2013 who had data available for both extractions. Data extraction procedures have been described previously.26
We used the following data elements from the EMR: dates of each encounter in the past two years prior to 31 March 2013 to estimate utilization in primary care, presence or absence of selected chronic conditions using validated algorithms for case definitions,50 patient age as of 31 March 2013, patient gender, and size of practice for each physician.54 Physicians filled out a survey for CPCSSN; we used the following data from the survey: physician age, gender, urban/suburban/rural practice location and number of years of EMR use. Characteristics of patients and providers are shown in Table 1.
Statistical analysis
For each chronic disease of interest, we used number of cases with validated CPCSSN definitions as the denominator and the number of codes present in problem lists for the conditions as the numerator for both cohorts. CPCSSN case definitions include multiple chart elements, such as problem list codes, free text terms for a condition, billing codes and laboratory values.51
We compared the change in the proportion of coded diagnoses for physicians exposed to the processes and a parallel cohort of CPCSSN physicians not exposed, over a six-month period (from 31 March 2013 to 30 September 2013). We compared the use of any code included in a case definition associated with a particular disease, as shown in Table 2; we also compared the use of a preferred code, which was the code most commonly found in the CPCSSN database for each condition. We calculated composite scores by summing codes for all conditions studied as the numerator and summing the number of case definitions for each condition as the denominator. For example, if a patient had both dementia and diabetes, this was counted as two.
Multi-variate logistic regression analysis was used to compare the two cohorts. We used generalized estimating equations to adjust for the clustering structure of the data in regression models. When comparing the two groups, we adjusted for patient and physician age and gender, number of comorbidities, number of encounters and average number of patients per provider using multi-variate logistic regression analysis.
The analyses were performed with SAS version 9.4 (Cary, North Carolina, USA). We used the SQUIRE guidelines for reporting health care quality improvement research.55
CPCSSN has received ethics approval from the Research Ethics Boards of each host universities for all participating networks and from the Health Canada Research Ethics Board. All participating CPCSSN sentinel primary care providers have provided written informed consent for the collection and analysis of their EMR data. The North York General Hospital’s Research Ethics Board reviewed and approved this project.
RESULTS
Fifty-nine out of the 67 physicians in NYFHT participated in this project. Eight physicians had not implemented EMRs, or did not use key aspects of the EMR such as medication prescribing; they did not participate in CPCSSN and were not included. 315 physicians at CPCSSN sites across Canada were included in the parallel cohort. Table 2 provides information on coding for chronic conditions at baseline.
An overview of study flow at NYFHT is shown in Figure 3. Between 83% and 90% of physicians verified and returned lists for each condition. Fifty-one percent of conditions queried were indicated as being positive by physicians returning data. 10,473 health conditions already had preferred codes and 2323 new codes were added, for an increase in standardized coding of 22%.
Table 3 provides information on coding proportions and changes for each condition in the six months of interest. Table 4 presents changes in composite scores for the use of any code and for the use of preferred codes. While overall coding increased in both cohorts, the increase at NYFHT was significantly greater. Coding was more common at baseline for diabetes or hypertension than for COPD or dementia in both cohorts. Conditions that were less frequently coded at baseline at NYFHT had larger increases in coding: the increase in preferred codes was 20.2% for COPD and 22.6% for dementia. This did not occur for the parallel cohort, as there was a decrease of 0.8% for COPD and a small increase of 1.3% for dementia.
DISCUSSION
Data management activities were implemented in the primary care organisation we studied. This implementation was associated with significantly greater increases in coding for chronic conditions studied compared to other Canadian practices.
There is limited evidence on which interventions are most effective in improving data quality.56,57 Repeated assessments, feedback and training may be effective.57 However, this represents a significant time investment for practitioners; the extra work could compete with the already extensive requirements associated with providing clinical care,16 which may limit acceptance. Using an automated EMR alert based on clinical criteria and prompting the clinician to add a condition to the problem list if it is missing has been found to be effective.58 However, programming this in commercial EMRs routinely used may be challenging. There are about 20 EMR applications used across Canada and each one would require individual programming and support for this process. Regulations could be used to mandate EMR-based data improvement activities.
During the pilot for this project, we found that a simple approach minimizing physician workload was not costly and was acceptable to the physicians involved.52 We used their expertise only to verify cases, with no additional training; this did not interfere with clinical encounters. Most of the work was delegated to other members of the primary care team or to data clerks as appropriate. Acceptance in this project was high, with 83%–90% of physicians returning their lists of patients.
The organisation we studied was interested in data quality and had already made efforts to implement some coding for chronic conditions prior to the project.52 Data clerks had entered the diagnostic code for diabetes in the previous year. This explains the high rate of baseline coding for that condition (81.7% in NYFHT) compared to other CPCSSN physicians (63.6%). Coding for diabetes increased less than for the other conditions possibly because of ceiling effects due to prior efforts; however, the increase was still greater than for the comparator group. No consistent efforts had been made for the other three conditions; baseline coding prevalence was similar to other physicians across Canada.
The lack of adoption of terminology standards and the prevalence of uncoded, ‘local’ or idiosyncratically coded data presents challenges in terms of electronic communication and interoperability.59,60 We used the most commonly entered codes in a national database for each condition studied as an initial step towards more consistent terminology. We demonstrated that coding conforming to an external norm could be implemented in a complex and distributed primary care organisation in Canada.
Maintaining data quality will require ongoing efforts. In order to improve sustainability, the data clerks documented the processes used for this project. A handbook is provided at http://drgreiver.com/NYFHTSummerStudentProgramHandbook.pdf. NYFHT has also developed a manual for standardized data entry, which is available to all members of the team and has been shared with other teams. Data quality activities using the same approach are ongoing at NYFHT and have been expanded to include additional conditions. Scalability should also be considered; small primary care teams may not have the resources to implement this approach. However, in Ontario, primary care analysts (QIDSS) have been embedded in FHTs. The DPT and associated processes have already been provided to additional analysts, each supporting multiple FHTs in Ontario, as well as to primary care networks in Alberta. To assist with governance and processes, we have provided templates and tools developed as part of this project for privacy, and data entry and analytics to the Association of Family Health Teams of Ontario.61 The Association has been tasked with assisting the provincial implementation of analytics in FHTs through the QIDSS program.47 Additional resources for support, continuing development and broader implementation of DPT in primary care are being actively pursued by CPCSSN.
Similar approaches could be used elsewhere. In the U.S., significant funding has been devoted to improving data in EMRs. For example, a problem list needs to be used for 80% or more of patients in order to meet meaningful use goals.62 Adaptations of these processes could be used to rapidly improve the completeness and coding of data in problem lists.
Limitations
This study was a convenience sample for both cohorts. However, physicians participating in CPCSSN were reasonably similar to others in Canada.63,64 An observational cohort study was used; this is subject to both measured and unmeasured confounders. We used statistical adjustments for factors we measured. We could not measure factors possibly affecting coding, such as dictation; however, we compared the change in coding over time rather than providing a cross-sectional comparison. Data reflects only patients seen for care over time; it is possible that more frequent visits could lead to improved recognition of a chronic condition and increases in associated coding. However, physicians at NYFHT had less frequent patient visits than the national cohort. The specificity of CPCSSN case definitions varied, with some false positive cases. It is also possible that clinicians may not recognize that a condition was present for some patients on their verification list.
In conclusion, data management activities were implemented by the primary care organisation; this was associated with an increase in standardized coding for four chronic conditions. A similar environment currently exists in other primary care organisations in Ontario. Planning for resources and activities that would allow the adoption of data management within primary care organisations in order to support data and quality improvement may be worthwhile.
Where this study fits in
EMR data quality in primary care including standardized coding for chronic conditions is currently limited.
We implemented data management activities in a large primary care organisation in Ontario, Canada. This included the return of merged, cleaned EMR data and reporting software to the organisation’s data manager.
The team used these resources to code and standardise designations for chronic conditions; coding improved to a greater degree than in comparable practices across Canada.
Improving data quality in primary care using this approach appears to be feasible.
Acknowledgments
This project was funded by Canada Health Infoway. The views expressed herein do not necessarily represent the views of Canada Health Infoway. Funding for this publication was provided by the Public Health Agency of Canada. The views expressed herein do not necessarily represent the views of the Public Health Agency of Canada. Dr. Greiver holds an investigator award from the Department of Family and Community Medicine, University of Toronto.
References
Footnotes
Competing interests The authors declare that they have no competing interests.
Authors’ contributions MG drafted the initial version of the article. MG, KM, DJ, BA, MM, JL and ALL contributed substantially to conception and design. BA and SK contributed substantially to the analysis of data. All authors contributed to the interpretation of data and drafting of the article. All authors revised the article critically for important intellectual content and gave final approval of the version to be published.