Article Text

Abstract
Background Research regarding return on investment for electronic health records (EHRs) is sparse.
Objective To extend previously established research and examine rigorously whether increasing the adoption of computer-based provider/prescriber order entry (CPOE) leads to a decrease in length of stay (LOS), and to demonstrate that the two are inversely and bidirectionally proportional even while other efforts to decrease LOS are in place.
Method The study assessed CPOE, LOS and case mix index (CMI) data in a community hospital in the United States, using a mature and nearly fully deployed vendor product EHR. CPOE rates and LOS over 7 years were determined on a per-patient, per-visit and per-discipline basis and compared with concomitant CMI data.
Results An inverse relationship of CPOE to LOS was correlated for 13 disciplines out of 19, and organisation wide for all disciplines combined during the first 5 years of study. During the subsequent 2 years, both CPOE and LOS plateaued, except in eight disciplines where CPOE rates at first declined and LOS concurrently rose slightly, and then returned to the baseline plateau levels. CMI increased during the entire period of evaluation. An inflection point at approximately 60% CPOE adoption predicted the greatest improvement in lowering of LOS.
Conclusions Rising and falling rates of CPOE correlated with reductions and rises in LOS, respectively. CPOE appeared statistically to be an independent factor in affecting LOS, over and above other efforts to shorten LOS, thus contributing to lower costs and improved efficiency outcomes as measured by LOS, even as CMI rises.
- case mix
- computerised physician order entry system
- diffusion of innovation
- hospital stay
- length of stay (LOS)
Commons license http://creativecommons.org/licenses/by/4.0/
Statistics from Altmetric.com
- case mix
- computerised physician order entry system
- diffusion of innovation
- hospital stay
- length of stay (LOS)
Introduction
Literature review
Concerns and changes in healthcare continue toward increased financial constraints, scarce resources and expanding regulatory requirements.1–6 Healthcare delivery organisations deal with substantial pressures to reduce costs and improve capacity efficiencies, often summarised through emphasis on length of stay (LOS), among other signs and indicators of improved delivery performance. The increased use of electronic patient records (EPRs) fueled in great part by governmental programs7 increased expectations that these expenditures should lead to productive means for achieving needed return on investment (ROI) as quantified by reduced costs with improved outcomes beyond what might have been achieved through traditional human- dependent improvements.
The question of our community-focused healthcare organisation became whether our EPR implementation, incorporating proven computerised provider order entry (CPOE), would favorably affect LOS.8–11 Shorter lengths of stay are beneficial for payers, who reimburse hospitals on a per diem basis; for patients, who get home faster; and for hospitals, whose costs are lower; but for physicians paid on a fee-for-service basis, achieving shorter LOS is a perverse incentive. Nevertheless, this study selected LOS as a critical metric and key performance indicator because LOS serves as the summary proxy for cost-related concerns combined with both clinical success and process efficiency.12–14
A review of the literature revealed seven studies that suggested that CPOE can contribute to improved shorter LOS. Only two of the studies were sufficiently recent to reflect the current economic and regulatory environment and to shed light on the relationship between CPOE and LOS, yet even those studies examined LOS only within an emergency department.15,16 The other studies reflected impact assessments of stand-alone and home-grown CPOE solutions.17–21 The hospitals involved in those studies were university level, where trainees performed the bulk of the order entry. Our hospital is a community hospital where the attending physicians, many of whom are not hospital employees, fulfil the order entry duties using a vendor product using largely standard configurations. No study matched these conditions, thus enhancing the authors’ interest in the hypothesis that CPOE and LOS are bidirectionally related.
Teufel, Kazley and Basco22 could not show any evidence for financial benefit or reduction in LOS for CPOE in pediatric hospitals prior to the ‘meaningful use’ era.23 Forrester et al.24 showed that CPOE ‘provides excellent value for the investment’, but reflected use within an ambulatory setting. In contrast, a handful of studies have shown favorable impacts of clinical decision support within CPOE for reducing medication errors and preventable adverse drug events.25 A systematic review and meta analysis26 showed reduced preventable adverse drug events and medication errors in hospital settings, and another confirmed favourable impacts of CPOE with reduced turnaround times combined with less need for pharmacy interventions in a community hospital.27 Yet none of these studies established the overall association between CPOE and any comprehensive metric of clinical complexity and cost such as LOS.
An additional concern was one recent study that failed to substantiate any reduction in LOS either within the ICU or for the hospital cumulatively linked to CPOE.28 However, in that study, CPOE was available only within the ICU, not house wide, in contradistinction to this study.
EPR impact assessment
Despite the lack of substantive research, the question of how CPOE might favorably impact LOS remained crucial as a large-scale proxy for a positive impact and a valid, readilyavailable and widely accepted measure of ROI. To determine the possibility of a CPOE-with-LOS relationship, Schreiber, Peters and Shaha29 had undertaken a rigorous study. Logically, the study focused on EPR adoption, knowing that only by maximizing adoption could there be maximum favourable impacts for clinicians, patients and the organisation. CPOE adoption served as the quantitative proxy for adoption in general, reflecting how widely and functionally clinicians used the EPR in routine activities. Adoption throughout the hospital, including in different care-related locations and different disciplines, was challenging but essential. Thus, the best marker of ROI for the EPR was LOS, as reflected by CPOE adoption as the metric of implementation success.
The prior study also included case mix index (CMI) in the hypotheses to determine whether changes in CMI might explain changes in LOS and thus less likely attributable to CPOE. CMI provides a standard measure for comparing cumulative patient severity of illness and resource intensity across hospitals.30 The earlier study29 established the level of CPOE adoption at which the impact on LOS begins to accelerate (the tipping point) once the relationship is established. With this as background, the current study explored the impact on LOS once CPOE adoption reached high levels and stabilised at a plateau. This study also inquired whether CMI continued to change and if that had any further influence on LOS and whether there were any effects on LOS if CPOE rates declined in any discipline.
The objective
To answer these questions, the current study furthered the previously designed29 quasi-experimental retrospective correlational method31 to explore possible changes in LOS with CPOE adoption rates throughout our organisation and within different disciplines, including CMI as an alternative hypothesis to explain any alterations in LOS. To our knowledge, there have been no other such subsequent studies.
Methods
The specific design of the methodology enabled quantification of the correlation of CPOE adoption with LOS while exploring a possible explanatory attribution to changes in severity (i.e. CMI).29 A retrospective and correlational interrupted time series study was executed, which included data for 5 ½ years, 22 consecutive quarters and 66 consecutive months from July 2007 through December 2012, previously published.29 The data reflected 76,972 discharges with 6,135,994 eligible orders. Eligible orders included all pharmacies (medication and intravenous) except in the emergency department, laboratory, cardiology and radiology imaging, nursing care, admission/discharge/transfer, consult, respiratory therapy, ancillary services (physical, occupational and speech) and dietary orders from all inpatient floors including the behavioural health unit.
The current study extended the data from our previous report,29 now encompassing two more years (2013–2014) and including all medications in the emergency department. These eight quarters totaled 25,795 discharges and 2,550,289 eligible orders.
Deidentified data were downloaded directly from the EPR for analysis. The original version installed in August 2007 was Eclipsys Sunrise Clinical Manager version 4.5 (Chicago) with CPOE activated in February 2008. By the end of the data collection in December 2014, the hospital was using Allscripts Sunrise Clinical Manager version 6.1. Regression testing ensured semantic congruity of all data elements during analysis. Data included details for each of 19 clinical disciplines for which sample sizes were statistically sufficient, summarised by quarterly average LOS and CPOE, and in aggregate house wide. For LOS, annualised moving averages were computed as a smoothing strategy due to customary variability, for both ease of visualization in graphics and simplicity of analysis and interpretation. Concurrent CPOE data utilization rates (i.e. adoption) were computed as quarterly figures calculated by attending of record and aggregated by discipline (specialty) and cumulatively house wide (no smoothing applied). Sample sizes for any quarter exceeded all a priori power analysis sample size requirements by greater than 3-fold.
Correlational and regression analyses focused on quantifying the degree of predictive relationship between CPOE and LOS. Pearson’s correlation coefficients were computed for all disciplines individually and collectively (house wide) using LOS as a continuous variable and CPOE adoption rate as a percentage, with arcsine, probit and Fourier transformations, as appropriate, for confirmatory purposes.32–34 The p-values remained unchanged significantly throughout transformations and confirmatory analyses. CMI data were derived from the resident business decision support software (Siemens OAS Financials) and obtained by department by quarter and matched to disciplines.
Regression analyses were pursued to further describe the CPOE–LOS relationship as well as the predictive strength as quantified by R-square coefficients. All statistics were evaluated for significance at a minimum of p<0.05. All analyses were conducted using SPSS for Windows (IBM SPSS version 21.0) and all graphics were created in Excel (Windows 2013, Microsoft). For statistical tests, the conservative sample size figures used for LOS were the number of discharges by discipline, and for CPOE, it was the number of quarters of data analysed.
Throughout the 7 years of this study, the hospital engaged in numerous efforts designed to reduce LOS. These efforts encompassed all disciplines concurrently. A retrospective review cannot control for other projects and initiatives affecting LOS during the study period. However, the per-patient, per-visit and per-attending methodology of this report, in the authors’ opinion, helps to control statistically and analytically for these other secular trends.
The hospital’s Institutional Review Board granted a waiver of informed consent based on the minimal risk of divulging personal health information due to the deidentification pursued and the quality improvement focus of the project.
Results
The predictive inverse relationship between CPOE and LOS
Analyses confirmed that CPOE adoption and LOS changed significantly over the first 66 months of data analysed and that they were significantly and inversely correlated (Figure 1). That shared relationship was sustained over time even as patient severity (i.e. CMI) held comparatively constant or was significantly increasing (p = 0.002). It would normally have been anticipated that the increase in CMI would bring an increase in LOS, so when the opposite was found, the impact of EPRdelivered CPOE was even more substantiated.

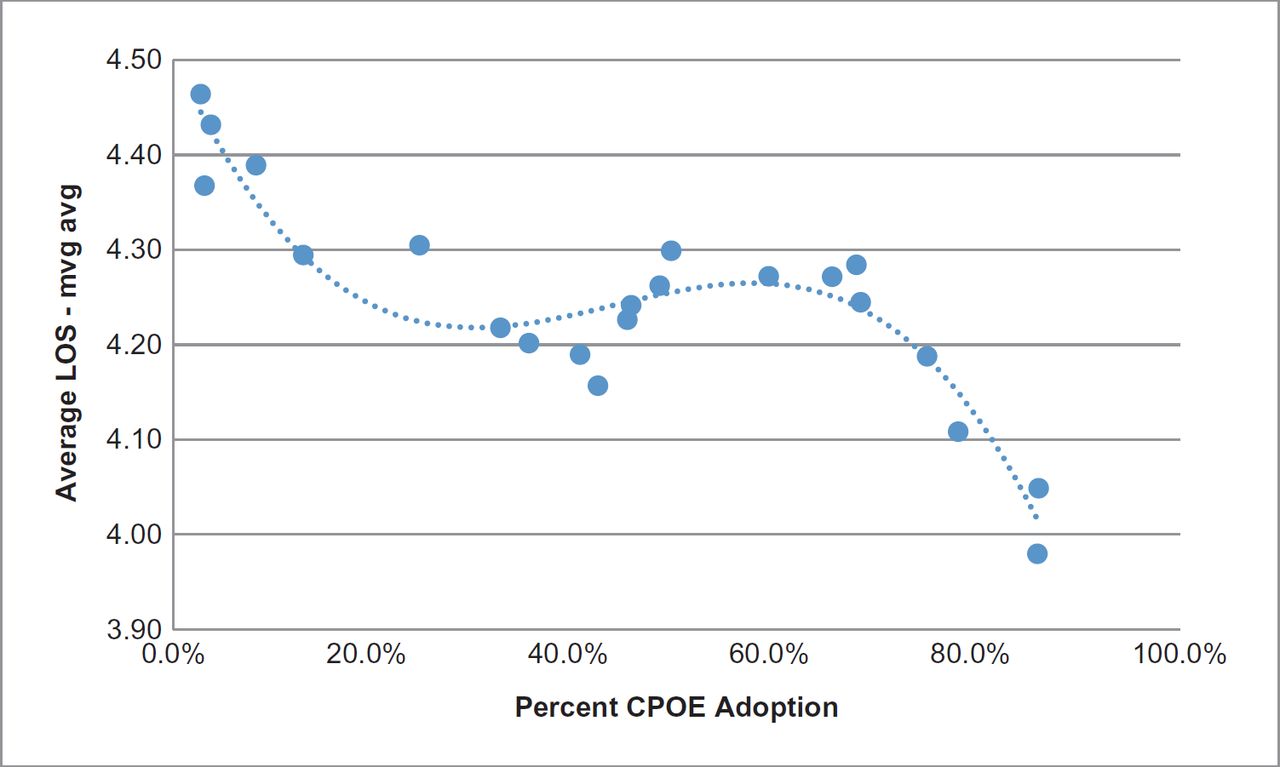
Further analyses based on the scatterplot of CPOE and LOS evaluated and illustrated the relationship. The analyses strengthened the conclusions of the favourable impact of EPR-delivered CPOE on LOS. Additional mathematical analysis35 revealed that the inflection point for the relationship or the level of CPOE adoption at which the greatest impact for reduced LOS occurred was about 60% for our implementation (Figure 2).
Longer-term CPOE–LOS relationship
Visual and statistical examination of the time series data (Figure 1) implied that this organisation had very likely reached a plateau in CPOE adoption nearing 90% that might persist.29 This raised the question: will LOS also plateau when CPOE does, and is that organisation wide or different for any given discipline or specialty? Eight quarters of additional data were analysed to quantify and ascertain the continued relationship between CPOE and LOS by discipline and house wide.
Analyses verified that the anticipated plateau had indeed been reached and sustained for the 2 years of additional study (eight quarters), for which the organisation-wide slope was not significantly different from zero (p =0.883).
Interestingly, however, that same effect was not generalisable throughout all of the individual disciplines. While none displayed any statistically significant (i.e. p<0.05) increase of LOS, eight of the disciplines did show short-term fluctuations in CPOE utilization with corresponding unfavorable fluctuations for LOS. The disciplines included: cardiology, critical care, general surgery, neurosurgery, oncology/hematology, thoracic surgery, urology and vascular surgery. Importantly, the correlation between LOS and CPOE remained statistically significant in each discipline (i.e. p<0.01) as the LOS increased and decreased in synchrony with the CPOE utilization rates, although again, none suffered a statistically significant lasting increase in LOS.
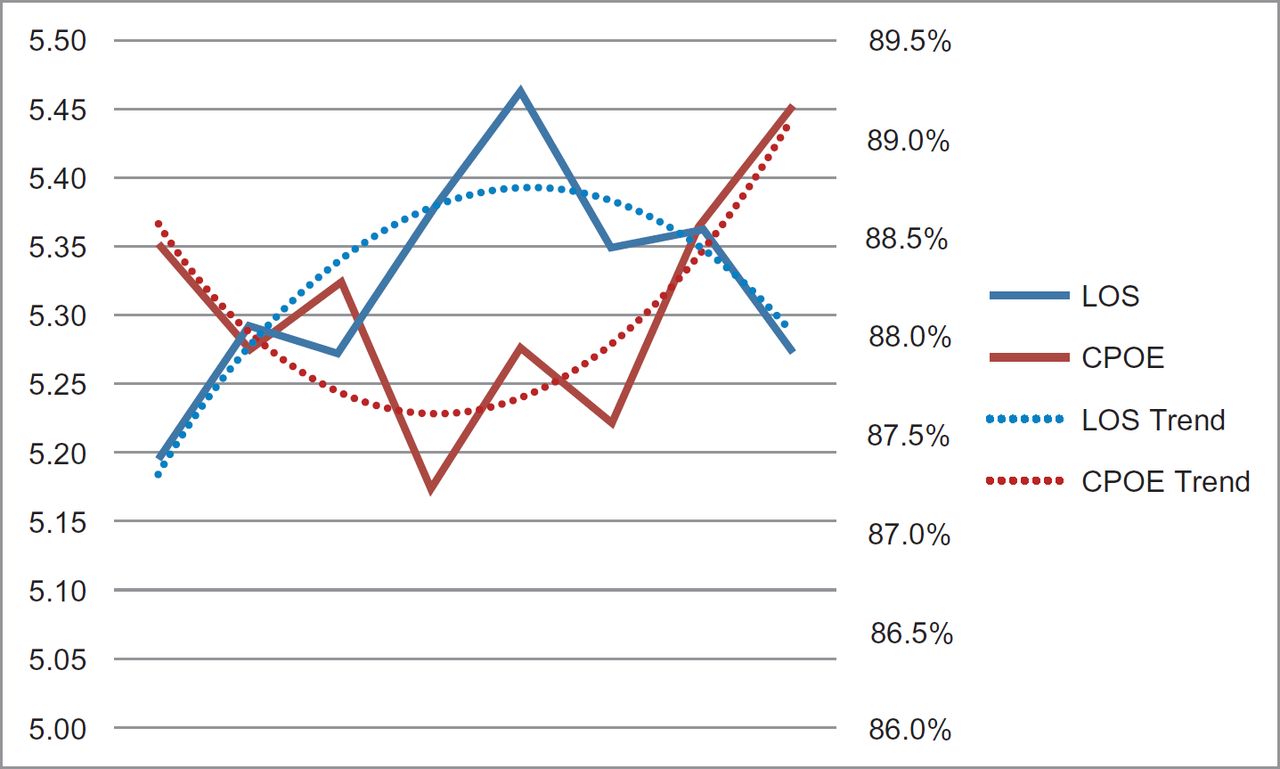
Figure 3 illustrates the cumulative pattern found among the eight disciplines when their data were combined for collective analysis, shown horizontally over time (eight quarters). Several important interpretations emerge. First, CPOE remained correlated with LOS and when CPOE rose, the LOS dropped and vice versa. Second, while CPOE initially suffered decreases for reasons unexplained and LOS therefore rose, that pattern reversed in aggregate in the most recent year of data. Each variable, both CPOE and LOS, exhibited a curvilinear (i.e. quadratic) trend precisely complementary to the other, with R-squares of 0.76 (76%) and 0.73 (73%), respectively (p<0.001 each). While CPOE decreased and LOS increased in 2013, the opposite was true in 2014. According to organisation-wide analyses, CPOE rates returned within 2 years and are currently at the level previously documented and published.29
The corresponding list of disciplines included those that did not show any decrease in their CPOE rates below the levels previously reached,29 nor did they display any significant increase in LOS. Additionally, as anticipated, the correlation between CPOE and LOS remained statistically significant for each (i.e. p<0.01). Those disciplines with no decrease in CPOE included primarily family medicine, hospitalists, internal medicine, nephrology, Ob/gyn, oncology/hematology, orthopedic surgery and otolaryngology.
Discussion
Despite a general shortage of rigorous research in the subject matter, our previous work established the predictive and correlated relationship between EPR-delivered CPOE adoption and LOS.29 The current research further validates the CPOE–LOS relationship and shows that variations, both decreases and increases, in CPOE are associated with inverse variations in LOS. These changes occur despite ever increasing rises in CMI. Together, the studies define the adverse and beneficial relationship between the use of EPR-enabled CPOE and the long-sought improvements in LOS. These data clearly show that cost-related, efficiency and clinical outcomes, as represented in proxy by the LOS, are enhanced through the use of CPOE in hospital-based patient care.
The current study complements and extends previous work29 using a unique methodology. All studies cited in the literature review15–22,24–28 used a before–after approach, which is largely an arithmetic evaluation of the process change. The method of examining each patient visit, tabulated by discipline of the attending physician compared with other visits at the same time, allows some degree of control over other concomitant processes that drive the measured outcome (LOS) as well as controlling for different adoption rates between disciplines and changes in CMI over time. Use of the methodology described in this report helps ameliorate the problem of baseline imbalance,36 allows comparisons over time and enables calculation of the tipping point. Before–after comparisons do not permit this level of detail and can only suggest conclusions when all disciplines have comparable CPOE rates that may not be accurate in a community hospital or outpatient setting.
It is interesting to speculate whether CPOE adoption rates are a measure of ROI relative to the meaningful use of the incentive programme in the United States. Stage 2 requires the use of CPOE for 60% of medication orders and 30% for laboratory and radiology orders.37 These figures are at or below the calculated tipping points for accelerated declines in LOS, whereas the proposed thresholds for stage 3 are 80% and 60%, respectively.38 Will other sites be able to show similar gains in LOS as shown here once they achieve CPOE rates stipulated in the stage 3 regulations?
Retrospective data cannot establish a cause and effect relationship between CPOE and LOS. The data do establish that CPOE and LOS are significantly and inversely correlated bidirectionally, meaning that increases in CPOE correlate with decreases in LOS and vice versa. Further, the combined analyses suggest strongly that increasing CPOE does indeed provide the catalyst for lowering LOS and is likely causal.
The data do leave some interesting questions unanswered. Eight disciplines experienced temporary decreases in CPOE utilization and corresponding increases in LOS. While that pattern reversed by the end of the 2-year period, the question remains as to how those CPOE-related changes might have been predicted or even averted. No effort is made here to define whether any discipline-related pattern exists among those who underwent the variation versus those disciplines that did not, so discipline-reflective cause and effect for the pattern is not proposed.
Our data included all discharges, both inpatients and observation patients, which are those patients expected to require less than 24 hours in hospital. In the United States, there has been a shift toward more observation stays (which are billed as outpatient visits).39 In general, observation patients are not as ill, but they can be just as resource intensive. It is not immediately obvious how this impacts CMI or whether the rates of CPOE are different for these, as opposed to inpatients, or how this affects LOS. Future work will examine this subgroup.
Conclusions
This extension of previous work confirms and amplifies that the CPOE–LOS relationship is bidirectionally as well as inversely correlated. This study does not establish a cause and effect relationship between CPOE and LOS. Taken as a whole, however, several factors caused our organisation to interpret these findings as ‘causal’. The unique methodology permits some degree of control for concurrent processes designed to reduce LOS and also for the baseline imbalance in CPOE rates among different disciplines. Further, as CPOE rates climbed above 90% and then plateaued, reductions in LOS also plateaued overall. In those disciplines where CPOE declined, LOS increased despite concurrency of other efforts to maintain shortened LOS and then reverted to the previously established plateau levels. Overall, the correlation between CPOE and LOS allows us to conclude that an increase in CPOE from none to greater than 90% explains approximately 20% of the decrease in LOS. Our leadership and clinicians chose to interpret these results as indicative of increased CPOE having a causal impact on decreased LOS and vice versa, both within disciplines and house wide.