Article Text

Abstract
Study objective The objective of this study was to evaluate the accuracy of a new elective surgery clinical decision support system, the ‘Patient Tacking List’ (PTL) tool (C2-Ai(c)) through receiver operating characteristic (ROC) analysis.
Methods We constructed ROC curves based on risk predictions produced by the tool and compared these with actual patient outcomes on a retrospective cohort of patients awaiting elective surgery.
Results A total of 11 837 patients were included across three National Health Service (NHS) hospitals in England. ROC analysis revealed an area under the curve of 0.95 (95% CI 0.92 to 0.98) for mortality and 0.8 (95% CI 0.78 to 0.82) for complications.
Discussion The PTL tool was successfully integrated into existing data infrastructures, allowing real-time clinical decision support and a low barrier to implementation. ROC analysis demonstrated a high level of accuracy to predict the risk of mortality and complications after elective surgery. As such, it may be a valuable adjunct in prioritising patients on surgical waiting lists.
Health systems, such as the NHS in England, must look at innovative methods to prioritise patients awaiting surgery in order to best use limited resources. Clinical decision support tools, such as the PTL tool, can improve prioritisation and thus positively impact clinical care and patient outcomes.
Conclusions The high level of accuracy for predicating mortality and complications after elective surgery using the PTL tool indicates the potential for clinical decision support tools to help tackle rising waiting lists and improve surgical planning.
- medical Informatics
- artificial intelligence
- general surgery
- data interpretation, statistical
Data availability statement
No data are available.
This is an open access article distributed in accordance with the Creative Commons Attribution Non Commercial (CC BY-NC 4.0) license, which permits others to distribute, remix, adapt, build upon this work non-commercially, and license their derivative works on different terms, provided the original work is properly cited, appropriate credit is given, any changes made indicated, and the use is non-commercial. See: http://creativecommons.org/licenses/by-nc/4.0/.
Statistics from Altmetric.com
Introduction
Elective waiting lists for surgery in England are currently stratified based on a prioritisation system produced by the Academy of Royal Colleges and endorsed by the National Health Service (NHS). The system relies on healthcare professionals, typically a surgeon, to manually assign a priority code (P-code) to each patient listed for elective surgery within their domain (P1 (highest) - P4 (lowest)). Following assignment of a P-code, the patient is expected to undergo surgery within a stipulated time frame, for example, the assigned code P3 means the patient must undergo surgery within 3 months. Stepping outside of these time frames means patients should be subjected to a harm review.1
The COVID-19 pandemic has widely disrupted the delivery of healthcare services, including elective surgery.2 3 As a result, the number of patients awaiting surgery has sharply risen, which is sometimes referred to as the ‘elective backlog’.4 The current method to prioritise patients is procedure-specific and simplified to allow rapid prioritisation. It is not designed to manage the priority within a group of P-coded patients. Yet, there will be those who deteriorate faster than others due to their pattern of comorbidities. There is a need to improve the accuracy of assessing patients listed for elective surgery and prioritise based on greater objectivity. As such, digital tools to improve this process have been proposed, such as the use of predictive algorithms and artificial intelligence. These could have a positive impact on identifying patients at greatest risk of harm from waiting for a procedure and thus improve clinical care and outcomes. With the electronic management of elective waiting lists, this potential may now be realised; however, active intelligent management with clinical decision support tools has not been reported outside of research settings.5 6
In the field of predicting the risk of mortality and complications in surgery, the Physiological and Operative Severity Score for the enUmeration of Mortality and morbidity (POSSUM) scoring system is one of the most established and widely accepted constructs.7 It has been iterated over time and been shown to be highly accurate at predicting adverse outcomes and death in a range of surgical procedures across specialities.8 The variables used to power POSSUM include routinely collected demographic and clinical parameters, which can be found in online supplemental file 1.
Supplemental material
The Patient Tacking List (PTL) tool (C2-Ai(c)) is a clinical decision support tool based on the POSSUM Score that can help prioritise patients on an elective waiting list. The tool combines POSSUM, the planned surgical procedure details and time on the waiting list, and applies these to a referential dataset to produce a ‘matrix score’. The matrix score represents the difference in mortality and complication rate between the procedure being done electively versus waiting for the patient to decompensate and present as an emergency. Matrix scores range between 4 and 100, with a higher score corresponding to a greater risk of a poor outcome if the procedure is not done electively. Users of the tool can visualise their waiting list on a bespoke user-interface, which orders patients based on matrix scores, with options to filter based on demographics, clinical specialty and procedure type. These visualisations give a risk-stratified overview of patients awaiting surgery allowing better informed surgical planning.
The PTL tool has the potential to improve the accuracy of elective surgical risk-stratification and support clinical prioritisation. Furthermore, by including objective measures of risk, it may reduce variation, and thus improve equity in patient care. However, no objective measure of the accuracy of the tool to predict mortality and complications has previously been undertaken.
This report describes the implementation of the PTL tool as a pilot solution at three NHS trusts. The tool was used to analyse patients listed for elective surgery and produce matrix scores alongside current standard practice.
Aims
The aim of this study is to evaluate the accuracy of the PTL tool through receiver operating characteristic (ROC) analysis for mortality and complications in a retrospective cohort.
Methods
The tool was deployed in March 2021 and this study used data for the subsequent 12 months across three NHS Foundation Trusts including St Helens and Knowsley, Warrington and Halton and Royal Liverpool and Aintree Hospitals. The tool has subsequently been integrated within the regional clinical data warehouse (Combined Intelligence for Population Health Action) with the intention to process data and produce matrix scores for all patients listed for elective surgery. Data on patient comorbidities were accessed using a download of 2 years complete Secondary Use Service data (NHS digital) in all specialties.
We constructed ROC curves for mortality and complications based on PTL risk predictions and compared these with actual patient outcomes to assess the accuracy of the tool. ROC curves are a graphical approach to evaluate the connection/trade-off between clinical sensitivity and specificity for every possible cut-off for a test or a combination of tests. The area under the ROC curve describes the potential benefit of using the test(s) in question.
Results
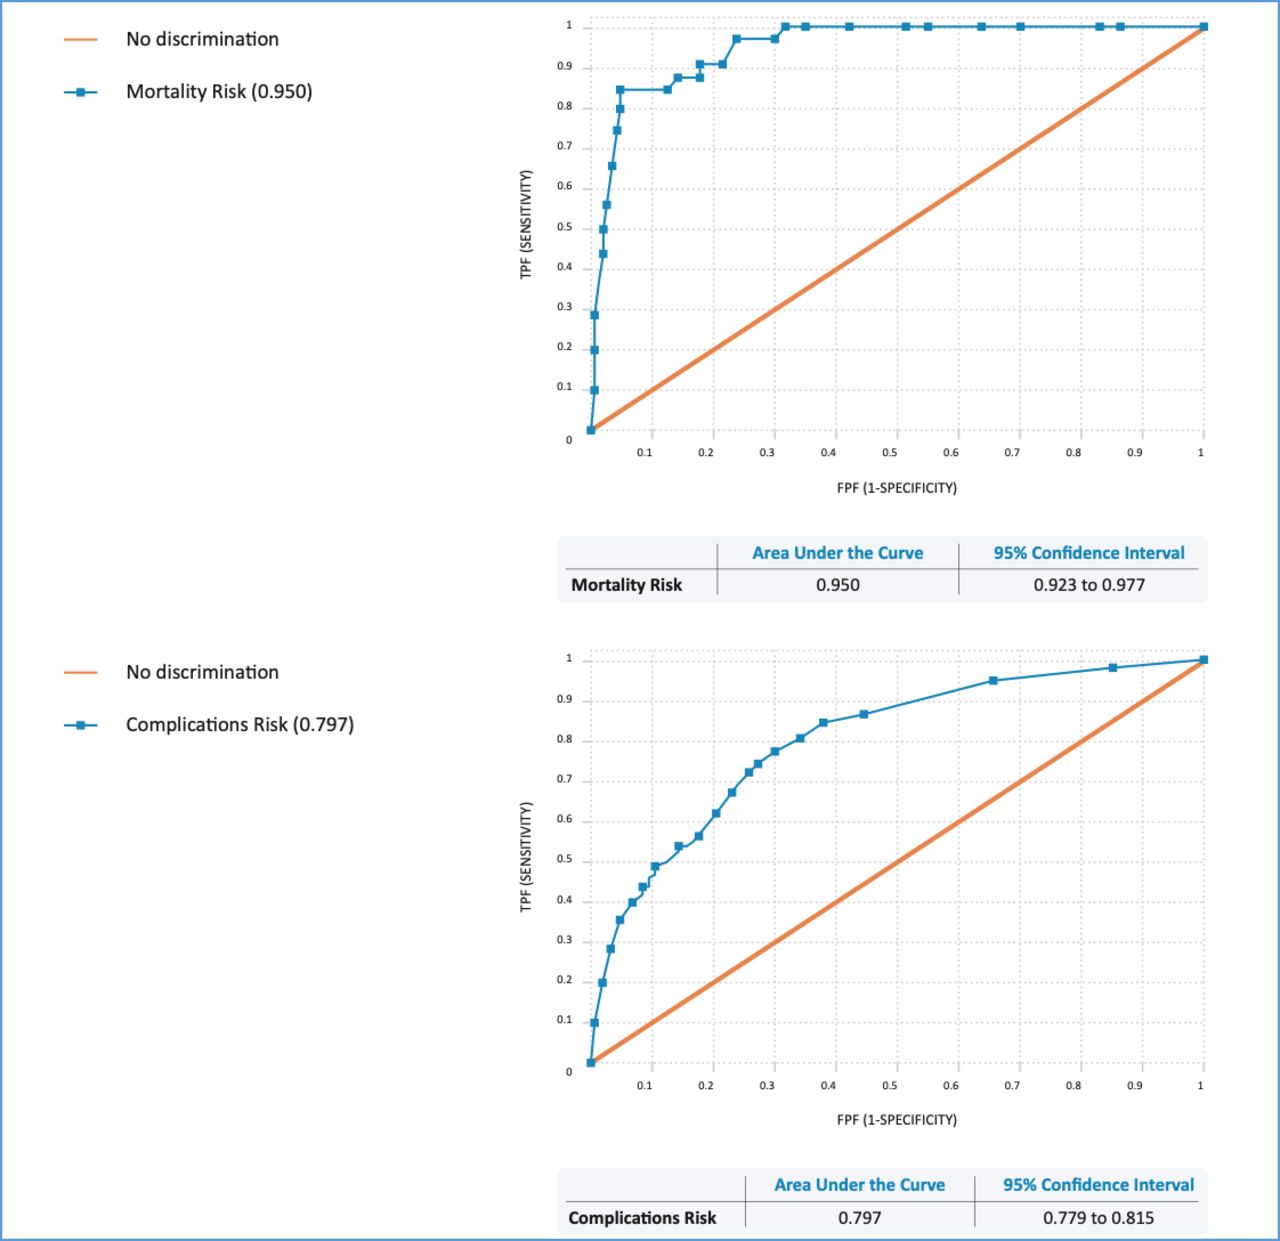
A total of 11 837 patients were included in the retrospective analysis. The outcomes for patients undergoing surgery between March 2021 and March 2022 using the predictions from the PTL tool showed an area under the ROC curve of 0.95 (95% CI 0.92 to 0.98) for mortality and 0.8 (95% CI 0.78 to 0.82) for overall complications (figure 1). Anecdotally, a 15 min saving of surgeon time was reported per patient each time the waiting list was reprioritised (P-coded).
Receiver operating characteristic curves for mortality and overall complications. FPF, false positive fraction; TPF, true positive fraction.
Discussion
Principle findings
This study found that the PTL tool accurately predicted the risk of mortality and complications for patients listed for elective surgery. Matrix scores correlated well to potential adverse outcomes and may therefore be used to prioritise patients on surgical waiting lists.
Implications for clinical practice
Planning elective surgical waiting lists and prioritising patients to optimise the utilisation of resources is a complex undertaking. Several tools to support this have been reported in the literature. A recent systematic review by Dery et al9 identified 34 different tools. Most included studies reported on the development or clinical validation of the tool—rather than the implementation into clinical practice. The authors of this review concluded that implementation into clinical practice remains a challenge.9 Our implementer report describes the real-world application of a prioritisation tool in the NHS. It has demonstrated the ability to identify patients at greater risk of adverse outcomes and therefore expedite their waiting time for surgery. The limited integration required lowered the barrier to implementation and demonstrated the potential scalability of this tool.
Previous studies have shown that by risk stratifying patients, there is an opportunity to personalise management, optimise prehabilitation and improve postoperative outcomes, such as a reduction in pulmonary complications.10 Patients with higher matrix scores identified through the PTL tool may thus be selected for prehabilitation, with a view of reducing their risk while they wait for surgery. Future studies may explore the impact on postoperative outcomes of patients with higher matrix who underwent prehabilitation to provide a measure of the impact of the tool.
Given the increasing complexity in healthcare and larger number of patients on waiting lists, the tool has the potential to lighten the administrative burden and reduce costs related to service planning and delivery. To achieve maximum impact from such implementations, the importance of utility must be shared with all stakeholders including healthcare professionals, administrative staff and patients. This will result in the wider cultural change associated with digital transformation. Further work to evaluate the usability of the tool is thus warranted, to better understand users’ experience, integration into administrative workflows and identify areas for improvement.
Conclusion
Clinical decision support systems, such as the PTL tool, can improve the prioritisation of patients requiring elective surgery. This can improve overall mortality and complications related to surgical conditions and positively impact elective backlog by accurately allocating healthcare resources.
Data availability statement
No data are available.
Ethics statements
Patient consent for publication
Supplementary materials
Supplementary Data
This web only file has been produced by the BMJ Publishing Group from an electronic file supplied by the author(s) and has not been edited for content.
Footnotes
Twitter @VidehaSharma
Contributors VS and RP-J conceptualised the study. VS undertook statistical analysis and wrote the first draft of the manuscript. RP-J, SS and JA reviewed and edited the manuscript.
Funding The authors have not declared a specific grant for this research from any funding agency in the public, commercial or not-for-profit sectors.
Competing interests RP-J has previously been supported by C2Ai to attend an innovation conference and a digital health awards event for work related to the tool in this report. All other authors declare that they have no conflicts of interest.
Provenance and peer review Not commissioned; externally peer reviewed.
Supplemental material This content has been supplied by the author(s). It has not been vetted by BMJ Publishing Group Limited (BMJ) and may not have been peer-reviewed. Any opinions or recommendations discussed are solely those of the author(s) and are not endorsed by BMJ. BMJ disclaims all liability and responsibility arising from any reliance placed on the content. Where the content includes any translated material, BMJ does not warrant the accuracy and reliability of the translations (including but not limited to local regulations, clinical guidelines, terminology, drug names and drug dosages), and is not responsible for any error and/or omissions arising from translation and adaptation or otherwise.