Article Text

Abstract
Objectives 4.2 million people die every year from many diseases due to air pollution. The WHO confirms that 92% of the world’s population lives in areas where the air quality limit is exceeded. In 251 days of 2011, the concentration of fine particulate matter in Ulaanbaatar exceeded the permissible level by 62%–76%. According to the results of the research, the content of fine particles decreased by 37%–46% in 2019. Because it is harmful to the health of children, we aimed to show the effect of air pollution on the mortality through data mining.
Methods In many countries, research is being conducted to generate effective knowledge from big data using data mining methods. So, we are working to introduce this method to the health sector of Mongolia. In this study, we used the decision tree algorithms.
Results We collected data on air pollution and under five mortality for 2019–2022 in Ulaanbaatar and created the database, built the models using the algorithms, and compared the results with the Mongolian standard. If the average of PM10 in winter is higher than the concentration specified in the standard, the mortality rate is likely to be high. Mortality is likely to be high if the nitrogen dioxide tolerance is high in the spring.
Conclusion The accuracy of the models calculated by the C5.0 algorithm is higher than the determined by the CART algorithm, the sensitivity and specificity values are higher than 0.50, so the mortality rates are uniformly predicted and low mortality prevails.
- Data Mining
- BMJ Health Informatics
- Data Science
- Artificial intelligence
Data availability statement
All data relevant to the study are included in the article or uploaded as online supplemental information.
This is an open access article distributed in accordance with the Creative Commons Attribution Non Commercial (CC BY-NC 4.0) license, which permits others to distribute, remix, adapt, build upon this work non-commercially, and license their derivative works on different terms, provided the original work is properly cited, appropriate credit is given, any changes made indicated, and the use is non-commercial. See: http://creativecommons.org/licenses/by-nc/4.0/.
Statistics from Altmetric.com
WHAT IS ALREADY KNOWN ON THIS TOPIC
This survey data is under five year data between 2019 and 2022, but it is less data if you consider each month. Therefore, compared with international research modelling, the results are consistent with decision tree algorithms being suitable for small data. In this study, we learned that decision tree algorithms are more suitable for datasets with less data and fewer attributes.
WHAT THIS STUDY ADDS
In this study, Ulaanbaatar, the capital city of Mongolia, had a low mortality rate for children under the age of five, is consistent with the results of other studies conducted in Mongolia. Although there are studies on the effect of air pollution on the mortality of children under five years of age, it is rarely studied using machine learning, including decision tree algorithms. For Mongolia, the impact of air pollution on under the five mortality is studied for the first time using a decision tree algorithm, which is a new achievement.
HOW THIS STUDY MIGHT AFFECT RESEARCH, PRACTICE OR POLICY
This research work will help future researchers to model machine learning on categorical data. It is believed that it will be helpful for health experts in the preparation and forecasting of child mortality reports. According to the results of the research, children’s mortality is high in winter and spring when PM10 and NO2 levels are high, so it is important for parents to protect and prevent their children from this risk.
Introduction
For Mongolia, in recent years, especially in Ulaanbaatar, air pollution has become one of the worrying problems. Our country has a harsh climate and the consumption of unprocessed coal is high in winter.1
The health of the population is influenced by many factors such as individual life habits, food, nutrition and the environment, and many studies have proven that air pollution is one of them. Globally, 4.3 million people die each year from heart disease, stroke, chronic obstructive pulmonary disease, cancer and acute respiratory infections in children due to air pollution.2
Changes in the human organ system are influenced by various substances in the atmosphere, either alone or together. Among them, PM2.5 and PM10 particles have a negative effect on all systems. The concentration of PM2.5 particles exceeds the acceptable level, causing diseases of the respiratory system, tumours, cardiovascular system and reproductive system, and death of young children.3 As of the first 9 months of 2022, 731 cases of deaths of children under the age of five were registered nationwide, which is 15.2 per 1000 live births, which is a decrease of 7 cases compared with the same period of the previous year. A total of 428 cases or 58.5% of children who died under the age of five were male and 303 cases or 41.5% were female children. 24.9% of all cases died outside the hospital, 75.1% died in the hospital and 31.0% died within days.1
In this regard, in February 2016, the 19th resolution of the Mongolian Parliament approved the ‘Sustainable Development Vision of Mongolia 2030’ and determined its implementation in the main direction of economic and social development. The goal of sustainable social development is aimed at creating conditions for citizens to live in a healthy and safe environment. It is stipulated to support the quality and availability of reproductive care and services in the quality and accessible health system in this area, and to reduce the factors affecting maternal and child mortality.4 5
In Mongolia’s ‘Vision 2050’ long-term development policy, it has been proposed that priority areas such as nano, bio, information technology, big data and artificial intelligence are to bring the development of the intellectual industry to world standards. Also pointed out that introduces evidence-based modern diagnostic treatment techniques, reducing the factors affecting child mortality.6
This research work will test data surveillance, artificial intelligence and machine learning algorithms on medical and health data and determine the optimal method for the development of the intellectual industry to a world standard.
It will be an important research work to reduce the factors affecting maternal and child mortality in the development policy of ‘Mongolia’s Sustainable Development Vision 2030’.
Therefore, we collected the data of Child Mortality 1–5 years during the last five years in Ulaanbaatar, and built the database, and detected the knowledge using the data mining classification method.
Method and materials
Classification algorithms
Classification is a form of data analysis that extracts models describing important data classes. Such models, called classifiers, predict categorical class labels. Data classification is a two-step process, consisting of a learning step and a classification step.
In the first step, a classifier is built describing a predetermined set of data classes or concepts. This is the learning step, where a classification algorithm builds the classifier that analyses from a training set made up of database tuples and their associated class labels. A tuple, X, is represented by an n-dimensional attribute vector, depicting n measurements made on the tuple from n database attributes, respectively, A1, A2, …, An. Each tuple, X, is concerned to belong to a predefined class as determined by another database attribute called the class label attribute.
In the second step, the model is used for classification. First, the predictive accuracy of the classifier is estimated. If we were to use the training set to measure the classifier’s accuracy, this estimate would likely be optimistic, because the classifier tends to overfit the data. Therefore, a test set is used, made up of test tuples and their associated class labels. They are independent of the training tuples, meaning that they were not used to construct the classifier. The accuracy of a classifier on a given test set is the percentage of test set tuples that are correctly classified by the classifier. The associated class label of each test tuple is compared with the learned classifier’s class prediction for that tuple.7
In this study, we have studied decision tree induction.
Decision tree
Decision tree induction is the learning of decision trees from class labelled training tuples. A decision tree is a flow chart-like tree structure, where each internal node denotes a test on an attribute, each branch represents an outcome of the test, and each leaf node (or terminal node) holds a class label.
During the late 1970s and early 1980s, J. Ross Quinlan, a researcher in machine learning, developed a decision tree algorithm known as ID3. Quinlan later presented C5.0, C4.5 of a successor of ID3, which became a benchmark to which newer supervised learning algorithms are often compared.7
C5.0
The C5.0 algorithm is an extension of the C4.5 algorithm and the model work by splitting the sample based on the field with the maximum information gain.8 Each subsample defined by the first split is then split again, based on a different field, and the process repeats until the subsamples cannot be split any further. Then the lowest level splits are reexamined and models are pruned that do not contribute significantly to the value.8 9
C5.0 uses the concept of entropy for measuring purity and it expresses homogeneous change of class attribute in the dataset. The minimum value 0 indicates completely homogenous, 1 indicates the maximum impurity for the sample.10 11 The definition of entropy can be specified as
 (1)
(1)
In equation 1, for a given segment S of dataset, the c refers to the number of different class levels, and  refers to the proportion of values in the class level i. In this study, we have a dataset with two classes, 55% is for the low state and 45% is in the high state of mortality. When the entropy was calculated, it was 0.99.

After calculating the entropy that depends on the class attribute, the algorithm must decide which feature to split on and for that calculate entropy that expresses the change in homogeneity resulting from a split on each possible feature and this calculation is named as information gain. The information gain of the feature F is calculated as the difference between the entropies the segment  before the split and the segments
  resulting from the split.10 11 That is,
 (2)
(2)
After that split, the dataset is divided into more than one partition. Therefore, the function to  needs to consider the total entropy in all the partitions. The entropy generated from each partition is weighted by the proportion of records in that partition, which can be expressed by the following formula
 (3)
(3)
A feature with the higher the information gain is at creating homogenous groups after a split on that feature.
CART
For Classification and Regression Tree, the Gini index is used and is concerned measure the impurity of D, a data partition or set of training tuples, as
 (4)
(4)
Where  is the probability that a tuple in D belongs to class
  and is estimated by
  . The sum is computed over m classes.7 12
The Gini index considers a binary split for each attribute. A feature is a discrete-valued attribute having v distinct values,  , occurring in D. To determine the best binary split on A, examine first all the possible subsets that can be formed using known values of A.7
When a binary split is made, will be computed a weighted sum of the impurity of each resulting partition. If a binary split on A split D into D1 and D2, the index of D given that partitioning I
 (5)
(5)
If tuple has a discrete-valued attribute, the subset that gives the minimum Gini index for that attribute is selected as its splitting subset.7
For continuous-valued attributes, each possible split-point must be considered. The strategy is similar to the information gain, where the midpoint between each pair of adjacent values is taken as a possible split-point. The point with the minimum Gini index for the continuous-valued attribute is taken as the split-point of that attribute. For a possible split-point of A,  is the set of tuples in D satisfying
  , and
, and  is the set of tuples in D satisfying
  . The reduction in impurity that would be incurred by a binary split on a discrete-valued or continuous-valued attribute A is
 (6)
(6)
The attribute that maximises the reduction in impurity or has the minimum Gini index is selected as the splitting attribute.7
Experiment
Database
Data of Under Five Mortality and air pollution such as NO, sulfur gas, PM10, PM2.5 for each month of 2016–2022 in Ulaanbaatar of Mongolia were obtained from the http://www.1212.mn site of statistical information unified database.
We have created a database with 11 attributes representing air pollution and temperature, Y class attribute defining high and low rates of mortality (table 1).
Dataset variable
The database is divided into four seasons: winter, spring, autumn and summer. Each season’s databases were divided into training and testing set in a 50:50 ratio. In table 2, it is presenting the main, training and test datasets that show distribution of class attribute. From the results, the class attributes are uniformly spreading in these datasets.
Class attribute distribution
Model building
Using the entropy and Gini index-based functions in R programming,13–15 models were calculated that show how air pollution affects this mortality. Table 3 is showing accuracy, sensitivity, specificity of the mortality models in seasons for C50 and CART. The accuracy of the model is 70% in winter, 60% in spring. Also, for the C50 method, the sensitivity is 67% and the specificity is 75% in winter, and the sensitivity is 50% and the specificity is 67% in spring, indicating that class attributes are predicted uniformly. But the CART method is showing very less effectiveness. So, for C50, we are introducing the final results in the next chapter.
Dataset variable
Results
For each quarter, the results of the models with more than 60% predictions are illustrated and the high rate of the mortality are explained to compare with Mongolian standards MNS 4585:2016.16 Table 4 shows the tolerance content of air pollution in this standard.
Annual average in Mongolian standards MNS 4585:2016
Winter
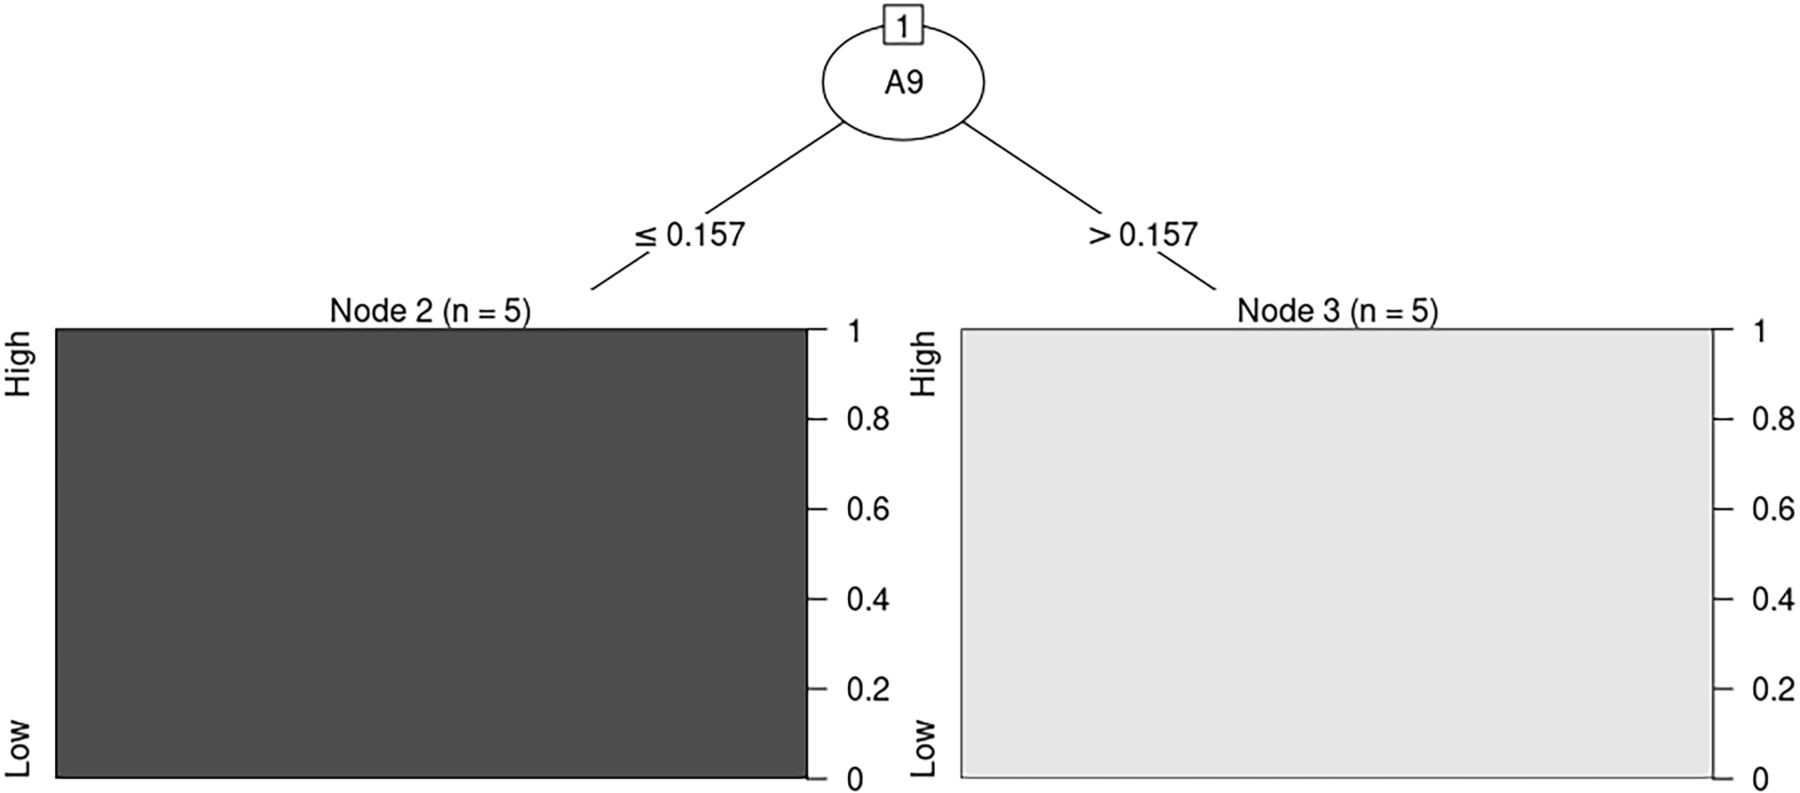
When the model with 2 leaves was created, 5 out of 10 cases presented the low rate of the child mortality (figure 1).15 17 The black colour in this image is low and the white grey colour is the high of the mortality. The high mortality rate occurred when the average of PM10 is 3.14 times higher than annual allowable concentration specified in MNS 4585:2016.

Winter model.
Spring
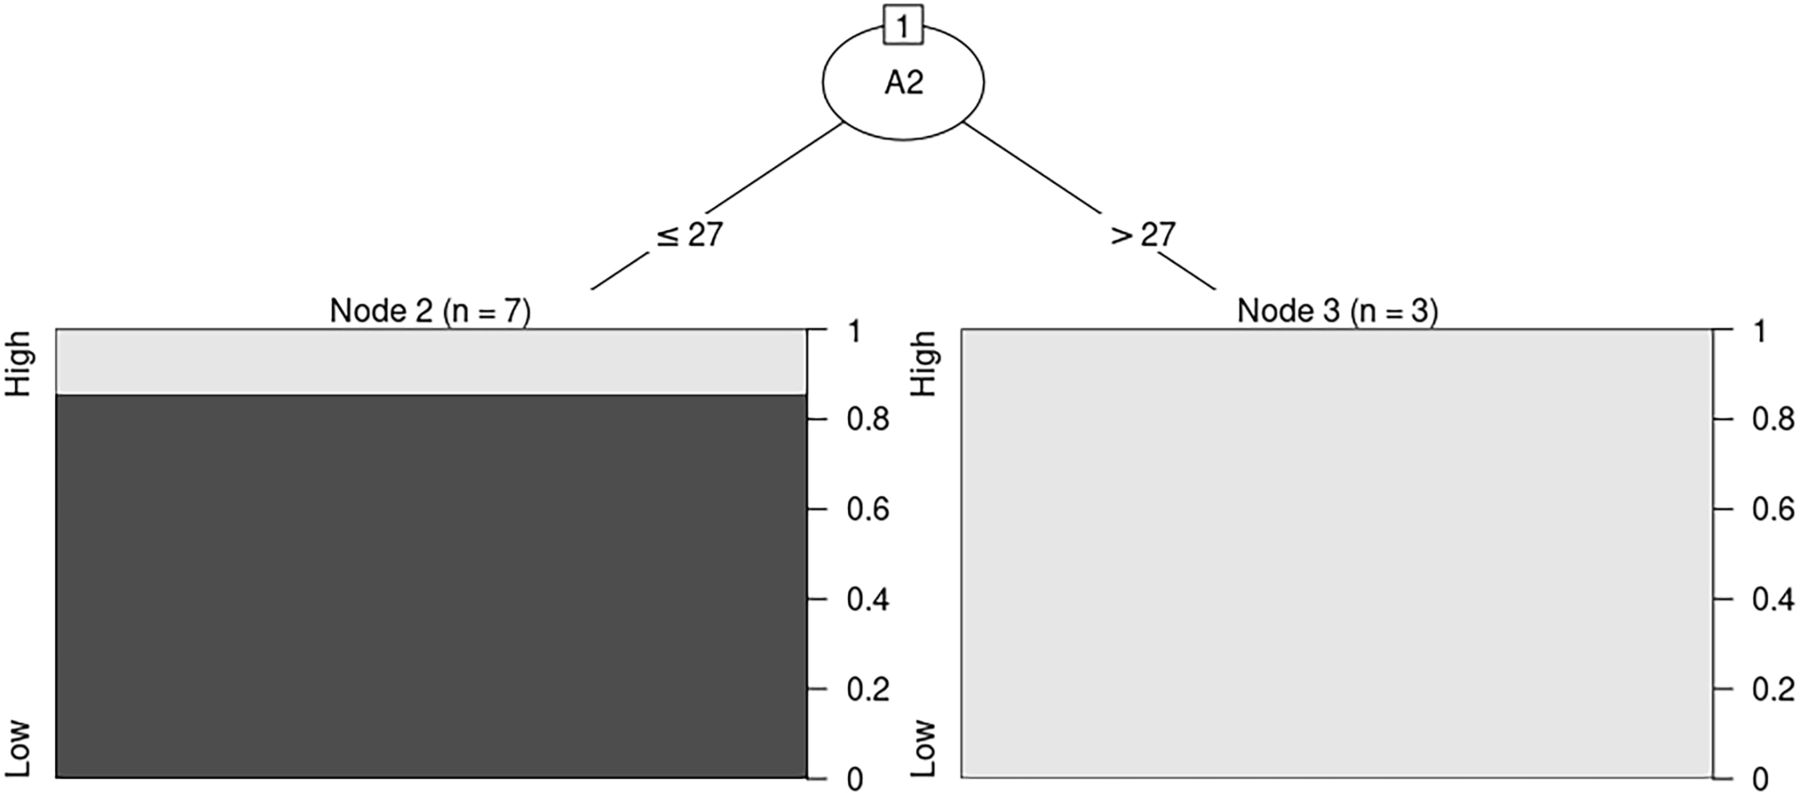
In figure 2, In creating the two-leaf model for the spring, the one indicated a lower rate of the child mortality and seven out of 10 cases reported the low mortality rate.
Spring model.
When the percentage exceeding nitrogen dioxide (NO2) tolerance is more than 27%, the mortality rate is likely to be high.
Discussion
Priyam et al considered that when ID3, C4.5 and CART decision tree algorithms applied on the educational data for predicting the student’s performance in examination, C4.5 is the best algorithm for these small datasets, because it provides better accuracy and efficiency than the other algorithms. The main disadvantages of these algorithms are low accuracy when the training data is large. But all these are used only for small datasets and require that all or a portion of the entire dataset remain permanently in memory. This limits their suitability for mining over large databases. C50 and CART algorithms are widely used compared with other decision tree algorithms.18
Charbuty and Abdulazeez had summarised that decision tree classifiers such as C4.5, CART, CHAID and QUEST are known for their enhanced view of performance outcomes and their strong precision, optimised splitting parameters and enhanced tree pruning techniques are commonly used by all recognised data classifiers.19
Balamurugan and Kannan analysed the performance of CART and C5.0 algorithms using sampling techniques such as simple random, systematic and stratified based on two datasets Pima Indians diabetes (Unbalanced dataset) and Iris (Balanced dataset).
Decision tree models are built using 80% of the original dataset as training dataset, which are selected using the above three sampling techniques. Then these models are tested using the remaining 20% of the dataset as test dataset. Each algorithm with each sampling technique is experimented ten times and the accuracies of these 10 trials are averaged. From the analysis, a stratified sample is suitable for both unbalanced dataset and balanced dataset.20
In this research paper, we studied C50 and CART algorithms of decision trees using monthly data on air pollution and under-five mortality between 2018 and 2022 in Ulaanbaatar and determined the optimal method. Compared with the above research work, it is consistent that the C50 method works well for small data.
Because these datasets are small, C50 will run well. If the data size is increased, the CART method may work well. The C50 method is more suitable for this particular data set, as it will take several years to build this survey data. In the future, we will explore large amounts of medical data using decision tree algorithms, and compare other classification methods of data mining. It will also improve accuracy by testing sampling methods before building the model.
Air pollutants are expected to have little effect on child mortality. In winter, the high mortality rate is likely to be higher when the average of PM10 is 3.13 times higher than annual allowable concentration specified in MNS 4585:2016. When the percentage exceeding NO2 tolerance is more than 28.33%, the mortality rate is likely to be high for spring
From the results, when the capacity of air pollutants exceeds the average annual allowable concentration, the mortality will occur.
Conclusion
Because the accuracy of the models established by C5.0 is between 60% and 70% and the sensitivity and the specificity values are ranged from 0.50 to 0.75, indicating that this predicts equally high and low rate of the mortality, it is possible to predict the future. However, in order to improve the accuracy, it is necessary to increase the data and test and compare other classification methods.
Air pollutants are expected to have little effect on child mortality. To describe in detail the high mortality rate:
In winter, the high mortality rate is likely to be higher when the average of PM10 is 3.13 times higher than annual allowable concentration specified in MNS 4585:2016. When the percentage exceeding NO2 tolerance is more than 28.33%, the mortality rate is likely to be high for spring.
Data availability statement
All data relevant to the study are included in the article or uploaded as online supplemental information.
Ethics statements
Patient consent for publication
Acknowledgments
We thank professor Ajnai and Bat-Enkh for the valuable advice on this research.
Footnotes
Funding The authors have not declared a specific grant for this research from any funding agency in the public, commercial or not-for-profit sectors.
Competing interests None declared.
Provenance and peer review Not commissioned; externally peer reviewed.