Article Text

Abstract
Objective Clinical notes contain information that has not been documented elsewhere, including responses to treatment and clinical findings, which are crucial for predicting key outcomes in patients in acute care. In this study, we propose the automatic annotation of phenotypes from clinical notes as a method to capture essential information to predict outcomes in the intensive care unit (ICU). This information is complementary to typically used vital signs and laboratory test results.
Methods In this study, we developed a novel phenotype annotation model to extract the phenotypical features of patients, which were then used as input features of predictive models to predict ICU patient outcomes. We demonstrated and validated this approach by conducting experiments on three ICU prediction tasks, including in-hospital mortality, physiological decompensation and length of stay (LOS) for over 24 000 patients using the Medical Information Mart for Intensive Care (MIMIC-III) dataset.
Results The predictive models incorporating phenotypical information achieved 0.845 (area under the curve–receiver operating characteristic (AUC-ROC)) for in-hospital mortality, 0.839 (AUC-ROC) for physiological decompensation and 0.430 (kappa) for LOS, all of which consistently outperformed the baseline models using only vital signs and laboratory test results. Moreover, we conducted a thorough interpretability study showing that phenotypes provide valuable insights at both the patient and cohort levels.
Conclusion The proposed approach demonstrates that phenotypical information complements traditionally used vital signs and laboratory test results and significantly improves the accuracy of outcome prediction in the ICU.
- Artificial intelligence
- Deep Learning
- Electronic Health Records
- Machine Learning
- Medical Informatics Applications
This is an open access article distributed in accordance with the Creative Commons Attribution Non Commercial (CC BY-NC 4.0) license, which permits others to distribute, remix, adapt, build upon this work non-commercially, and license their derivative works on different terms, provided the original work is properly cited, appropriate credit is given, any changes made indicated, and the use is non-commercial. See: http://creativecommons.org/licenses/by-nc/4.0/.
Statistics from Altmetric.com
- Artificial intelligence
- Deep Learning
- Electronic Health Records
- Machine Learning
- Medical Informatics Applications
What is already known on this topic
Previous studies have demonstrated exemplary performance for predicting outcomes in the intensive care unit (ICU) using bedside measurements and laboratory test results.
Contextual embeddings from recent transformer-based natural language processing models have enabled more accurate detection of medical concepts.
What this study adds
This study introduces a new methodology that incorporates contextualised phenotypical features from clinical texts and their persistence in modelling ICU time-series prediction tasks. The persistence of phenotypes in this study refers to the frequency with which each phenotype appeared in each patient record.
We conducted an interpretability study to illustrate why and how phenotypical features are highly relevant to ICU outcome prediction.
How this study might affect research, practice or policy
Researchers should explore how other clinical cases can benefit from the use of phenotypical information.
Given the richness of the information found in the clinical text, all parties involved should work together to enable secure and ethical use.
Introduction
Unprecedented amounts of healthcare data have been accumulated. The National Health Service (NHS) datasets record billions of patient interactions annually.1 In an intensive care unit (ICU), a wealth of data is generated for each patient owing to the necessity of closely monitoring of patients,2 with new vital information recorded every minute.
Conventionally, electronic health records (EHRs) contain two data types. These are structured (blood tests and temperature) and unstructured data (radiology reports and discharge summaries), with the latter comprising the most extensive part of patient data (up to 80%3). Both types of data are valuable for ICU monitoring. The majority of recent research4–6 relies heavily on analysable structured data—typically laboratory test results and vital signs.
Among the clinical features found in unstructured data, phenotypes [In the medical text, the word ‘phenotype’ refers to deviations from normal morphology, physiology or behaviour7]. have received the least attention in ICU monitoring.8 This is mainly because of the challenge of extracting phenotypical information expressed in different contexts and contextual synonyms. For example, the phenotype hypotension can be expressed as ‘a drop in blood pressure’ or ‘BP of 79/48’. However, phenotypical information is crucial for understanding disease trajectory, identifying important disease-specific information, stratifying patients and identifying novel disease subtypes.9
This study thoroughly investigated the value of phenotypical information extracted from textual clinical data in ICU monitoring. Furthermore, this study expands on our previous study4 by incorporating additional clinical data from free-text clinical notes instead of limiting the patients’ profiles to data recorded in a structured format. Based on our previous study,10 we automatically extracted phenotypes from clinical texts using a self-supervised methodology. This methodology includes contextualised word embeddings,11 which are particularly helpful in detecting contextual synonyms. We extracted over 15 000 phenotypical concepts of the human phenotype ontology (HPO).12 Phenotypical features extracted in this manner were enriched with information from the structured data. To interpret our results, we used Shapley additive explanation (SHAP) values.13
We benchmarked our approach on the following three mainstream ICU tasks following practice4 for comparison: length of stay (LOS), in-hospital mortality and physiological decompensation.
Our main contributions are (1) the approach to incorporating phenotypical features from clinical textual data into the modelling of ICU time-series prediction tasks, (2) investigation of the importance of the phenotypical features in unstructured clinical data in combination with structured information for predicting patient course at the microlevel (individual patient) and macrolevel (cohort), (3) a thorough interpretability study demonstrating the importance of phenotypical and structured features for ICU cases, and (4) demonstration of the utility of automatic phenotyping for ICU use cases.
Methodology
Data preprocessing
The MIMIC-III, a publicly available ICU database, was used in this study.14 MIMIC-III contains 49 785 anonymised hospital admissions and 38 597 distinct adult patients (aged 16 years or above) admitted to a critical care unit (eg, coronary care unit, cardiac surgery recovery unit, medical ICU, surgical ICU and trauma surgical ICU) of the Beth Israel Deaconess Medical Center between 2001 and 2012. The median age of the adult patients was 65.8 years (Q1–Q3: 52.8–77.8); 55.9% of patients were male; and diseases of the circulatory system were the most prevalent (based on ICD-9: 390–459), accounting for 36.6% of all adult admissions.
We followed the standard practice4 of defining the three ICU tasks, data collection and data preprocessing on MIMIC-III. First, we formulated the in-hospital mortality problem as a binary classification 48 hours after admission, in which the label indicates whether the patient died before discharge. Second, physiological decompensation was formulated as a binary classification in which the target label corresponds to whether the patient will die in the next 24 hours. Finally, we cast the LOS prediction task as a multiclass classification problem, where the labels correspond to the remaining LOS. Possible values were divided into 10 bins: 1 for a LOS of less than a day, 7 bins for each day of the first week, another bin for the LOS of more than a week but less than 2 weeks, and the final bin for stays of more than 2 weeks.
For data collection, we used structured and unstructured data following the filtering criteria4 for patients in all three tasks. In addition, we discarded all ICU episodes in which a clinical note had not been recorded. This reduced our training and test data compared with the benchmark4; therefore, we recalculated the baseline scores using their code on our new test set for a fair comparison. Overall, there were over 24 000 patients, and the exact numbers of patients, ICU episodes and time steps per task are reported in section A.1 of the online supplemental appendix. The mortality rate across all patients was 13.12%, and the decompensation rate across all time steps was 2.01%. Most patients stayed in the ICU for less than 7 days, and the distribution of ICU admissions per LOS class is presented in detail in section A.2 of the online supplemental appendix.
Supplemental material
For the preprocessing of structured data, we followed steps [Accessed in November 2021 (https://github.com/YerevaNN/mimic3-benchmarks)] to collect 17 clinical features (capillary refill rate, diastolic blood pressure, fraction inspired oxygen, Glasgow Coma Scale eye opening, Glasgow Coma Scale motor response, Glasgow Coma Scale verbal response, Glasgow Coma Scale total glucose, heart rate, height, mean blood pressure, oxygen saturation, respiratory rate, systolic blood pressure, temperature, weight and pH). Highly specific features may not be routinely obtained for all patients. The inclusion of such features renders the algorithm less generalisable. Therefore, additional structured clinical features were excluded to ensure comparability with the previous studies. For data preprocessing of unstructured data, we collected all free-text clinical notes, including nursing notes, physician notes and discharge summaries, at all time steps during the ICU stay. High data sparsity was observed because clinical notes were recorded roughly every 12 hours. Processed structured and unstructured data were used as inputs for the proposed approach.
Algorithm development and analysis
The proposed approach consisted of two steps. The first step collected clinical features (specifically, phenotypical features standardised by HPO12) from unstructured data using natural language processing algorithms. The second step combined the phenotypical features from unstructured data and the 17 clinical features from structured data as input features for machine learning classifiers to separately predict in-hospital mortality, physiological decompensation and LOS. Unlike the study by Harutyunyan et al,4 which used only 17 features from structured data as input, the proposed approach combines clinical features from unstructured and structured data.
First, we applied a state-of-the-art phenotyping model to extract phenotypes from free-text clinical notes.10 This model leveraged self-supervised pretraining techniques, contextualised word embeddings by the transformer model15 and data augmentation techniques (paraphrasing and synthetic text generation) to capture names (such as hypertension), synonyms (such as high blood pressure), abbreviations (such as HTN) and, more importantly, contextual synonyms. For example, descriptive phrases such as ‘rise in blood pressure’, ‘blood pressure is increasing’ and ‘BP of 140/90’ are considered contextual synonyms of hypertension (HP:0000822), and finding such contextual synonyms requires an understanding of the context. Thus, the phenotyping model demonstrated superior performance to alternative algorithms. We refer readers to a recent work10 for the methodological details. For comparison, we used alternative phenotyping methods, including ClinicalBERT11 (fine-tuned for phenotyping) and neural concept recogniser (NCR).16 NCR uses convolutional neural networks to assign similarities to HPO concepts encoded by pretrained non-contextualised word embeddings.
Second, the phenotypical features were combined with structured clinical features as input features for machine learning classifiers to predict the three ICU tasks. We used standard machine learning classifiers: random forest (RF)17 and long short-term memory (LSTM) networks18 for prediction (the hyperparameters are available in section A.3, online supplemental appendix). We distinguished between persistent and transient phenotypical features to reduce sparsity.
More precisely, phenotypes that were clinically likely to last an entire admission in the vast majority of typical cases (eg, tuberculosis and cancer) were labelled as ‘persistent’. Phenotypes acquired or improved during a stay, such as fever or cough, were labelled as ‘transient’. We developed transient and persistent phenotypes from the moment they appeared until a new clinical note appeared or until the end of the stay. Phenotype transiency and persistency patterns were leveraged in the model to make clinical predictions. This was found to be beneficial and will be discussed in the Phenotype persistency section. We also addressed data sparsity by aggregating the HPO terms into their parents (according to the HPO hierarchy).
Evaluation metrics
For comparison with Harutyunyan et al,4 we used area under the curve–receiver operating characteristic (AUC-ROC)19 and area under the curve-precision recall (AUC-PR) for in-hospital mortality and physiological decompensation tasks. We primarily relied on AUC-ROC for statistical analysis because it is threshold independent and used by the benchmark4 as the primary metric. For the LOS task, we used Cohen’s kappa20 and the mean absolute deviation,21 with emphasis on the kappa scores for statistical analysis.
Model evaluation and statistical analysis
A train-test split based on the benchmark was used,4 with patients without clinical notes excluded, resulting in 21 346 and 3824 patients for the training and test sets, respectively. Further, we performed fourfold cross-validation on the training set, and all splits were deterministic. We used bootstrap resampling following the benchmark for statistical analysis. To compute CIs on the test set, we resampled it 1000 times for LOS and decompensation, and 10 000 times for in-hospital mortality tasks. We then computed the scores on the resampled data for the 95% CIs.
To provide interpretability for model predictions, we used SHAP values,13 the implementation details of which are explained in section A.4 (online supplemental appendix). The SHAP values were used to explain the black box models and allowed us to quantify feature importance and their positive or negative impact on the outcome.
Results
The performance of two classifiers was investigated: RF and LSTM. For each, we investigated the following features: structured features only (S) and structured features enriched with phenotypical features from one of the three phenotype annotators (ClinicalBERT, NCR and Ours). Across all tasks, ClinicalBERT found 664 phenotypes; NCR found 1441 phenotypes, and our model found 1446 phenotypes, on average. Thirty per cent of these phenotypes are persistent.
The results are presented in table 1, and those from the statistical tests are presented in section A.5 (online supplemental appendix). Additionally, we provide the cross-validation results in section A.6 (online supplemental appendix). Overall, they showed that phenotypical information positively complements structured information to improve performance on all tasks. The improvements with our phenotyping model were statistically significant across all tasks compared with using S or alternative phenotyping algorithms, except for in-hospital mortality with RF. This is explained by the fact that phenotypes carry highly valuable information.22 23
Results for (A) in-hospital mortality, (B) physiological decompensation and (C) LOS
Discussion
Decision support systems in the healthcare domain should be reliable, interpretable and robust; therefore, we accompanied the aforementioned results with a thorough study on interpretability both at the patient and cohort levels and an assessment of robustness by studying disease-specific subcohorts.
Phenotype persistency
We determined that it was beneficial to propagate phenotypes forward in time. Each phenotype is marked by a human clinical expert based on whether it typically persists throughout the ICU stay. Consequently, transient (eg, fever, cough and dyspnoea) and persistent (eg, diabetes and cancer) phenotypes propagate until the appearance of a new clinical note or the end of stay, respectively. We performed an ablation study and observed that phenotype propagation was more beneficial for RF than LSTM. The RF models with phenotype propagation achieved 4.6% higher AUC-ROC for in-hospital mortality, 2.5% higher AUC-ROC for decompensation and 3.4% higher kappa for LOS than RF without phenotype propagation. However, LSTM with phenotype propagation achieved 1.4% higher AUC-ROC for in-hospital mortality, comparable results for decompensation, and 1.1% lower kappa for LOS. We hypothesise that LSTM, by design, can better capture temporal relationships, given a large amount of data to learn from. The results are presented in section A.7 (online supplemental appendix).
Phenotype importance
To elucidate the contribution of phenotypical features to prediction performance, the most important features were studied using the SHAP values.13 Because computing SHAP values is computationally complex, to accelerate the computation, this and all subsequent interpretability analyses based on SHAP values were conducted on the RF models rather than on the LSTM models. An illustration of our investigation is shown in figure 1, where we present the top predictive features for in-hospital mortality and physiological decompensation. This confirms that phenotypical features are beneficial for in-hospital mortality prediction, given that 13 of the 20 most important features are phenotypes. This is explained by the fact that forecasts need to rely on information that can provide insights accurately into the long-term future.
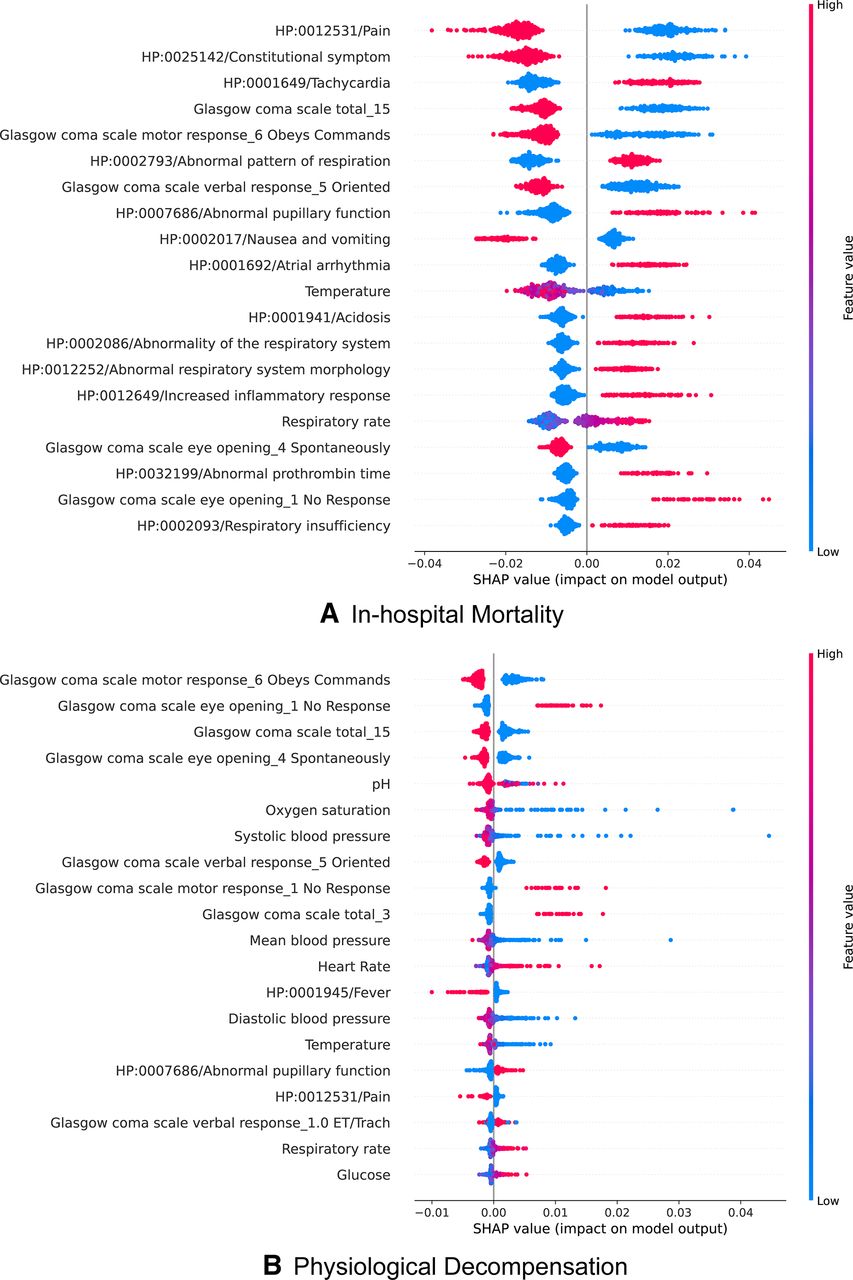
Top features for in-hospital mortality and physiological decompensation. Features are sorted in decreasing importance according to their mean absolute SHAP values. Each row presents a condensed summary of the feature’s impact on the prediction. Each data sample is represented as a single dot in each row, and its colour on a particular row represents the value of that sample for that feature, with blue corresponding to lower values or absence and red corresponding to higher ones or presence.The SHAP value (horizontal position of a dot) measures the contribution of that feature on a sample, towards the prediction (right corresponding to mortality or decompensation and left corresponding to survival or out of decompensation risk). For instance (in A, top row), since the vertical axes clearly splits patients by colour, manifesting HP:0012531 pain consistently leads to lower chances of dying. SHAP, Shapley additive explanation.
Contrary to bedside measurements, which may not correlate well with future outcomes owing to their dynamic nature, phenotypes are highly informative, given that they capture, for instance, comorbidities, which are essential for predicting mortality.23 Furthermore, another study24 including 230 000 ICU patients found that combining comorbidities with acute physiological measurements yielded the best results, outperforming traditional mortality scores (APACHE-II25 and SAPS-II26).
Interestingly, the top-ranking feature for mortality prediction is whether the patient experiences pain. We also observed that the second top-ranking feature is constitutional symptoms (HP:0025142). Noting that this is actually the resulting phenotype after aggregating all of its children, this phenotype should be interpreted not as a textual mention in the patient’s EHR of the broad term but rather as a mention of any of its children (most notably generalised pain). Consequently, the second feature again highlights the importance of pain.
Although not decisive, some initial evidence corroborates the fact that pain management improves outcomes in the ICU.27 However, pain can be interpreted as a proxy for establishing a high level of consciousness, which has been correlated with better outcomes in the ICU.28
The other top-ranking phenotypes, such as atrial arrhythmia, nausea and vomiting, cover most of the body systems (ie, heart, lungs, gastrointestinal tract, central nervous system, coagulation, infection and kidneys), which are typically assessed using clinically validated scores, for example, APACHE-II and SAPS-II.
Our study also showed that, although phenotypical features are not as important for decompensation as for in-hospital mortality (only 3 out of the top 20 features for this task were phenotypes), they are nonetheless useful because they provide a more accurate estimation of the predicted risk. Given that this task is concerned with predicting mortality within the next 24 hours, bedside measurements become more informative because of their temporal correlation (illustrated in section A.8, online supplemental appendix). Nevertheless, bedside measurements can be ambiguous or provide an incomplete picture of the patient’s status without the data found in clinical notes. For example, for one patient, neoplasm of the respiratory system (HP:0100606) was found to be the top feature, and although this phenotype was persistent, it increased the risk of decompensation appropriately, providing an overall better estimation. An illustration of this patient is presented in section A.9 (online supplemental appendix).
Similarly, the top features for long lengths of stay (more than 1 week) are presented in section A.10 (online supplemental appendix), where 10 of the 20 top features are phenotypes.
Calibration
The calibration of machine learning models compares the distribution of the probability predicted by the models with the distribution of probabilities observed in real patients. To measure model calibration, we used the Brier score29 (the lower, the better). Our investigation of the respective calibration curves (see figure 2 and section A.11, online supplemental appendix) shows that phenotypes from unstructured notes improve model calibration across set-ups, especially for physiological decompensation and in-hospital mortality, which means that the distribution predicted by the models is closer to the real distribution of patients.
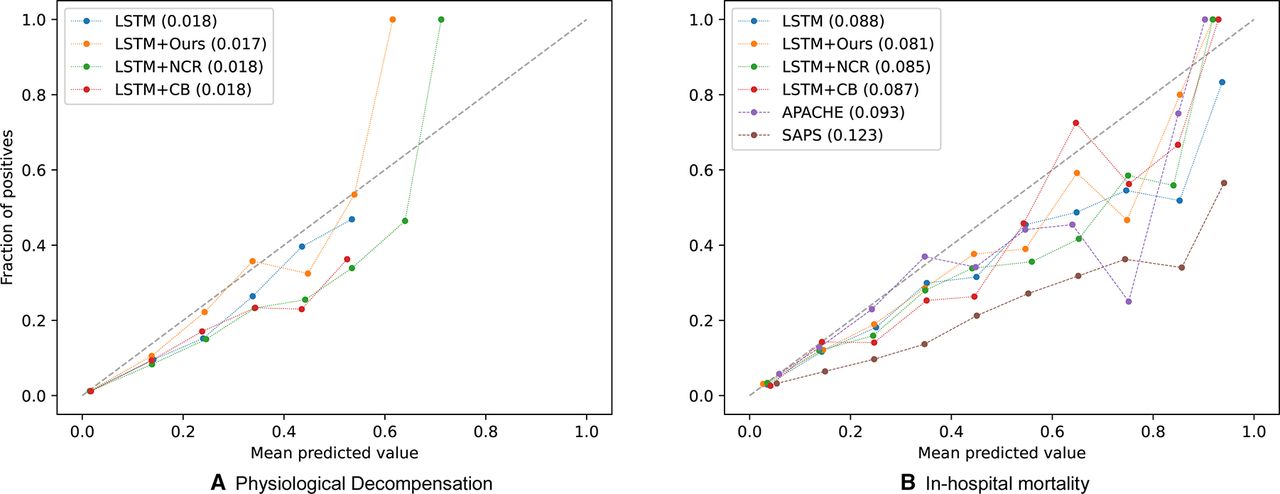
Calibration curves with LSTM for (A) physiological decompensation and (B) in-hospital mortality. Calibration curves are presented with its Brier score (the lower the better). Note that overall inclusion of phenotypical features from unstructured data helps with calibration. LSTM in legend refers to using structured features only. Ours, NCR, CB: phenotypical features from our phenotyping model, neural concept recogniser and ClinicalBERT, respectively. LSTM, long short-term memory; SAPS, Simplified Acute Physiology Score.
Prognosis analysis
Beyond producing clinically relevant explanations at the cohort level, with the help of SHAP values, we characterised a patient’s disease trajectory and retrospectively discovered when and why the patient was the most vulnerable. For example, the fragment of a patient’s LOS forecast in figure 3 illustrates an estimated probability, 41 hours after admission, of an LOS longer than 14 d of 69%, mainly because the patient scored one on the Glasgow Coma Scale verbal response. One hour later, when a clinical note became available, worrisome phenotypes appeared (including oedema, hypotension and abnormality of the respiratory system). Consequently, the estimated probability increased to 88%.

Illustrative case for an ICU length of stay of more than 14 days. Time course of the normalised predicted probability for a stay of more than 14 days and feature heatmap for a representative segment of the ICU stay. Each row of the heatmap represents one of the top features. At each time step, a feature can contribute positively (red) or negatively (blue) for predicting a stay of 14 days or more. Black horizontal bars at the right of each row represent the importance of the features. Note that a new clinical note that is available at the 42nd hour (vertical dashed line) leads to an increase in confidence of longer stay due to new features. Given the appearance of oedema, hypotension and abnormality of the respiratory system, the probability of a long stay increases from 69% to 88%. ICU, intensive care unit.
Cohort study
To understand its robustness, the performance of the proposed approach was assessed on cohorts of patients with different diseases, especially under-represented diseases. The test set was split into four disease-specific cohorts for patients with cardiovascular disease, diabetes, cancer and depression. The accuracies of the best LSTM models (using structured and phenotypical features) were reported individually for each cohort in each ICU task.
For in-hospital mortality and physiological decompensation, we observed comparable accuracies across the four cohorts. We reported an AUC-ROC range of 0.780–0.826 for in-hospital mortality and 0.792–0.820 for physiological decompensation in the four cohorts. In contrast, for LOS, we observed lower kappa values of 0.321 and 0.330 for small cohorts with cancer and depression, respectively, as opposed to 0.413 and 0.424 for larger cohorts with cardiovascular diseases and diabetes. We hypothesised that the nature of diseases has strong implications for in-hospital mortality and physiological decompensation, whereas LOS can be influenced by more factors that require larger data samples to model their interactions. The results are presented in section A.12 (online supplemental appendix).
Limitations
This study was conducted on one data source, MIMIC-III; hence, the validity of the observations must be confirmed using other data sources. Furthermore, an investigation of different care units may provide additional insights. The analysis of phenotype importance is produced on the RF, whose accuracy is superior to that of the baselines but not as good as that of the LSTM. This is limited by the poor computational efficiency of the SHAP values for the LSTM. Moreover, phenotypes annotated as transient are present only until a new clinical note appears in the timeline. This is inconvenient because phenotypes may be prematurely considered as not present because the next available clinical note did not mention them.
Ethics statements
Patient consent for publication
Ethics approval
Not applicable.
Acknowledgments
We thank Dr Rick Sax, Dr Garima Gupta and Dr Matt Wiener for their feedback throughout this research; Dr Garima Gupta, Dr Deepa (MRSH) and Dr Ashok (MS) for helping us create gold-standard phenotype annotation data.
References
Supplementary materials
Supplementary Data
This web only file has been produced by the BMJ Publishing Group from an electronic file supplied by the author(s) and has not been edited for content.
Footnotes
JZ, LDBT and AT contributed equally.
Contributors JZ, LDBT, AT and JI conceived the experiments and analysed the results. LDBT and AT conducted the experiments. JI, VB and YG reviewed the research and manuscript. All authors approved the manuscript. YG is the corresponding author and guarantor of this work.
Funding The authors have not declared a specific grant for this research from any funding agency in the public, commercial or not-for-profit sectors.
Competing interests This research is solely funded by Pangaea Data Limited. JZ, LDBT, AT, VG and YG are employed by Pangaea Data Limited. JI is employed by the Queen Mary University of London, but this study was conducted when JI was employed by Pangaea Data Limited. YG is also employed by Imperial College London and Hong Kong Baptist University, but YG supervised this study at Pangaea Data Limited.
Provenance and peer review Not commissioned; externally peer reviewed.
Supplemental material This content has been supplied by the author(s). It has not been vetted by BMJ Publishing Group Limited (BMJ) and may not have been peer-reviewed. Any opinions or recommendations discussed are solely those of the author(s) and are not endorsed by BMJ. BMJ disclaims all liability and responsibility arising from any reliance placed on the content. Where the content includes any translated material, BMJ does not warrant the accuracy and reliability of the translations (including but not limited to local regulations, clinical guidelines, terminology, drug names and drug dosages), and is not responsible for any error and/or omissions arising from translation and adaptation or otherwise.