Article Text

Abstract
Objectives The American College of Cardiology and the American Heart Association guidelines on primary prevention of atherosclerotic cardiovascular disease (ASCVD) recommend using 10-year ASCVD risk estimation models to initiate statin treatment. For guideline-concordant decision-making, risk estimates need to be calibrated. However, existing models are often miscalibrated for race, ethnicity and sex based subgroups. This study evaluates two algorithmic fairness approaches to adjust the risk estimators (group recalibration and equalised odds) for their compatibility with the assumptions underpinning the guidelines’ decision rules.MethodsUsing an updated pooled cohorts data set, we derive unconstrained, group-recalibrated and equalised odds-constrained versions of the 10-year ASCVD risk estimators, and compare their calibration at guideline-concordant decision thresholds.
Results We find that, compared with the unconstrained model, group-recalibration improves calibration at one of the relevant thresholds for each group, but exacerbates differences in false positive and false negative rates between groups. An equalised odds constraint, meant to equalise error rates across groups, does so by miscalibrating the model overall and at relevant decision thresholds.
Discussion Hence, because of induced miscalibration, decisions guided by risk estimators learned with an equalised odds fairness constraint are not concordant with existing guidelines. Conversely, recalibrating the model separately for each group can increase guideline compatibility, while increasing intergroup differences in error rates. As such, comparisons of error rates across groups can be misleading when guidelines recommend treating at fixed decision thresholds.
Conclusion The illustrated tradeoffs between satisfying a fairness criterion and retaining guideline compatibility underscore the need to evaluate models in the context of downstream interventions.
- BMJ Health Informatics
- decision support systems
- clinical
- health equity
- medical informatics
- machine learning
Data availability statement
Data may be obtained from a third party and are not publicly available. The six data sets used: ARIC (Atherosclerosis Risk in Communities Study), CARDIA (Coronary Artery Risk Development in Young Adults Study), CHS (Cardiovascular Health Study, 1989–1999), FHS OS (Framingham Heart Study Offspring Cohort), MESA (Multi-Ethnic Study of Atherosclerosis) and JHS (Jackson Heart Study), are available on BioLINCC.
This is an open access article distributed in accordance with the Creative Commons Attribution Non Commercial (CC BY-NC 4.0) license, which permits others to distribute, remix, adapt, build upon this work non-commercially, and license their derivative works on different terms, provided the original work is properly cited, appropriate credit is given, any changes made indicated, and the use is non-commercial. See: http://creativecommons.org/licenses/by-nc/4.0/.
Statistics from Altmetric.com
- BMJ Health Informatics
- decision support systems
- clinical
- health equity
- medical informatics
- machine learning
Summary
What is already known?
Algorithmic fairness methods can be used to quantify and correct for differences in specific model performance metrics across groups, but the choice of an appropriate fairness metric is difficult.
The pooled cohort equations (PCEs), 10-year atherosclerotic cardiovascular disease risk prediction models used to guide statin treatment decisions in the USA, exhibit differences in calibration and discrimination across demographic groups, which can lead to inappropriate or misinformed treatment decisions for some groups.
Two theoretically incompatible fairness adjustments have been separately proposed for re-deriving the PCEs.
What does this paper add?
Proposes a measure of local calibration of the PCEs at therapeutic thresholds as a method for probing guideline compatibility.
Quantifies the effect of two proposed fairness methods for re-deriving the PCEs in terms of their impact on local calibration.
Illustrates general principles that can be used to conduct contextually-relevant fairness evaluations of models used in clinical settings in the presence of clinical guidelines.
Introduction
While risk stratification models are central to personalising care, their use can worsen health inequities.1 In an effort to mitigate harms, several recent works propose algorithmic group fairness—mathematical criteria which require that certain statistical properties of a model’s predictions not differ across groups.2 3 However, identifying which statistical properties are most relevant to fairness in a given context is non-trivial. Hence, before applying fairness criteria for evaluation or model adjustment, it is crucial to examine how the model’s predictions will inform treatment decisions—and what effect those decisions will have on patients’ health.
Here, we consider the 2019 guidelines of the American College of Cardiology and the American Heart Association (ACC/AHA) on primary prevention of atherosclerotic cardiovascular disease (ASCVD),4 which codify the use of 10-year ASCVD risk predictions to inform a clinician-patient shared decision-making on initiating statin therapy. These guidelines recommend that individuals estimated to be at intermediate risk (>7.5%–20%) be considered for initiation for moderate-intensity to high-intensity statin therapy, and that those at high risk (>20%) be considered for high-intensity statin therapy. Individuals at borderline risk (>5%–7.5%) may be considered for therapy under some circumstances.4 5
These therapeutic thresholds were established based on randomised control trials, and correspond to risk levels where expected overall benefits derived from low-density lipoprotein cholesterol reduction outweigh risks of side effects (online supplemental file C).4 6 In general, such thresholds can be identified using decision analysis methods7 (figure 1A). The models accompanying the guidelines (pooled cohort equations, PCEs6 8 9), developed for Black women, white women, Black men and white men, differ in both calibration and discrimination across groups.10 11 The resultant systematic bias in risk misestimation in these subgroups can lead to inappropriate or misinformed treatment decisions. Since then, several works derived updated equations,11–14 some explicitly incorporating fairness adjustments.13 14
Supplemental material
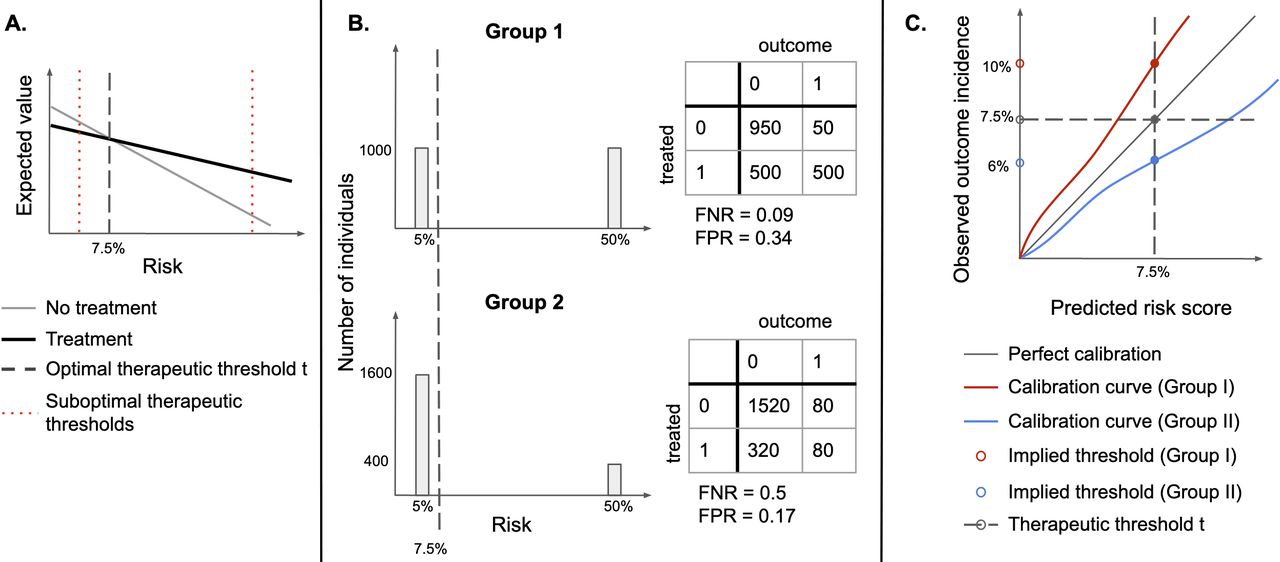
(A) Identifying an optimal therapeutic threshold. An individual with risk r should be treated if the expected value of treatment exceeds that of non-treatment. As risk increases, the benefits of treatment become more significant, and assigning treatment becomes more optimal than withholding it. The optimal therapeutic threshold t is the value of risk at which treatment and non-treatment have the same expected value (the indifference point)—for individuals with r>t, treatment is expected to be more beneficial than non-treatment. Setting a non-optimal therapeutic threshold could lead to suboptimal treatment decisions for some individuals (treating some individuals for whom non-treatment has a higher expected value, or not treating individuals for whom treatment has a higher expected value). (B) Illustration of the sensitivity of FPR and FNR to the distribution of risk. Assume that there are two types of easily distinguishable individuals: with 5% and 50% chance of developing a disease, respectively, and there are two groups composed of both types of individuals, but one has a higher proportion of lower-risk individuals. If the same therapeutic threshold is applied to both groups, false positive rates (FPR) and false negative rates (FNR) will not be equal, even though we would be making optimal treatment decisions for each patient, in both populations. (C) Under miscalibration, implied thresholds differ from therapeutic thresholds. If risk scores are miscalibrated, taking action at the threshold of 7.5% corresponds to different observed outcome rates in the two groups. For Group I, a risk score of 7.5% corresponds to an observed outcome incidence of 10%, while for Group II it corresponds to 6%, therefore, individuals in Group II would be treated at a lower risk than individuals in Group I.
If therapeutic thresholds recommended by guidelines reflect a balance of relevant harms and benefits for all subgroups,15 16 therapeutic decisions could be unfair if thresholds used for different groups differ, as they would lead to suboptimal treatment decisions for some groups (figure 1A). As such, subgroup calibration at optimal therapeutic thresholds is an important fairness criterion for 10-year ASCVD risk estimation models,14 since under miscalibration (systematic overestimation or underestimation of risk), treatment thresholds implicitly change (figure 1C) from treatment thresholds to implied thresholds.17 18
An alternative fairness criterion, known as equalised odds (EO),3 which has previously been used to evaluate several clinical predictive models,13 19 20 requires equality in false positive and false negative error rates (FPR and FNR) across groups. One work proposed to explicitly incorporate EO constraints into the training objective to learn ASCVD risk estimators with minimal intergroup differences in FPR and FNR.13
In the context of ASCVD risk estimation, the EO criterion lacks a clear motivation and can thus yield misleading results. FPR and FNR are sensitive to the distribution of risk and are expected to differ across groups when the incidence of outcomes differs (figure 1B).18 21 22 Furthermore, approaches to build EO-satisfying models either explicitly adjust group-specific decision thresholds, introduce differential miscalibration or reduce model fit for each group3—which may lead to suboptimal decisions (figure 1A,C). EO-satisfying models may therefore be less appropriate than calibrated estimators for use with the ACC/AHA guidelines.17
We aim to evaluate the tension between calibration, EO and guideline-concordant decision-making. To do so, we propose a measure of local calibration at guideline-concordant therapeutic thresholds as a method for probing guideline compatibility and apply it to unconstrained, group-recalibrated and EO-constrained versions of the 10-year ASCVD risk prediction models learnt from the updated pooled cohorts data set,9 11 as well as the original8 and revised PCEs.11 We assess the proposed local calibration measure and error rates across groups for each model, and conclude with recommendations for identifying quantification and adjustment criteria for enabling fair model-guided decisions.
Methods
Data sets
We use an updated pooled cohorts data set,11 comprised of ARIC (Atherosclerosis Risk in Communities Study, 1987–2011), CARDIA (Coronary Artery Risk Development in Young Adults Study, 1983–2006), CHS (Cardiovascular Health Study, 1989–1999), FHS OS (Framingham Heart Study Offspring Cohort, 1971–2014), MESA (Multi-Ethnic Study of Atherosclerosis, 2000–2012) and JHS (Jackson Heart Study, 2000–2012). Following the original PCE inclusion criteria,9 we include individuals aged 40–79, excluding those with a history of myocardial infarction, stroke, coronary bypass surgery, angioplasty, congestive heart failure or atrial fibrillation, or receiving statins at the time of the initial examination. We include all individuals, regardless of racial category, and classify them as Black and non-Black, consistent with the use of PCEs in practice for non-Black patients of colour.
We extract features included in the PCEs (total cholesterol, high-density lipoprotein (HDL) cholesterol, treated and untreated systolic blood pressure, diabetes, smoking status, age, binary sex and race) and body mass index, recorded at the initial examination. We also extract dates of observed ASCVD events (myocardial infarction, lethal or non-lethal stroke or lethal coronary heart disease), and of last recorded observation (follow-up or death), to define binary labels for 10-year ASCVD outcome and censoring. Individuals whose last recorded observation happened before an ASCVD event and before year 10 are considered censored. We remove records with extreme values of systolic blood pressure (outside 90–200 mm Hg), total cholesterol and HDL cholesterol (outside 130–320 and 20–100 mg/dL, respectively) or missing covariates.
Models
Unconstrained model
The original PCEs consist of four separate Cox proportional hazards models, stratified by sex and race, to account for differences in ASCVD incidence across the four groups (Black women, white women, Black men and white men).8 One revision of the PCEs, which reduced overfitting and improved calibration, replaced the Cox models with censoring-adjusted logistic regression models, stratified by sex and included race as a variable in each model.11 Our implementation of the unconstrained (UC) models consists of a single inverse probability of censoring (IPCW)-adjusted logistic regression model,23 and includes race and sex as binary variables. Censoring weights are obtained from four group-level Kaplan-Meier estimators applied to the training set. We include all features and their two-way interactions.
Group-recalibrated model
For recalibration, we logit-transform the predicted probabilities generated by the UC model, and use IPCW-adjusted logistic regression to fit a calibration curve for each group. We then use the resulting group-recalibrated model to obtain a set of recalibrated predictions.
EO model
The EO criterion requires that both the FPR and FNR be equal across groups at one or more thresholds.3 We use an in-processing method for constructing EO models,22 24 which provides a better calibration-EO tradeoff than the post-processing approach.25 We define the training objective by adding a regulariser to the UC model’s objective (online supplemental file A), with the degree of regularisation controlled by λ. The regulariser penalises differences between FPR and FNR at specified decision thresholds (7.5% and 20%), across the four groups.
Training procedures
Using random sampling stratified by group, outcome and presence of censoring, we divide our cohort into the training (80%), recalibration (10%) and test (10%) sets. Using the same procedure, we divide the training set into 10 equally-sized subsets and, for each subset, train a logistic regression model using stochastic gradient descent for up to 200 iterations of 128 minibatches, with learning rate of 10−4 on the remaining subsets. We terminate training if the cross-entropy loss does not improve on the held-out subset for 30 iterations. This procedure generates 10 UC models. To generate group-recalibrated models, we first generate predictions on the recalibration set, using the UC models (figure 2) and then use those train logistic regression models using BFGS (Broyden-Fletcher-Goldfarb-Shanno) optimisation, implemented in Scikit-Learn,26 with up to 105 iterations. To examine the impact of the EO penalty, we repeat the unconstrained training procedure using the regularised training objective with four different settings of the parameter λ, distributed log-uniformly on the interval 0.1–1.0 (0.100, 0.215, 0.464, 1.000) and refer to the resulting models as EO1 through EO4. PyTorch V.1.5.027 is used to define all models and training procedures. We make our code available at https://github.com/agataf/fairness_eval_ascvd.

Visual abstract. Data from the six considered data sets: ARIC (Atherosclerosis Risk in Communities Study), CARDIA (Coronary Artery Risk Development in Young Adults Study), CHS (Cardiovascular Health Study), FHS OS (Framingham Heart Study Offspring Cohort), MESA (Multi-Ethnic Study of Atherosclerosis) and JHS (Jackson Heart Study), is extracted using the cohort definition used in the original pooled cohort equations (PCEs), and divided into train (80%), validation (10%) and test (10%) sets. Equalised odds and unconstrained (UC) models are derived directly from the training set. The recalibrated model is derived from the UC model using a recalibration procedure, which uses the validation data set (not seen during training). Finally, predictions on the test set are generated for all models—including the PCEs and the revised PCEs (rPCE), derived in past work—and evaluated.
Evaluation
We introduce threshold calibration error (TCE), a measure of local calibration, defined as the difference between the therapeutic threshold (t1=7.5% or t2=20%) applied on the risk estimate and the implied threshold on the risk, measured by the calibration curve (figure 1C). As in the recalibration procedure, we estimate implied thresholds ga(ti) at a fixed therapeutic threshold ti by fitting a calibration curve ga for each group a (figure 1C). Then, for each threshold i we obtain TCE(i,a):

A negative TCE indicates risk underestimation, since the threshold applied to the risk score is lower than the observed incidence of the outcome at that predicted risk level. Similarly, a positive TCE indicates risk overestimation.
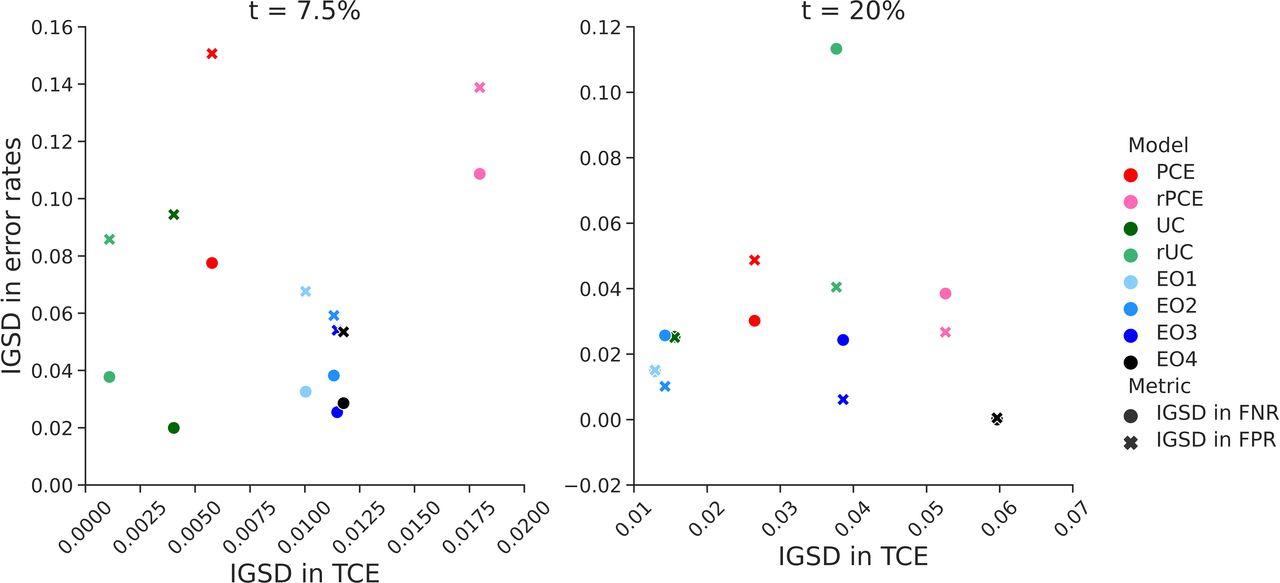
To understand the tradeoff between TCE, FPR and FNR, we calculate intergroup SD (IGSD) between the four group-specific values of the three metrics. For a threshold i, metric M and A distinct groups, IGSDMi is defined as
 , where
IGSD captures the degree of performance disparity between groups; high IGSD in FPR and FNR corresponds to an EO disparity, and high IGSD in TCE corresponds to a treatment rule disparity.
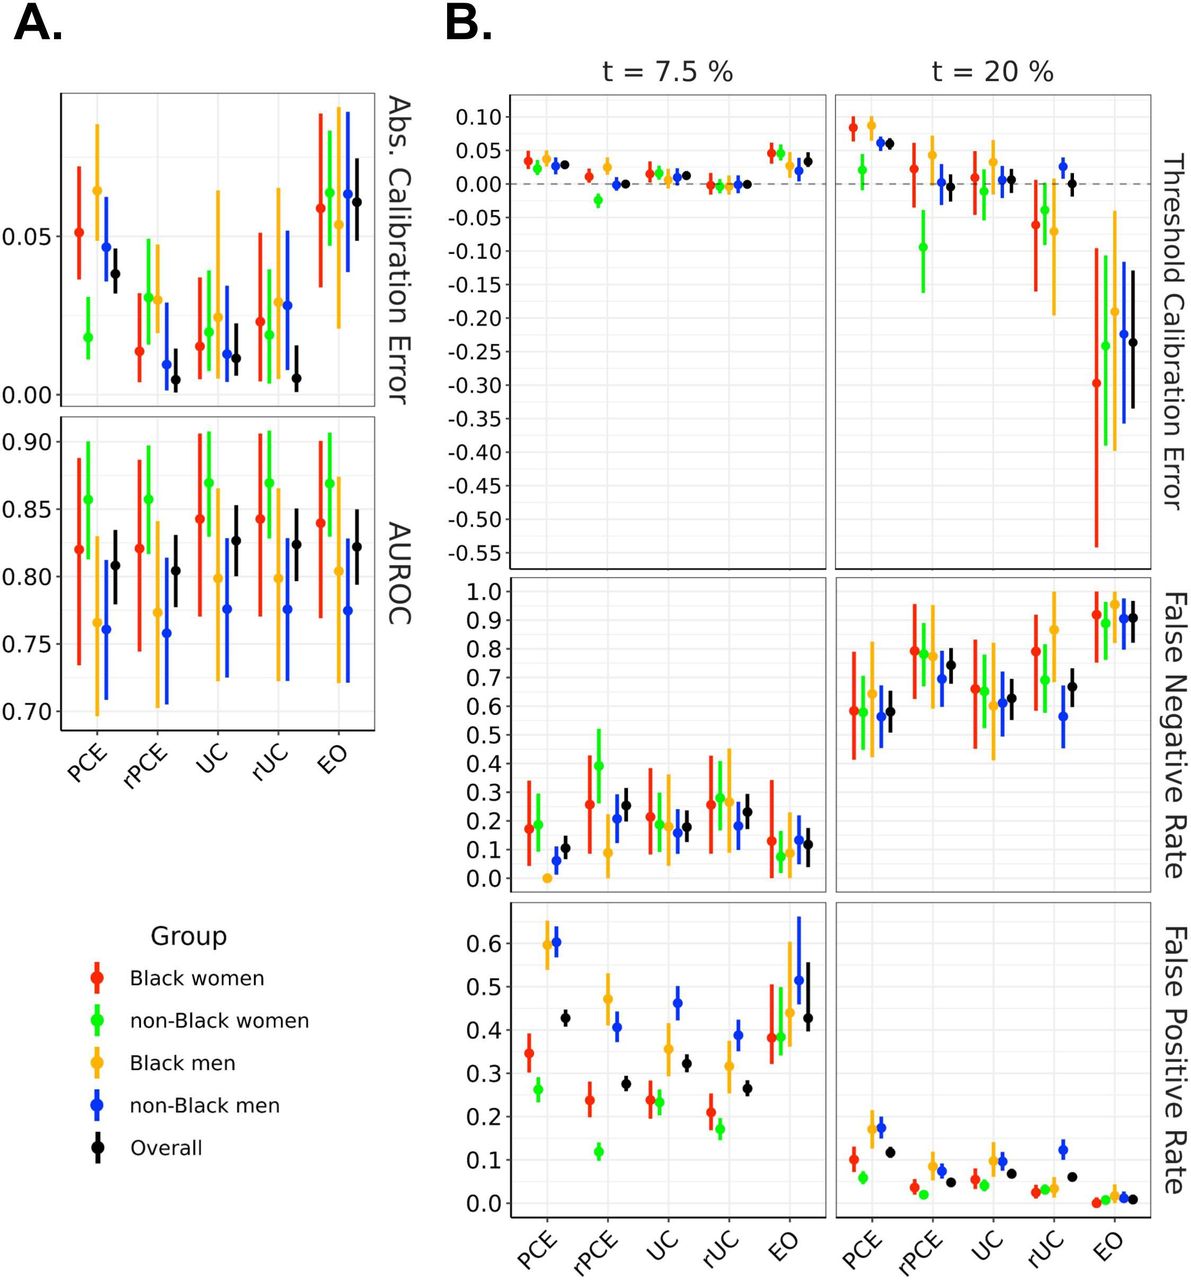
For each of the four subgroups, and overall population, we report calibration and discrimination metrics at both the aggregate (absolute calibration error, ACE22 and area under the receiver operating characteristic, AUROC) and the threshold level (TCE, FPR and FNR) at t1 and t2, for the UC model, the group-recalibrated model (rUC) and the best-performing EO model, as well as the original PCEs9 (PCE) and revised PCEs11 (rPCE). We draw 1000 bootstrap samples from the test set, stratified by group and outcomes, to derive point estimates and 95% CIs for each metric. The 95% CIs are defined as the 2.5% to 97.5% percentiles of the distribution obtained via pooling over both the bootstrap samples and the 10 model replicates derived from the training procedure. We also report IGSD between the four group-specific median values in TCE, FPR and FNR at both thresholds. All metrics are computed over the uncensored population and adjusted for censoring using IPCW.
Results
We describe the study population and present performance of the models. We report the TCE, FPR and FNR in figure 3, and IGSD of those three metrics in figure 4. We present results for EO3 in figure 3, as it was the only equalised odds model that achieved a reduction of IGSD (FPR) while keeping a low IGSD (FNR) at both thresholds. Results for the remaining EO models are included in online supplemental file B.

Model performance across evaluation metrics, stratified by demographic group, evaluated on the test set. The left panel showsAUROC and absolute calibration error. The right panel shows false negative rates, false positive rates and threshold calibration error at two therapeutic thresholds (7.5% and 20%). EO, equalised odds; PCEs, original pooled cohort equations; rPCE, revised PCEs; rUC, recalibrated model; UC, unconstrained model.
Relationship between intergroup variability in threshold calibration rate (TCE) and error rates. The figure shows the relationship between intergroup SD (IGSD) of threshold calibration error (on the x-axis) and IGSD of false negative rate (FNR, circles) and false positive rate (FPR, crosses) across the models: EO1–4, equalised odds with increasing values of λ. The EO3 corresponds to the EO model discussed in the Results section. In the models we trained, IGSD of TCE scales inversely with the IGSD of FNR and FPR. PCE, original pooled cohort equations; rPCE, revised PCEs; rUC, recalibrated model; UC, unconstrained model.
Study population
Overall, 25 619 individuals met the inclusion criteria, of whom 80% (N=20495) were assigned to the training set, and 10% (N=2562) to each the recalibration and test sets. Table 1 summarises the mean age, ASCVD event incidence and frequency of censoring across the six data sets and four demographic groups. A cohort construction flowchart is included in online supplemental figure B1.
Cohort characteristics for patients who met inclusion criteria
Model performance
The UC model achieved an overall AUROC of 0.827, (95% CI=(0.800 to 0.853)), comparing favourably with PCE (0.808 (0.779 to 0.835)) and rPCE (0.804 (0.777 to 0.831)), while maintaining differences of AUROC between groups (figure 3A). While UC had a slightly higher overall ACE (0.011 (0.006 to 0.023)) than rPCE (0.005 (0.001 to 0.015)), as well as a slightly higher local miscalibration at t1 (TCE(t1) 0.012 (0.006 to 0.019) versus 0.000 (−0.004 to 0.005)), IGSD(TCE, t1) and IGSD(TCE, t2) both reduced under UC (from 0.018 to 0.004, and 0.053 to 0.016, respectively) (figure 4).
The group recalibration procedure (rUC) reduced the magnitude of TCE(t1) overall (−0.001 (−0.007 to 0.006)), and for each group, relative to UC (0.012 (0.006 to 0.019)) (figure 3A). While recalibration improved TCE(t2) overall (0.00 (−0.019 to 0.016) vs 0.006 (−0.013 to 0.023)), it increased the magnitude of miscalibration of individual groups—for instance, shifting TCE(t2) from 0.033 (–0.016 to 0.066) to −0.071 (−0.196 to 0.008) for Black men, and increasing IGSD(TCE, t2) to 0.038. We also observe that, while TCE(t1) and IGSD(TCE, t1) improved for rUC, IGSD(FNR, t1) worsened, increasing from 0.020 to 0.038, as did IGSD(FPR, t2) and IGSD(FNR, t2) (figure 4). Additionally, at each threshold, for all models, we observe a relationship between TCE, FPR and FNR: increased TCE (overestimation) leads to higher FPR and lower FNR, and decreased TCE (underestimation)—to lower FPR an higher FNR (figure 3B).
The EO procedure generated models with FPR and FNR which approached similar values across groups at both t1 or t2—bringing IGSD(FPR, t1) to 0.054 from 0.094 (figure 4) while maintaining almost identical AUROC to UC (0.822 (0.794, 0.8)) (figure 3A). However, it did so by trading off error rates in opposite directions at the two thresholds, as described above (figure 3B). It also increased the magnitude of TCE at both thresholds (from 0.012 (0.006 to 0.019) to 0.033 (0.025 to 0.047) at t1 and from 0.006 (−0.013 to 0.023) to −0.236 (−0.335 to –0.129) at t2), and increased IGSD(TCE, t1) to 0.011 (from 0.004) and IGSD(TCE, t2) to 0.039 (from 0.016), implying that the scores generated by the EO model did not closely correspond to their calibrated values.
Discussion
We identified local calibration of 10-year ASCVD risk prediction models at guideline-recommended thresholds as necessary for fair shared decision-making about statin treatment between patients and physicians. We find that the rPCEs11 differ in local calibration between groups—making guideline-compatibility of rPCE inconsistent across groups. We note that global measurements of calibration, used previously to evaluate the PCEs,11 14 did not capture this difference, illustrating the importance of local calibration evaluation.
Recalibrating the model separately for each group increased compatibility with guidelines at low levels of risk, while increasing intergroup differences in error rates. Conversely, estimators learnt with an EO constraint would not be concordant with existing guidelines as a result of induced miscalibration. Thus, absent a contextual analysis, fairness approaches that focus on error rates can produce misleading results.
In our experiments, group-recalibration did not improve calibration at t=20%. This may be due to the small sample size of the recalibration set, as well as of individuals predicted to be at high risk. This suggests that group-recalibration may not always be desirable, especially if local calibration of the UC model is deemed acceptable. However, improvement in local calibration observed at t=7.5% may be more relevant than calibration at higher risk levels for informing statin initiation decisions, since benefits of treatment are clearer at higher-risk levels.
Several design choices may have impacted the results, including the use of a single model with race and sex as variables in the UC and EO models, the use of a logistic regression as a recalibration method, and the use of an in-processing method that focused on particular decision thresholds to impose EO. We anticipate that alternative modelling choices would impact the size of the observed effects, but would likely not change the conclusions, since known statistical tradeoffs exist between EO and calibration.18 21 22
Given this analysis, we recommend that developers building models for use with the ACC/AHA guidelines prioritise calibration across a relevant range of thresholds, and report group-stratified evaluation of local calibration alongside metrics of global fit. Before a model is deployed in a new setting, we recommend that it be evaluated on the target population, stratified by relevant groups—and group-recalibrated, if necessary. Knowledge about local miscalibration should also be incorporated into risk calculators to actively inform the physician-patient shared decision-making conversations, but should not replace recalibration efforts, since calibrated predictions are better suited for reasoning about potential consequences of treatment.10
Our analysis inherits the assumptions about relative importance of relevant risks and benefits used to derive therapeutic thresholds (online supplemental file C), which often fail to consider the impact of social determinants of health on treatment efficacy and of structural forms of discrimination in generating health disparities.28 Additionally, our use of self-identified racial categories—which can be understood as proxies for systemic and structural racist factors impacting health—may be inappropriate, potentially exacerbating historical racial biases and disparities in the clinical settings.29 30 Derivation of new risk prediction models may be necessary for multiethnic populations.12 Future work should explore decision analysis and modelling choices that incorporate this context.
Supplemental material
Conclusion
Our analysis is one of the first to consider algorithmic fairness in the context of clinical practice guidelines. It illustrates general principles that can be used to identify contextually relevant fairness evaluations of models used in clinical settings in the presence of clinical guidelines. Such analysis should include careful consideration of the interplay between model properties, model-guided treatment policy, as well as the potential harms and benefits of treatment, for each relevant subgroup. At the same time, we note that striving for model fairness is unlikely to be sufficient in addressing health inequities, especially when their sources lay upstream of the model-guided intervention, as is the case of structural racism.28 We encourage future work to situate fairness analyses in this broader context.
Supplemental material
Data availability statement
Data may be obtained from a third party and are not publicly available. The six data sets used: ARIC (Atherosclerosis Risk in Communities Study), CARDIA (Coronary Artery Risk Development in Young Adults Study), CHS (Cardiovascular Health Study, 1989–1999), FHS OS (Framingham Heart Study Offspring Cohort), MESA (Multi-Ethnic Study of Atherosclerosis) and JHS (Jackson Heart Study), are available on BioLINCC.
Ethics statements
Patient consent for publication
Ethics approval
This study does not involve human participants.
Acknowledgments
We thank Scotty Fleming, Alison Callahan, Sanjana Srivastava, Sherri Rose, Jonathan Lu, Ethan Steinberg, Yizhe Xu, Jennifer Wilson, Nikolaos Ignatiadis, Steve Yadlowsky and Julian Genkins for insightful comments and discussion. Approval for this non-human subjects research study is provided by the Stanford Institutional Review Board, protocol IRB-46829.
Supplementary materials
Supplementary Data
This web only file has been produced by the BMJ Publishing Group from an electronic file supplied by the author(s) and has not been edited for content.
Footnotes
Contributors AF and SRP conceived of the presented idea, and developed it with support from BP and NS. AF cleaned and preprocessed the data, trained predictive models, generated and analysed model evaluations. SRP provided code for training and evaluation and analysed model evaluations. AF drafted the manuscript, and revised it with SRP in consultation with BP and NS. NS supervised the project. AF is the guarantor of the project.
Funding This study was funded by Stanford University School of Medicine (Program for AI in Healthcare); National Heart, Lung, and Blood Institute (R01 HL144555).
Competing interests None declared.
Provenance and peer review Not commissioned; externally peer reviewed.
Supplemental material This content has been supplied by the author(s). It has not been vetted by BMJ Publishing Group Limited (BMJ) and may not have been peer-reviewed. Any opinions or recommendations discussed are solely those of the author(s) and are not endorsed by BMJ. BMJ disclaims all liability and responsibility arising from any reliance placed on the content. Where the content includes any translated material, BMJ does not warrant the accuracy and reliability of the translations (including but not limited to local regulations, clinical guidelines, terminology, drug names and drug dosages), and is not responsible for any error and/or omissions arising from translation and adaptation or otherwise.