Article Text

Abstract
Using administrative data on all Veterans who enter Department of Veterans Affairs (VA) medical centres throughout the USA, this paper uses artificial intelligence (AI) to predict mortality rates for patients with COVID-19 between March and August 2020. First, using comprehensive data on over 10 000 Veterans’ medical history, demographics and lab results, we estimate five AI models. Our XGBoost model performs the best, producing an area under the receive operator characteristics curve (AUROC) and area under the precision-recall curve of 0.87 and 0.41, respectively. We show how focusing on the performance of the AUROC alone can lead to unreliable models. Second, through a unique collaboration with the Washington D.C. VA medical centre, we develop a dashboard that incorporates these risk factors and the contributing sources of risk, which we deploy across local VA medical centres throughout the country. Our results provide a concrete example of how AI recommendations can be made explainable and practical for clinicians and their interactions with patients.
- COVID-19
- information science
- medical informatics
- patient care
Data availability statement
Data comes almost exclusively from the internal VA Corporate Data Warehouse (CDW) database and none of the information leaves the VA premises. This project has been completed in partnership between the National Artificial Intelligence Institute at the Department of Veterans Affairs and the local Washington DC VA medical center.
This is an open access article distributed in accordance with the Creative Commons Attribution Non Commercial (CC BY-NC 4.0) license, which permits others to distribute, remix, adapt, build upon this work non-commercially, and license their derivative works on different terms, provided the original work is properly cited, appropriate credit is given, any changes made indicated, and the use is non-commercial. See: http://creativecommons.org/licenses/by-nc/4.0/.
Statistics from Altmetric.com
Summary box
We build a model using artificial intelligence (AI) and machine learning (ML) techniques to predict mortality among all Veterans that have been in the Department of Veterans local medical centres between March and August 2020.
Our preferred model achieves a 0.87 area under the the receiver operator characteristics curve and an area under the precision-recall curve of 0.41.
In addition to age, our model reveals that an individual’s labs and vitals are significant predictors of mortality, followed by medical history.
We pilot our predictive model by creating a platform for clinicians across local VA centres that produces individual-specific risk scores for their patients, thereby allowing clinicians to offer more tailored treatment plans for patients.
Our paper suggests that artificial intelligence has the potential to substantially improve clinical experiences and patient outcomes, but the artificial intelligence-driven results must be accessible, interpretable and actionable.
Introduction
The recent COVID-19 pandemic represents the largest global shock to health and economic systems in at least a century, leading to significant declines in economic activity,1 2 mortality3 and well-being.4 These patterns and the resulting aftershock have led to a surge in research activity to generate risk profiles to understand how individuals and communities might be heterogeneously exposed to the virus.5 6 However, researchers have struggled to obtain bias-free, reliable, and externally-valid predictions on representative datasets.7
The primary contribution of this paper is to develop a reliable predictive model for understanding mortality rates among Veterans and to take these predictions to practice by creating an accessible and informative dashboard that clinicians can use to improve their treatment of patients. Motivated by an increasing recognition that socio-economic factors are important for understanding health and well-being8–10 and race,11 we draw on administrative data from the Department of Veterans Affairs (VA) and estimate a series of artificial intelligence (AI) models that incorporate medical history, demographics, and lab results for over 10 000 Veterans. Others have emphasised the role of other comorbidities, like asthma, as risk factors for COVID-19,12 but none have integrated all these factors together, particularly in a representative sample or full population.
We obtain an area under the receive operator characteristics curve (AUROC) and area under the precision-recall curve (AUPRC) of 0.87 and 0.41, as well as F1 and recall scores of 0.40 and 0.76. We decompose the contribution of each feature, identifying a handful of vital signs and lab indicators that matter even more than age in predicting mortality. While age alone helps obtain ‘reasonable’ AUROC scores, we show that these results are an artefact of the nature of an imbalanced dataset where mortality rates are low. Furthermore, we find that models with age alone produce high AUROC scores, but low AUPRC scores. The inclusion of chronic and acute medical conditions helps, but the F1 and recall scores do not rise to much until we introduce vital and lab indicators. Through a unique partnership with the Washington D.C. VA medical centre, we subsequently create a dashboard that uses our preferred predictive model to provide clinicians with personal risk scores for each patient and the leading indicators that are driving the score. Importantly, these risk scores enumerate the primary contributing factors so that clinicians are provided with not only actionable information, but also context over the logic behind the score. We are piloting the dashboard and making it available across local VA medical centres, which is a general contribution that extends even beyond the Veterans context.
Our paper contributes to a timely research agenda on the effects of COVID-19 and the identification of individuals who are more exposed to it than others. For example, age has emerged as one of the most important comorbidities.13 14 However, we show that age alone does a poor job in producing robust predictions. Because COVID-19 mortality rates are low to begin with, and most datasets are fairly imbalanced, it is easy to obtain a reasonable AUROC with a weak predictive model simply by producing many true negatives. Moreover, we show that there is a lot of heterogeneity even within age brackets, which could be a function of social capital within the local community or other preventative health measures.15
We also join a broader literature that embeds AI into tools for clinicians, including predictive tools for viral pneumonia and even secure analytics platforms, as in the case of OpenSAFELY that covers over 17 million adults in the UK to estimate hazard models as a function of comorbidities and other demographic characteristics.16 ,12 The VA has been a pioneer in creating COVID-19 models. For example, Osborne et al17 construct a care assessment need (CAN) score that is correlated with COVID-19 outcomes, showing that patients with a higher CAN also had a higher risk of COVID-19 infection and death. Similarly, King et al18 estimate the probability of mortality as a function of demographic and medical characteristics. We use AI to estimate the risk factors and optimizing for multiple performance metrics. We also include variables from operational services that are typically available to clinicians. In addition, we create a dashboard to facilitate trustworthy AI by making the risk factor easily accessible and interpretable for clinicians, among others, consistent with the recent principles around trustworthy AI.19
To our knowledge, we are the first to create and deploy an AI-driven tool to enhance clinicians’ treatment of patients. To the extent that clinicians can obtain reliable predictions of individual health risks, then they can provide more tailored treatments and better monitoring of patients during their visits in the hospital. We are working to deploy these predictions across medical centres, together with a simple heuristic that flags patients as low, medium and high risk based on whether our classifier predicts a probability of death in the top, middle or bottom percentile of the mortality distribution. While our focus is on Veterans, our results generalise to broader contexts since there is overlap in the distribution of covariates between Veterans and non-Veterans (eg, age, education, race).
Traditional measures of health among Veterans focus on physical conditions obtained from, for example, a combination of medical history and demographic factors.20 These factors are important since they may influence individuals’ predisposition to certain ailments.21 For example, especially with the recent COVID-19 pandemic, age has emerged as one of the most important individual-level predictors of infection risk and mortality.5 6 However, researchers have struggled to obtain bias-free, reliable and externally-valid predictions on representative datasets.7
On top of these individual-level characteristics that serve as important mediating characteristics in the ongoing pandemic, there is also an increasing recognition that geographic factors matter for understanding variation in healthcare utilisation. For example, differences in life expectancy vary significantly across commuting zones, although the dispersion is smaller in higher income areas.22 Moreover, confidence in healthcare systems and their ability to care for the needs of their communities varies across metropolitan areas.23
However, while there is a general understanding that demographics play a role in understanding differences in physical and mental health among individuals, including Veterans, there is also an increasing recognition that social determinants are potentially even more important.24 25 ,26 This comes at a time when new data is becoming available. For example, recent work provides a methodology for mining electronic health record (EHR) textual data to detect the presence of homelessness and adverse childhood experiences as predictive factors behind individual health.10 Unstructured data can provide valuable information about Veteran experiences, allowing researchers to map qualitative information about experiences into comparable indices.
There is also substantial evidence of geographic differences in life expectancy and mortality outcomes. For example, life expectancy is closely related with individual income and these outcomes also vary across geographies with different average incomes, suggesting that local health- care resources may play a role for explaining differences in mortality across space.22 Moreover, specifically for Veterans, there are large differences in utilisation rates of healthcare services across space, at least in part because of the composition of practices among VA medical professionals at a local level.27 Additional research also explores how sociodemographic factors help explain differences in COVID-19 deaths across local VA medical centres.28
Methods
The data we use for model training and evaluation come from the EHR at the Department of Veterans Affairs Health Administration (VHA). To develop an ML algorithm capable of predicting mortality within a 30-day window of infection, we analyse patient data from the EHR in the VA Corporate Data Warehouse (CDW). Specifically, we analyse data consisting of of patient demographics, International Classification of Diseases (ICD) Diagnosis codes, blood work and vital signs of patients infected with SARS CoV-2. Our training sample consisted of 11 097 (1294 deceased) treated for COVID-19 from 2 March through 3 August 2020. Before dropping observations with over 25% missing, we have 129 station and 32 706 patients whereas when we drop those with over 25% missing, we have 124 patients and and 11 962 patients. A second validation sample consisting of 1634 (128 deceased) patients treated from 4 August through 24 August 2020 was held out to assess model performance on data that is unbiased from the model training process. Laboratory results indicating positive detection of SARS CoV-2 were used as criteria for infection.
In an effort to create the most predictive model possible, we use the date of positive SARS CoV-2 PCR specimen collection as our chronological reference point for analysis and model training. Variables analysed fall within the following broad categories: patient demographics, comorbidities, chronic acute conditions, laboratory pathology and vital sign values. Several comorbidities are indicative of the mortality window for with patients SARS CoV-2. One distinguishable characteristic among patients that experienced mortality was a higher number of comorbidities. To summarise the level of multimorbidity in patients, we used the Quan-Elixhauser Mortality Index as a variable.29 30
We also experiment with data from the Census Bureau’s 5-year American Community Survey from 2014 to 2018. The Census provides a wide array of demographic characteristics at county or state level, including: the race distribution, the population density, the share male, the age distribution (the share under age 18, age 25–44, age 45–64 and 65+), the share married, the education distribution (the share with less than a high school degree, some college, and college or more), the income distribution (the share with less than US$15 000, US$15–29 000, US$30–39 000, US$40–49 000, US$50–59 000, US$60–99 000, US$100–1 49 000, over US$150 000), and the poverty rate (the share of people living in poverty under age 18, age 18–64 and 65+). However, after controlling for our individual characteristics, these location characteristics do not improve the model performance. While our prior work has found that these characteristics matter for predicting cross-sectional differences in mortality and infections,31 our individual-level characteristics in the VA data subsume the zipcode characteristics since they are more granular.
We use the following variables in our predictive models:
Patient demographics: the latest available observations up until the point of SARS CoV-2 lab specimen collection, including: age, race, ethnicity and marital status.
Comorbidities: Elixhauser Mortality Score was derived from patient ICD 10 diagnosis codes. These codes were derived from clinical encounters, active problems, inpatient and outpatient billing records ranging back 7 years from date of the patients first positive SARS CoV-2 laboratory test.
Chronic and other disease history: comprehensive groups were formed using the same set of ICD 10 diagnosis codes for comorbidities to represent certain diseases: dementia, gait and mobility issues, atherosclerosis, prostate problems, hypertension, hyperlipidaemia, anaemia, diabetes and chronic obstructive pulmonary disease (COPD).
Acute conditions: a second set of ICD 10 codes extrapolated from active problems and encounters was used to code for acute conditions 3 days prior and up to the date of first positive SARS CoV-2 lab: encounter for palliative care, do not resuscitate, hypoxia, pneumonia, respiratory failure, kidney failure, acute respiratory distress syndrome, cardiac arrest and sepsis.
Lab work: pathology components from the date of the patients first positive SARS CoV- 2 Lab were analysed: erythrocyte mean corpuscular volume fL, erythrocyte sedimentation rate mm/hour, lactate mmol/L, bilirubin—total mg/dL, D-dimer ng/mL, white blood cell count K/cmm, platelets 10*9/L, lactate dehydrogenase U/L, lymphocytes, C reactive protein mg/dL, CO2—partial pressure mm Hg, PO2 mm Hg, red blood cell count M/cmm, lymphocytes, ferritin ng/mL, urea nitrogen mg/dL and albumin g/dL.
Vital signs: vital signs from the date of the patients first positive SARS CoV-2 lab were analysed: blood pressure, pulse, temperature, respiration, height, weight, body mass index, pulse oximetry and fraction of inspired oxygen (FIO2).
Table 1 documents the summary statistics for these characteristics separately for patients who recovered and those who died. Consistent with prior literature, we see stark differences in age between those who recovered and those who died: a mean (median) of 62 (64) years old versus 77 (75), respectively. We see greater dispersion in age among those who recovered (SD of 15 vs 10). We also observe substantial differences among a handful of other lab results, including: lymphocytes, urea nitrogen, platelets, D-dimer, and, perhaps most importantly, the Elix Mortality Score. For example, given that lymphocytes are the B and T cells that help fight infection, it is not surprising that we find that patients who recovered have roughly 43% higher counts than those who died.
Descriptive statistics for recovered and deceased patients
For model calibration, we use five-fold cross validation AUPRC mean scores for hyper-parameter optimisation. We also bootstrap the training dataset using five-fold cross validation AUROC, F1 and recall mean scores. After model calibration, we evaluate performance on the validation dataset using four metrics: AUROC, AUPRC, F1 and recall scores. We include recall as a primary evaluation metric to see how well the classifier identifies the positive class, that is, mortality in concordance with other metrics that assess overall classification performance.
Our selection of these models was based off of two priorities. First, we require a probabilistic model—that is, one that produces predicted probabilities when fed a vector of 0/1 values. This is useful from an operational standpoint. Users of the model using can adjust the probability threshold for the outcome of mortality to meet their operational needs. For example, consider a Primary Care clinic that uses the model to decide which patients require additional follow- up after diagnosis. If the clinic wants to be more cautious, clinicians can lower the probability threshold. Second, we desire explainability—that is, results that are interpretable and actionable for clinicians. We limit our pool of prospective algorithms to those that could be explained with weights given to each input, allowing us to rank the importance of different features for clinicians. There is a growing recognition that AI must be explainable for it to have the greatest impact and adoption across organisations.32
For all evaluated models excluding XGBoost, missing values were imputed using a K-nearest neighbours (KNN) method. To mitigate the effects of data sparsity biasing our models, observations missing less than 25% of their dependent variables were dropped from both training and evaluation datasets. While there is no perfect way to deal with missing data, one of the desirable features of XGBoost is its built-in support for sparsity. When decision tree nodes are constructed during the training process, optimal traversal pathways are decided for both for non-missing and missing values.33 Other models require dense datasets, forcing users to either to drop observations or impute missing values. To compare the performance of XGBoost native support for data sparsity, we evaluate two XGBoost models: one trained and evaluated using KNN imputation and one without.
Results
There has been a proliferation of studies evaluating risk factors behind COVID-19 infections and mortality.7 Many of these studies have assessed their performance based only on the AUROC. However, looking solely at the AUROC can lead to misleading inferences and weak predictive models since infection, as well as mortality, is so rare, meaning that over predicts negative rates will actually boost the AUROC.
In particular, we found that using the AUROC as a primary evaluation metric on imbalanced class datasets produced models with low sensitivity at the default probability rate (0.5). Furthermore, lowering the probability threshold revealed that these models performed very poorly along both sensitivity and specificity. We discovered that, in order to develop a model that is both accurate and captures a greater number of true positives, we applied a broader set of metrics, namely the AUPRC. Nonetheless, figure 1 reports the AUROC, which is 0.87—a score in line with many prior studies.

Department of Veterans Affairs. The figure plots the area under the receiver operator characteristics curve for mortality as the outcome variable using XGBoost.
Of all the models analysed, the XGBoost decision tree ensemble using sparse datasets performed best. Using bootstrapping and five-fold cross validation this model achieved a mean AUROC score of 0.87 (0.86 to 0.88 95% CI), a mean F1 score of 0.49 (0.48 to 0.59 95% CI) and a mean recall score of 0.73 (0.7 to 0.76 95% CI). On the validation dataset, the XGBoost model achieved a 0.87 AUROC score, a 0.41 AUPRC, an F1 score of 0.40 and recall score of 0.11. Figure 2 presents these performance metrics. Part of the reason the performance does not differ much across the different models stems from the fact that we are working with a small sample. A growing literature from computer science suggests that the gains of sophisticated AI models are realised in larger datasets.
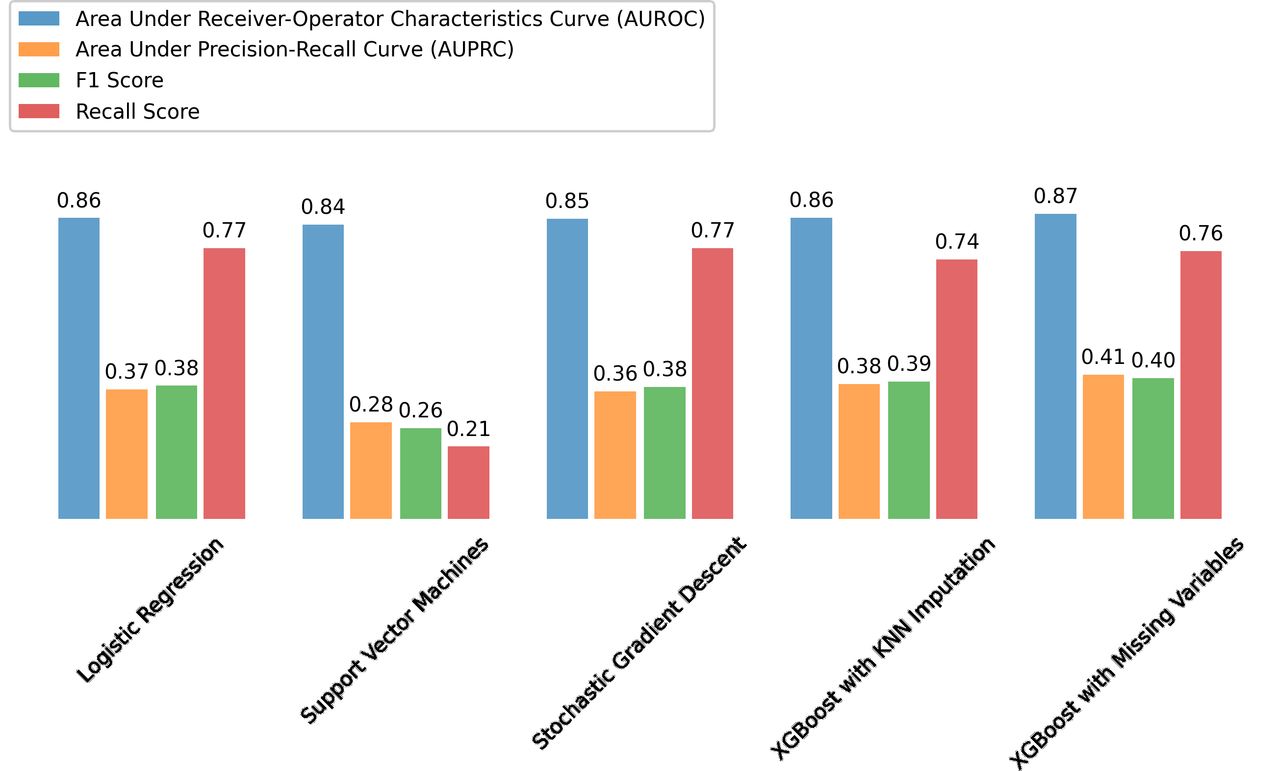
Department of Veterans Affairs. The figure reports the area under the receiver operator characteristics curve (AUROC), area under the precision recall curve (AUPRC), the F1 score, and the recallscore all using different modeling strategies. Recall is equal to the ratio of true positives to the sum of true positives and false negatives. Precision is equal to the ratio of true positives to the sum of true positives and false positives. The F1 score is equal to 2*(Recall * Precision) / (Recall + Precision).
Given that the specific algorithm that we use to predict mortality does not have a large quantitative effect on model quality, we now explore the role of different features as predictive characteristics in figure 3. While the AUROC is highly similar across specifications, the other performance metrics, such as F1 and recall scores, differ significantly. Importantly, since a high AUROC can be obtained in an unbalanced dataset whenever the algorithm produces low probabilities, then we might find an artificially high AUROC. In other words, we may produce a lot of true negatives, which lead to high sensitivity scores, but at the expense of true positives.
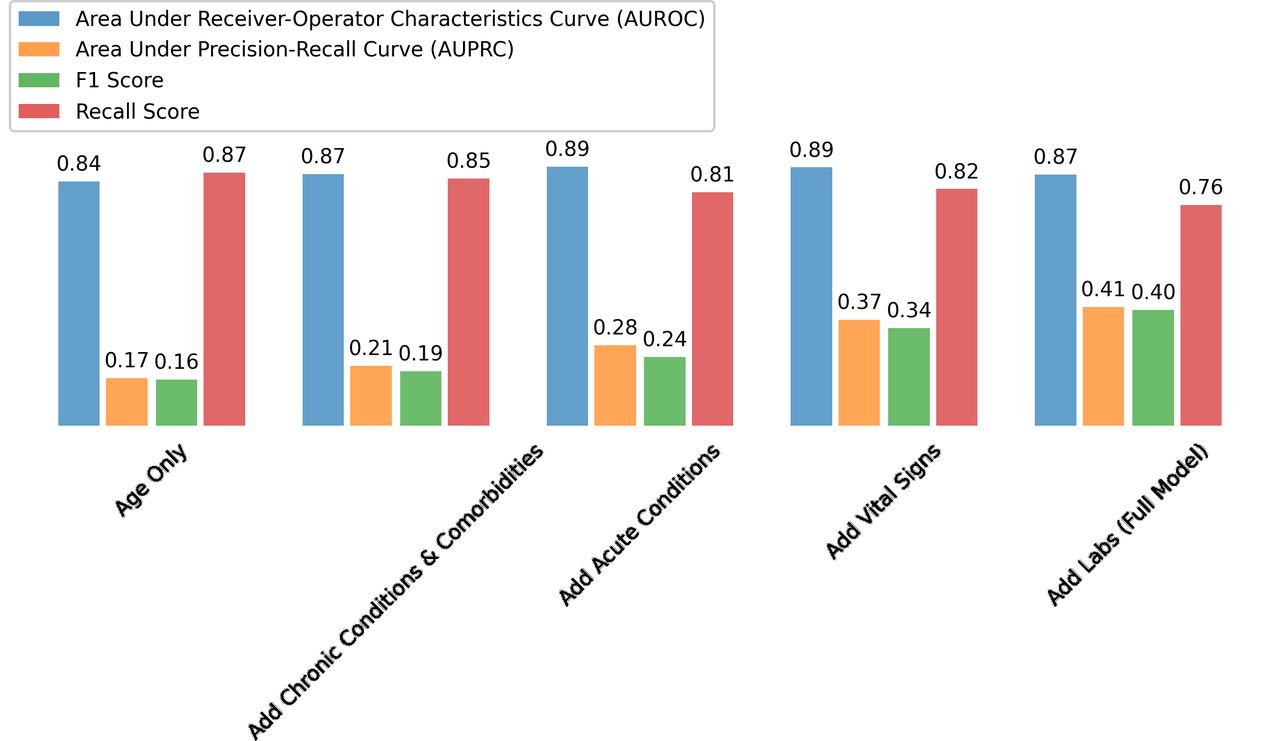
Department of Veterans Affairs. The figure reports the area under the receiver operator characteristics curve (AUROC), area under the precision recall curve (AUPRC), the F1 score, and the recallscore all using different features as predictive characteristics. Recall is equal to the ratio of true positives tothe sum of true positives and false negatives. Precision is equal to the ratio of true positives to the sum oftrue positives and false positives. The F1 score is equal to 2*(Recall *Precision) / (Recall + Precision).
While some models yielded slightly higher recall scores at the default probability threshold (0.5), XGBoost performed better on all other metrics. Figure 3 summarises the ROC at various probability thresholds. If users of this model wish to be more cautious, they can simply choose a lower probability threshold at the expense of a higher false-positive rate. At each probability threshold, the table displays the sensitivity (true-positive rate) and specificity (true-negative rate) achieved on the validation dataset. To provide greater insight into the results from our XGBoost model, Figure 4 plots the decision tree and the resulting probabilities at each node. This algorithm is of the family of ensemble learning techniques and is based on the famous Random Forest algorithm. The term ensemble learning is used to describe a powerful machine learning method in which multiple machine learning models are used for prediction.
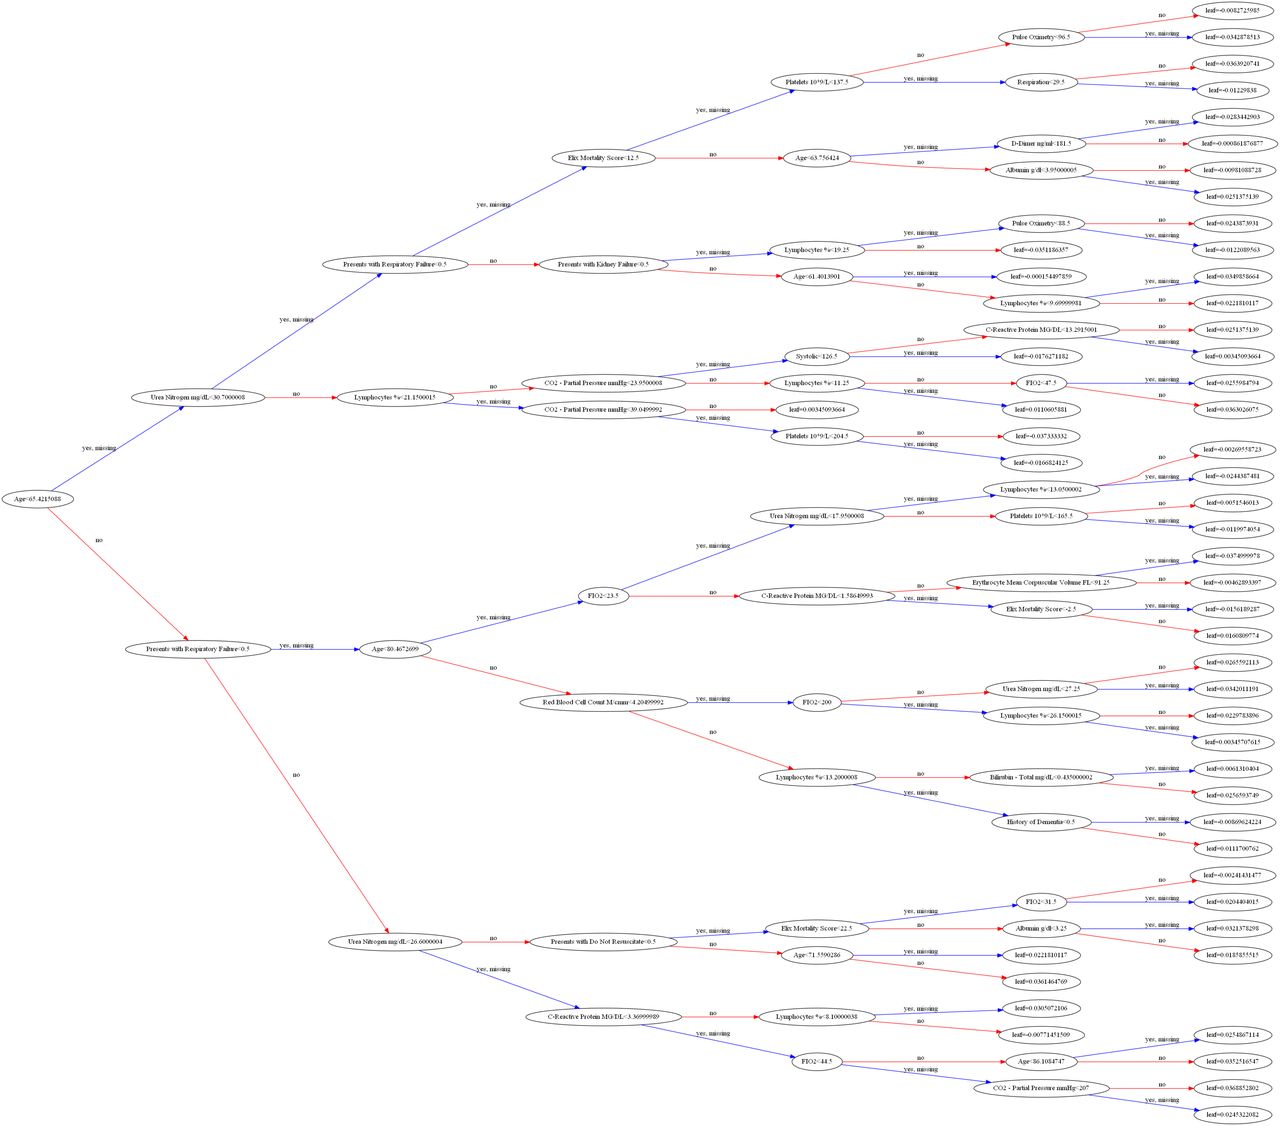
Department of Veterans Affairs. The figure plots the tree for our mortality outcomes using all the variables that were embedded in the model.
Furthermore, figure 5 ranks the features, by importance, as predictors of mortality outcomes using the F score. Consistent with prior literature, age ranks as the top comorbidity, followed by lymphocytes, C-reactive protein, urea nitrogen, platelets, FIO2, red blood cell count, enthrocyte mean corpuscular, and D-dimer. These are all intuitive characteristics that would enter into the risk factor. For example, since lymphocytes are the B and T cells that help fight infection, they can decrease during viral diseases. Similarly, platelets allow blood to clot and can decrease with viral infection.
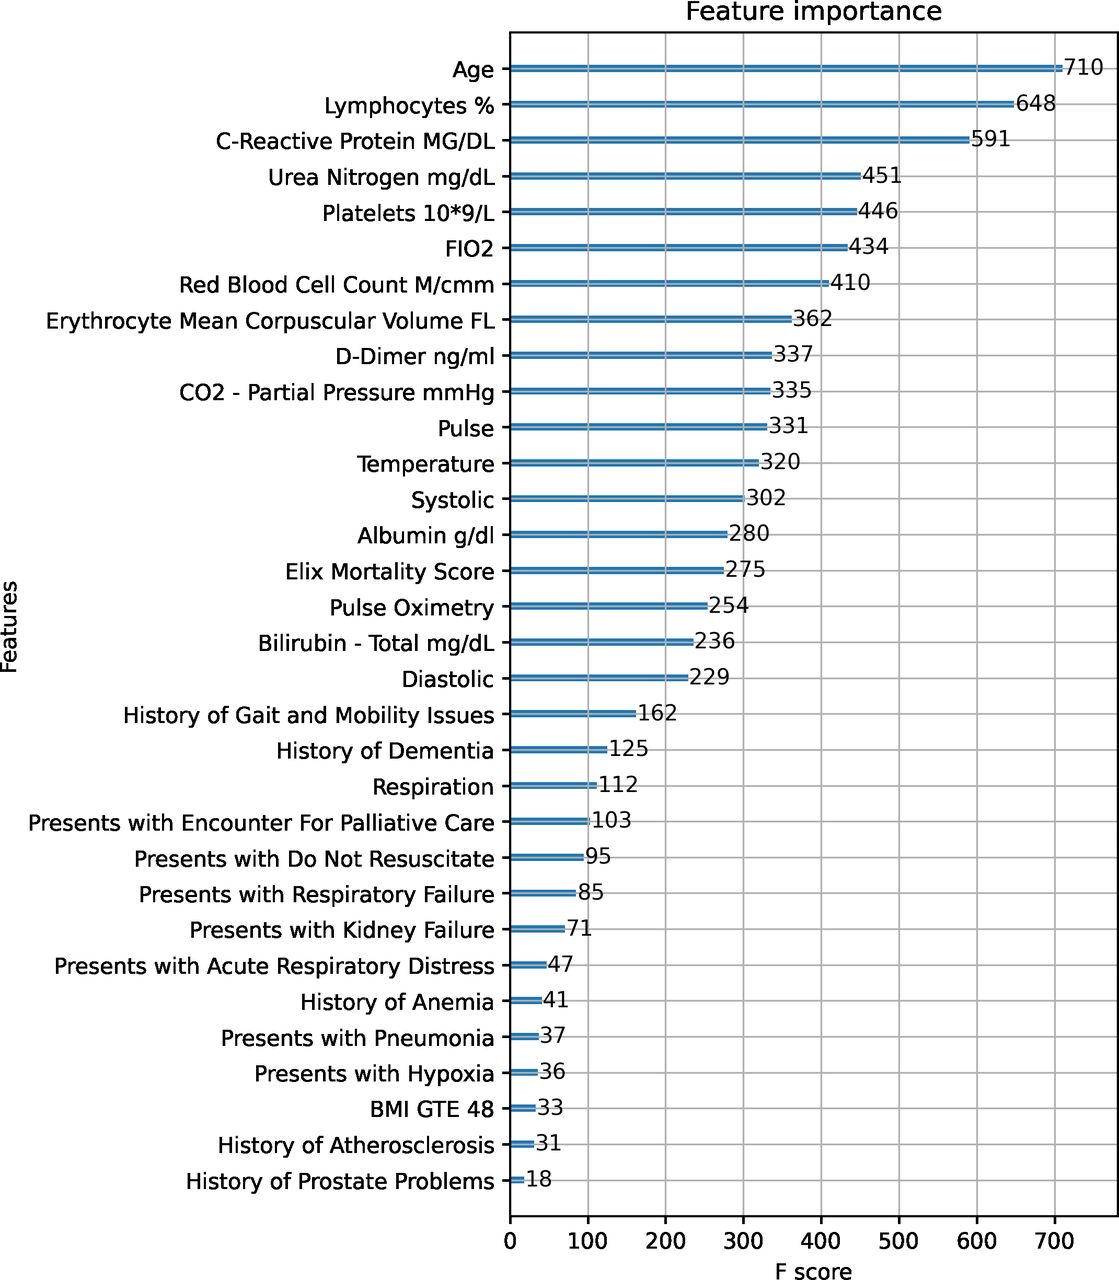
Department of Veterans Affairs. The figure reports the most important features from the estimation of XG Boost using the F score as the metric. BMI, body mass index.
Consider, for example, the AUROC with only age vs the full model, which contains medical conditions, vital signs, and labs. While the AUROC between the two are nearly identical (0.84 vs 0.87), the full model has a substantially higher AUPRC, F1 score, and recall score. For example, the AUPRC and F1 score grow from 0.17 and 0.16 to 0.41 and 0.40, respectively, which is over a two-times order of magnitude increase. We focus on not only who dies (ie, sensitivity=true positives / (true positives+false negatives), but also who recovers (ie, true negatives=true negatives / (true negatives+false positives). The inclusion of chronic conditions, and to a larger extent acute conditions, helps increase the performance of the model, the inclusion of vital signs and labs are the features that improve the model the most. Given that many of the studies in this emerging literature on COVID-19 have focused on AUROC as a metric for evaluating model performance, we view our broader set of metrics as not only a form of model validation, but also a contribution in and of itself for obtaining more reliable predictions.
While there is no strict AUROC and AUPRC threshold for defining reliable models, it is important to focus on the AUPRC in settings with an imbalanced dataset.34 For example, here we have a small share of patients who died from COVID-19, which puts the AUPRC in perspective, since they show the number of true positives among positive predictions. In this sense, given a mortality rate of 0.043, the baseline AUPRC is 4.43%, so our actual AUPRC of 0.41 is well above what a classifier would predict randomly. Moreover, to better understand the quality of our predictions, figure 6 plots the distribution of the risk factors (eg, convalescence and mortality) across patients with the associated CI. Although we see significant dispersion in the risk factors, the CIs are still fairly narrow, suggesting that these predictions have been reliably estimated.

Department of Veterans Affairs. The figure reports the distribution of our predicted risk factor and convalescence with their associated confidence intervals.
Discussion with clinical applications
In addition to creating a predictive model for understanding the role of different comorbidities and obtaining predicted probabilities for mortality, we also create an operational tool that aids in point of care decision-making for treating patients afflicted with SARS CoV-2. We pilot our 30-day mortality model in a PowerBI dashboard available to VA clinicians, built using data from the VA CDW. The dashboard is refreshed daily and uses well-established security practices to keep patient data safe and ensure that information is limited to users’ local VA facility. Figure 7 provides a spatial illustration of the VA medical facilities, weighted by the number of patients, across the USA.
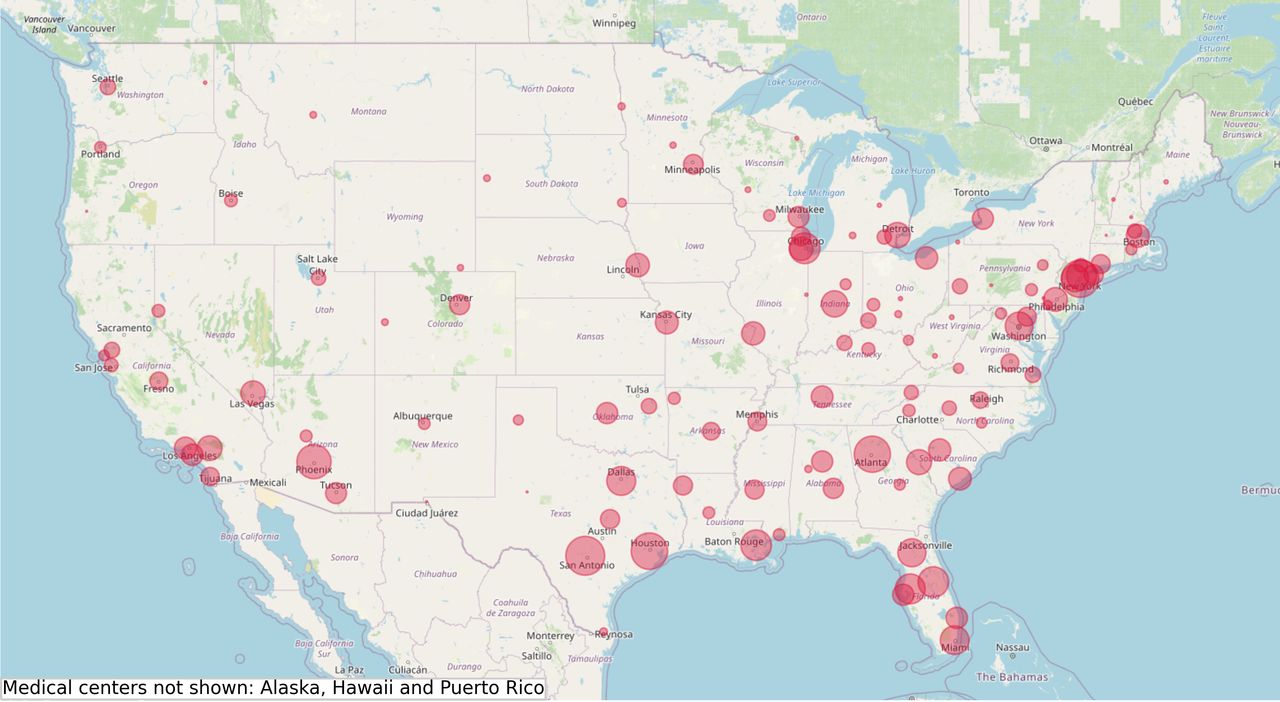
VA medical center facilities in the USA.
The dashboard has two views: one for primary care and another for inpatient care providers. The primary care view allows primary care teams to filter the datasets by patient provider, track COVID-19 testing and view mortality risk scores which are the probabilities generated by the model. For in-patient providers, they can filter the inpatient dataset by specialty and hospital location. These features are embedded so that the AI-driven tool adheres to the principles of trustworthy AI, particularly as they apply to Veterans,19 namely with a clear purpose (i.e., informing clinicians about the mortality risk of patients), with reliability and accuracy (i.e., reporting performance metrics), and with understandable and actionable analytics (i.e., enumerating the primary factors behind the patient’s risk factor).
Figure 8 presents visuals of these dashboards.
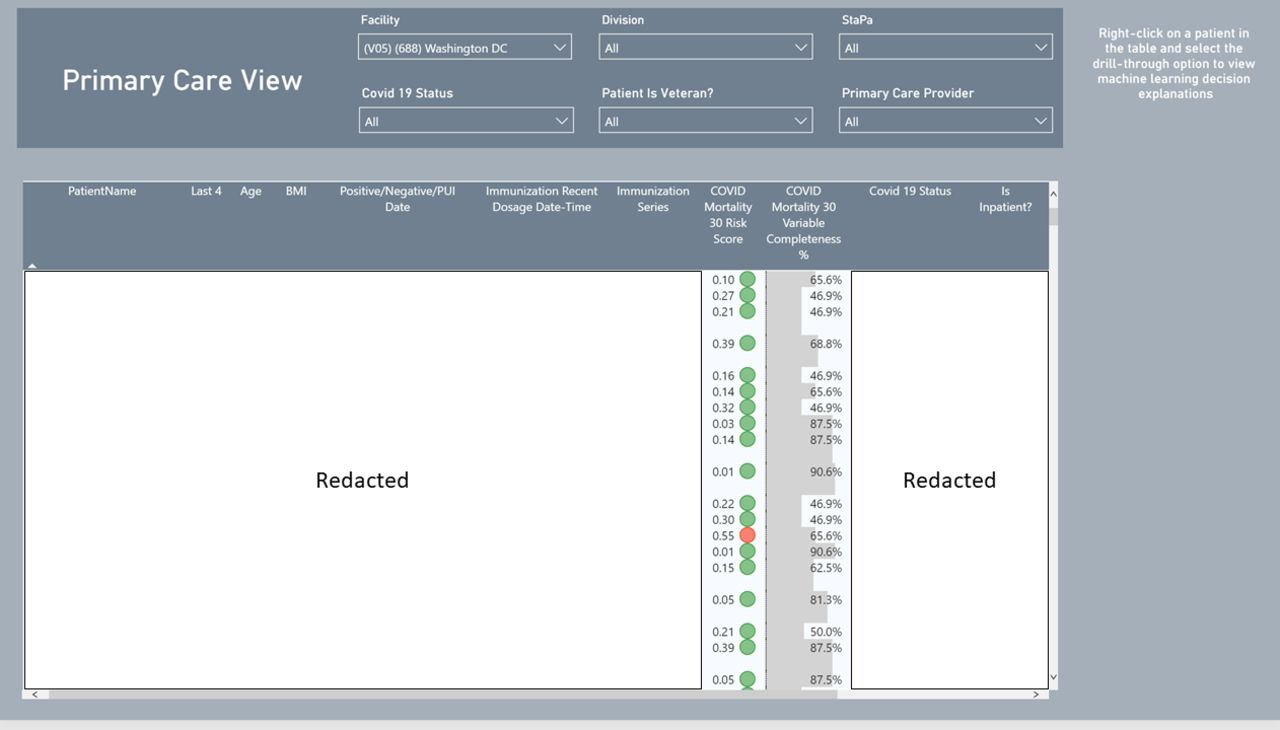
Primary care and in-patient views for mortality predictions.
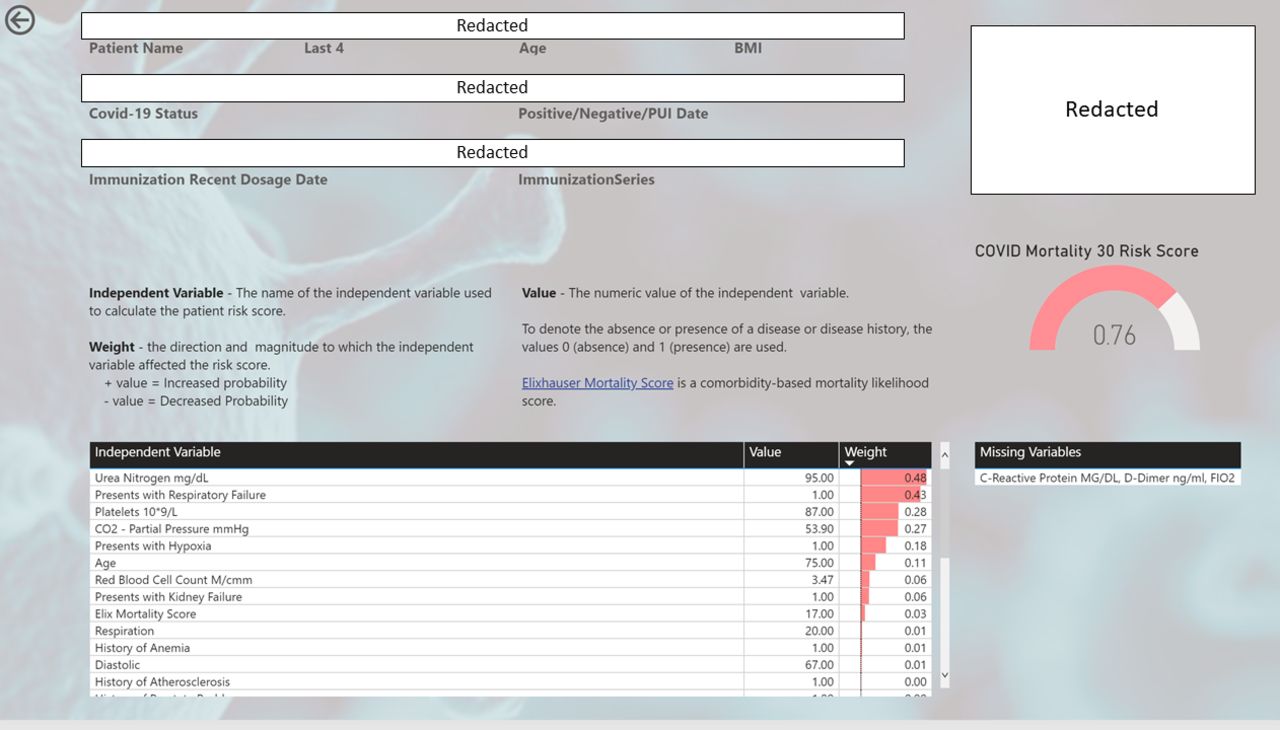
One of the most useful features of our dashboard is that providers do not have to take the risk scores at face value. They can search for a view that presents model inputs, variable weights, as well as a list of missing inputs. If they are want to learn more about a patient, they can order labs and/or obtain vital signs from the missing values list to obtain more accurate mortality risk assessments. Model weights are Shapley’s Additive Explanations (SHAP) values. SHAP is a game theoretical approach to explain the output of machine learning models.35 SHAP values allow users of our dashboard to see the direction and magnitude to which each variable input affects the patient’s risk score. Figure 9 plots a visual for the risk factor layout of the dashboard.

Risk factors for mortality predictions.
This view provides explains how the model arrived at its concluded risk score to clinicians. The table displays each dependent variable input used by the XGBoost model to derive the individual’s risk score. The ‘Feature’ column is the dependent variable name, the ‘Explanation’ column is the weight that is, the direction and magnitude that the input effected the risk score, and the ‘Value column is the numeric value of the dependent variable. Positive explanation values imply that the input increased the risk score and negative values imply the inverse.
While our tool helps clinicians improve their treatment of patients and guide them to the most pressing risk factors, we recognise that the tool has at least two limitations. First, it is not meant to tell clinicians what to do: our AI is designed to augment clinician responsibilities, not replace them. Second, since the tool provides a list of important determinants of the risk factor, the clinician is called to think about potential explanations behind the phenomena that they observe with the patient. In this sense, the AI is designed to help consolidate data and draw out the clinician’s knowledge and expertise to drive better patient outcomes.
Conclusion
While there is already a large literature exploring the contributions of demographic factors and pre-existing conditions to COVID-19, there is little empirical evidence on the role that sociodemographic factors play within a community. This paper draws on administrative data from the Department of VA and each of their medical centres to estimate predictive models for mortality as a function of individual demographic characteristics, medical history, and labs and vitals for every Veteran under the VA’s care.
Our model performs well on not only the conventional AUROC metric, but also other metrics, such as the AUPRC, F1 score and recall score. We show that these metrics are important for producing reliable predictive models since the mortality rate for COVID-19 is so low, meaning that models tuned to maximise the AUROC are likely to produce many false positives.
Using our new predictive model, we develop and implement a dashboard for clinical application in the District of Columbia VA medical centre. Our dashboard provides clinicians with not only the medical history and demographic characteristics of patients, but also risk factors that incorporate the results of our predictive models. In particular, we use our estimated models, together with the individual-level characteristics, to generate personalised predicted probabilities that the individual will experience acute hospitalisation and mortality, which we flag for the clinicians to help them maximise the odds for a successful recovery by the patient.
Our results open up a number of interesting avenues. Most importantly, we are in the process of piloting our clinical diagnostic tool with more medical centres with an intent in gauging the effectiveness of the instrument and identifying ways of improving it. We are also interested in extending the tool into other conditions and viruses; COVID-19 is simply on specific application. Moreover, we believe that there is significant value in a ‘learning healthcare system’ where medical centres prototype different tools, pool their combined knowledge, and iterate over quality improvements for the purpose of driving better health outcomes for their patients.
Other information
This work was supported by the Department of VA Office of Research & Development. Apart from the data on demographic characteristics, which are publicly available from the Census Bureau, the administrative data on Veterans and their medical information is restricted to the Department of VA.
Christos A. Makridis contributed to the design, writing and editing of the paper. Tim Strebel contributed to the analysis. Vince Marconi contributed to the editing of the paper. Gil Alterovitz contributed to the design and editing of the paper.
Data availability statement
Data comes almost exclusively from the internal VA Corporate Data Warehouse (CDW) database and none of the information leaves the VA premises. This project has been completed in partnership between the National Artificial Intelligence Institute at the Department of Veterans Affairs and the local Washington DC VA medical center.
Ethics statements
References
Footnotes
Contributors CM contribute to the design, writing and editing of the paper. TS contributed to the analysis. VM contributed to the editing of the paper. GA contributed to the design and editing of the paper.
Funding This work was supported by the Department of Veterans Affairs. Apart from the data on demographic characteristics, which are publicly available from the Census Bureau, is restricted to the Department of Veterans Affairs. Christos Makridis contributed to the design, writing, and editing of the paper. Tim Strebel contributed to the analysis. Vince Marconi contributed to the editing of the paper. Gil Alterovitz contributed to the design and editing of the paper.
Map disclaimer The depiction of boundaries on this map does not imply the expression of any opinion whatsoever on the part of BMJ (or any member of its group) concerning the legal status of any country, territory, jurisdiction or area or of its authorities. This map is provided without any warranty of any kind, either express or implied.
Competing interests None declared.
Provenance and peer review Not commissioned; externally peer reviewed.