Article Text

Abstract
Background Diabetes affects 30.3 million people in the USA. Among these people, a major risk factor for microvascular complications is having a glycated haemoglobin (HbA1c) value of ≥75 mmol/mol; therefore, it would be helpful to identify patients who will obtain future HbA1c values of <75 mmol/mol.
Objectives To develop and validate two prediction rules among patients with diabetes having a baseline HbA1c value of ≥75 mmol/mol: (1) HbA1c measurement ever <75 mmol/mol and (2) final HbA1c measurement of <75 mmol/mol.
Methods Retrospective cohort study using a registry extracting data from the Department of Veterans Affairs’s (VA’s) electronic health records system. Baseline was 1 Jul 2013–30 June 2014; patients were followed up until 31 July 2016.
Results Our population consisted of 145 659 patients. Across models, predictors were age, sex, minority status, baseline HbA1c value, time, HbA1c≥75 mmol/mol, receiving insulin treatment and consecutive number of HbA1c values of 75 mmol/mol. The overall likelihood of a patient ever having an HbA1c<75 mmol/mol was 73.65%; with the rule, predicted probabilities were 38.94%, 50.75% and 78.88%. The overall likelihood of patients having a final HbA1c measurement of <75 mmol/mol was 55.35%; the rule provided predicted probabilities of 29.93%, 50.17% and 68.58%.
Conclusions Within each rule, there were similar observed and predicted tertile probabilities; maintaining HbA1c values of <75 mmol/mol resulted in probability shifts in the majority of patients. We recommend psychosocial screening for 15% of patients for whom there is less than one-third chance of maintaining HbA1c<75 mmol/mol. We plan to conduct additional research to see whether this approach helps.
- information management
- medical informatics
- patient care
- primary healthcare
This is an open access article distributed in accordance with the Creative Commons Attribution Non Commercial (CC BY-NC 4.0) license, which permits others to distribute, remix, adapt, build upon this work non-commercially, and license their derivative works on different terms, provided the original work is properly cited, appropriate credit is given, any changes made indicated, and the use is non-commercial. See: http://creativecommons.org/licenses/by-nc/4.0/.
Statistics from Altmetric.com
Summary
What is already known?
Primary care providers (PCPs) are overwhelmed and have little to no patient-specific information about the likelihood of success of a treatment decision.
Identifying patients with diabetes and HbA1c ≥75 mmol/mol with higher probability of ever attaining a value of <75 mmol/mol, as well as those with higher probability of maintaining HbA1c values of <75 mmol/mol through 2 years of follow-up could provide a risk stratification method that targets care intensification to inform resource allocation.
What does this paper add?
The prediction rule indicates substantial shifts in probability tertiles from overall likelihood, as well as close alignment between observed and predicted probabilities.
Resource allocation efforts should be redirected for the 15% of patients with approximately one-third chance of maintaining HbA1c values of <75 mmol/mol using the approach employed by PCPs.
Introduction
Diabetes mellitus is an epidemic affecting 30.3 million people in the USA in 2015; the Department of Veterans Affairs (VA) has almost three times the prevalence of diabetes compared with the general US population, at approximately 25% and 75 mmol/mol, respectively.1 2 Glycaemic control is known to reduce microvascular complication risk for these patients.1 For instance, investigators from the UK Prospective Diabetes Study found participants with glycated haemoglobin (HbA1c) values of 75–86 mmol/mol had twice the incidence of microvascular events compared with participants with values of 64–75 mmol/mol.3 The American Diabetes Association (ADA) guidelines recommending HbA1c<64 mmol/mol in most patients underscore that those with an HbA1c≥75 mmol/mol are at greatly increased risk.4 Unfortunately, many patients remain above this.
Primary care has always been charged with balancing the patient’s acute care issues with chronic diseases despite the acute issue frequently being the cause of the clinic visit.5 As such, a substantial proportion of medication regimens and blood draws for HbA1c occur in the primary care environment. In the USA, the VA is the largest healthcare provider and has the most integrated electronic health record (EHR) system.6 In the current state of patient care in the VA, the primary care providers (PCPs) have little to no patient-specific information about the likelihood of success of a treatment decision. For instance, although intended to help, clinical reminders are non-specific. Estimated at approximately 60 per day, this information overload has been shown to contribute to overlooking results, leading to delayed patient care.7 8
Prediction rules could be incorporated into already-existing tools to simplify the clinical cognitive load by pointing to the care most likely to provide the best outcome, at that time in that particular patient. Through longitudinal analysis of patient data, these prediction algorithms can provide population health information about patients who were in the same circumstance as the current patient–provider interaction, contributing to the National Academy of Medicine’s concept of the learning healthcare organisation.9 Identifying patients with diabetes and HbA1c≥75 mmol/mol with higher probability of ever attaining a value <75 mmol/mol, as well as those with higher probability of maintaining HbA1c values of <75 mmol/mol through 2 years of follow-up could provide a risk stratification method targeting care intensification to inform resource allocation. The success of this strategy is dependent on models that accurately discriminate between patients who will have subsequent HbA1c values of <75 mmol/mol and those who will not. Based on a review of the literature, it appears only one other group has developed a prediction rule for HbA1c among patients with diabetes. We sought out to develop and validate each prediction rule by randomly assigning patients to derivation and validation samples. Validation samples are used to confirm model fit based on the derivation sample for each of the outcomes.
Methods
Data source and study design
This is a retrospective cohort study using a registry extracting data from VA’s EHR system. In particular, after obtaining the New Mexico VA Healthcare System Institutional Review Board’s approval, we used the VA Informatics and Computing Infrastructure to obtain files pertaining to a cohort of patients from the VA national databases housed at the Corporate Data Warehouse. The VA provides inpatient and outpatient care at 1243 healthcare facilities across the USA. Our population was defined as patients who had an HbA1c≥75 mmol/mol between 1 July 2013 and 30 June 2014 with either an inpatient or outpatient diagnosis of diabetes mellitus or a prescription for diabetes medication. We followed up patients for HbA1c values until 31 July 2016.
Selection of candidate predictor variables
Candidate predictor variables included age, self-declared minority status (including race and ethnicity), sex and insulin treatment status. Age was included since islet cell function declines with time, impacting glycaemic status; self-declared minority status was included because minorities have been shown to have poorer glycaemic control. Sex was included to further represent the diverse population and may confound if not included. The pathophysiology of diabetes, like many chronic diseases, is associated with cumulative disease burden. Accordingly, we also captured HbA1c progression over time, starting with similar thinking as in the Archimedes diabetes model.10 We further refined HbA1c measurement into innovative synthesised variables; the following paragraph explains these in order of time frame, starting with the longest.
Fundamentally, an average over a series of HbA1c measurements has bias because of differences in monitoring frequency: according to the guidelines, patients are expected to have had blood drawn twice annually when their glucose is controlled and up to quarterly when their glucose is not.11 12 A way to handle this is with time-weighted average HbA1c, which starts from first documentation, as early as 1999. This value will be missing when a patient’s first measurement is the qualifying value for the study because its calculation is dependent on more than one measurement before follow-up starts. Traits such as genetics, personality and culture may be conceptualised as contributing to this variable since patients are born with, nurtured and socialised into these potential factors from an early age, reinforcing a pattern reflected over a long period of time. Candidate predictor variables of a more intermediate duration include time HbA1c≥75 mmol/mol, consecutive number of HbA1c values of ≥75 mmol/mol and number of PCP visits while the patient had an HbA1c≥75 mmol/mol. Collectively, this set of variables may represent comorbidities such as obesity, post-traumatic stress disorder, depression and alcoholism. Lastly, we are interested in the current clinical picture. To this end, we assessed the most recent HbA1c value (baseline HbA1c), which reflects current diet, exercise, medication regimen and any recent change in health status. The same candidate predictor variables were used in each regression analysis.
Statistical analysis
Appropriate univariate analyses were performed based on the underlying distribution of variables. Separate stepwise forward logistic regression models were created for each outcome: (1) HbA1c measurement ever <75 mmol/mol and (2) final HbA1c measurement of <75 mmol/mol. The p value to enter the model was set to p<0.05; p value for removal from the model was set to p<0.10. Overall model performance was evaluated through χ2 and pseudo-R2 values, calibration was assessed with the Hosmer-Lemeshow test, and discrimination was assessed with the c-statistic, equal to the receiver operating characteristic curve for dichotomous outcomes.13 The investigators also assessed the sensitivity, specificity, positive predictive value and negative predictive value. All hypothesis testing was two-sided; STATA/MP V.14.2 was used for all analyses.
Results
General findings
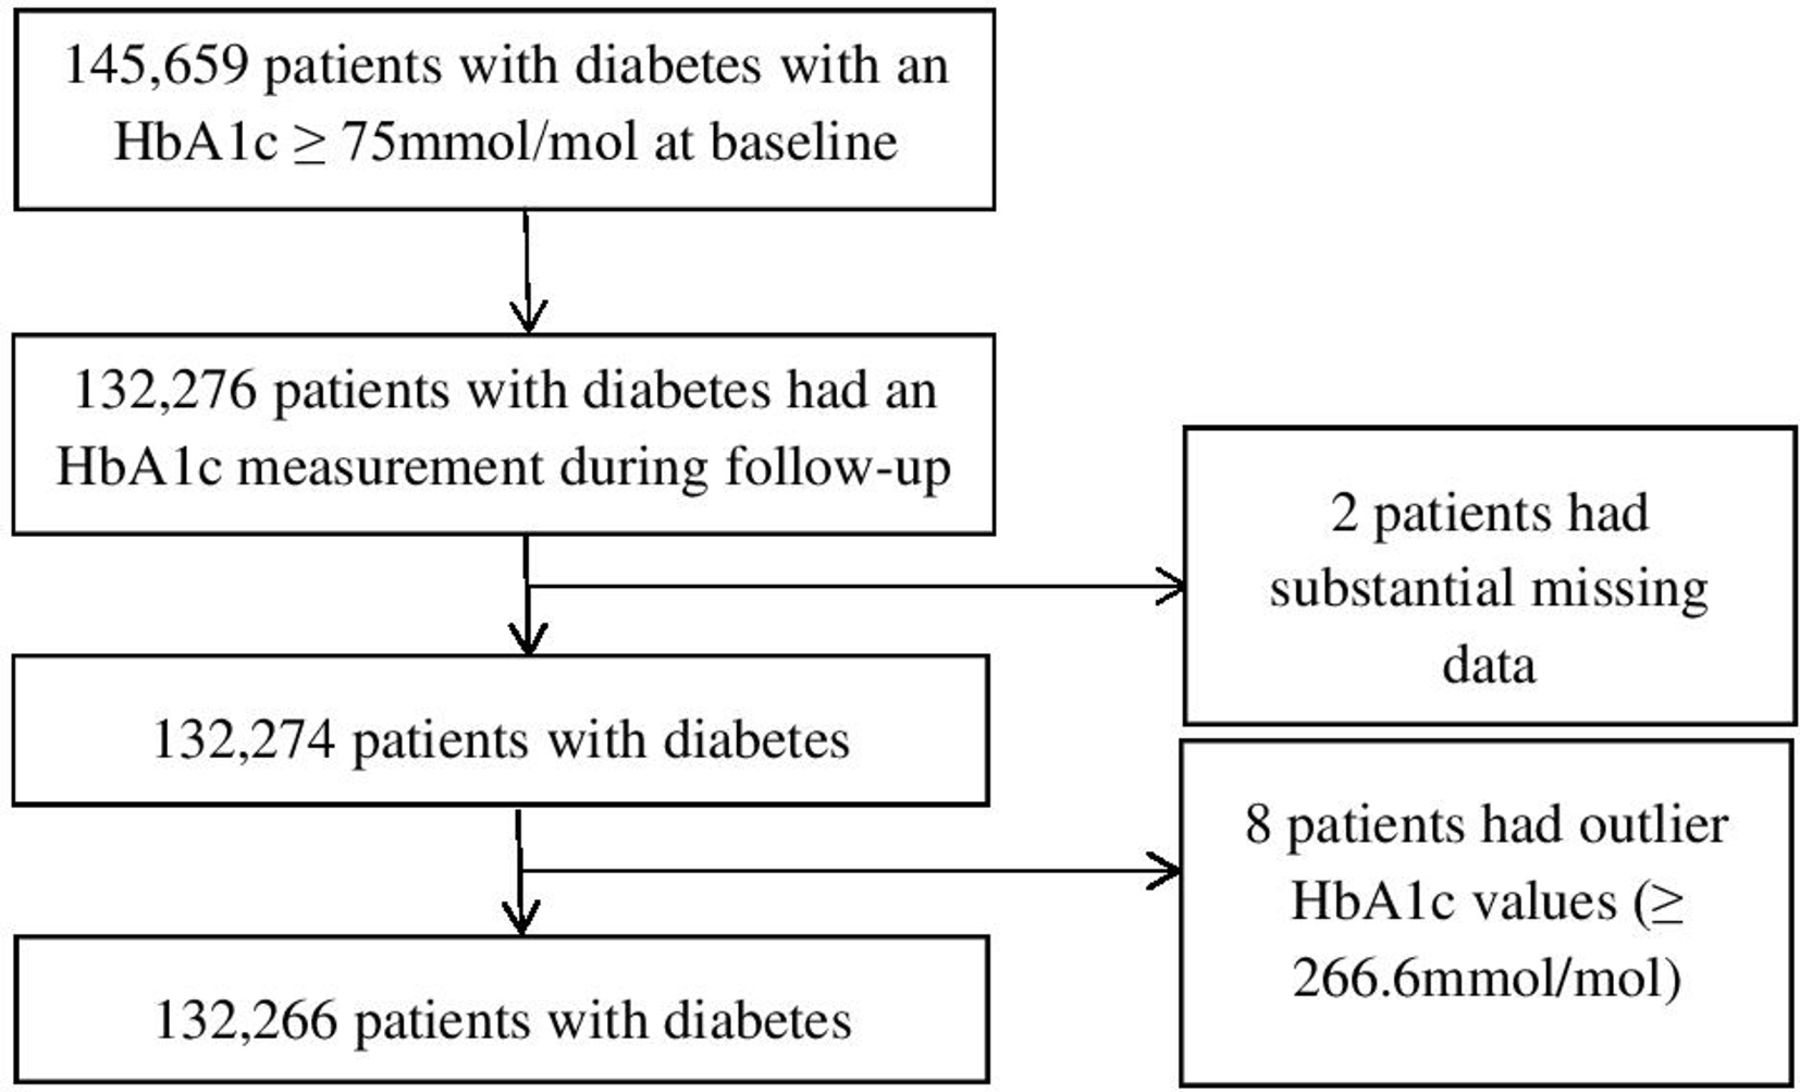
Our population consisted of 145 659 patients; 90.81% were retained. Figure 1 depicts the population of interest and resultant patient flow. Baseline characteristics of the derivation and validation samples are provided in table 1.
Baseline characteristics of the derivation and validation samples
Patient flowchart. HbA1c, glycated haemoglobin.
The derivation sample comprised 80 435 patients followed up for a mean±SD of 1.76±0.46 years. The validation sample had 51 831 patients followed for 1.75±0.46 years. All univariate analyses of candidate predictor variables were significant for each outcome, in each sample (p<0.001 each, data not shown).
Patients ever attaining an HbA1c<75 mmol/mol in follow-up
The logistic regression model yielded 77 602 patients in the derivation dataset and 49 429 patients in the validation set: patients who were not included had missing values in the time-weighted average HbA1c. Except for number of PCP visits while the patient had an HbA1c≥75 mmol/mol, candidate predictor variables had enough of an independent effect to enter and remain in the model. Patients who were older, male and declared minority status had higher odds of ever having an HbA1c<75 mmol/mol; patients with higher baseline HbA1c values, longer times with HbA1c≥75 mmol/mol, higher time-weighted HbA1c averages and more consecutive HbA1c values≥75 mmol/mol at baseline, and who underwent insulin treatment had lower odds (table 2).
Multivariate logistic regression results for HbA1c ever <75 mmol/mol and final HbA1c measurement <75 mmol/mol
The model resulted in a pseudo-R2=0.10 with a likelihood ratio=9134.21 (χ2(8), p<0.0001), a Hosmer-Lemeshow test (χ2(8)=401.42, p<0.001) and a c-statistic=0.72. The model’s sensitivity is 94.73%; specificity is 20.52%; positive predictive value is 76.63%; and negative predictive value is 58.58%, resulting in 74.95% correctly classified. Using the validation sample, the predicted probabilities compared with the observed are quite accurate within each probability tertile (table 3).
Observed versus predicted probability for HbA1c measurement ever <75 mmol/mol
Patients with a final HbA1c measurement of <75 mmol/mol in follow-up
The logistic regression model incorporated variables with no missing observations; the same candidate predictor variables were significant as the first outcome except for time-weighted average HbA1c. Patients who were older and male had higher odds of a final HbA1c measurement <75 mmol/mol; patients with higher baseline HbA1c values, longer times with HbA1c≥75 mmol/mol, more consecutive HbA1c values≥75 mmol/mol at baseline and declared minority status, and who received insulin treatment had lower odds (table 2). The model has a pseudo-R2=0.06 with a likelihood ratio=7001.50 (χ2(7), p<0.001), a Hosmer-Lemeshow test (χ2(8)=112.84, p<0.001) and a c-statistic=0.67. Model sensitivity is 80.64%; specificity is 42.30%; positive predictive value is 63.18%; and negative predictive value is 64.01%, resulting in 63.44% correctly classified. Using the validation sample, the predicted probabilities are fairly accurate for patients when comparing predicted probabilities to observations within each of the probability tertiles (table 4).
Observed versus predicted probability for final HbA1c measurement of <75 mmol/mol
Discussion
This study provides knowledge not otherwise obtainable about patients with diabetes. First, we were surprised that we identified only one other study that developed and/or validated a prediction rule related to HbA1c among patients with diabetes. Second, without the rule, the provider does not know a given patient’s likelihood of having an HbA1c<75 mmol/mol within or by the end of the next 2 years.
While sensitivity and specificity provide the probability of the model showing attainment of HbA1c<75 mmol/mol, or lack thereof, in a patient who has such a measurement, the predictive value provides the probability of actual attainment of HbA1c<75 mmol/mol, given the model showing, or not showing, such attainment. The potential contribution of these prediction rules to a learning healthcare organisation is dependent on accurate differentiation between patients who will, and will not, continue to have HbA1c measurements ≥of 75 mmol/mol. As seen in tables 3 and 4, the predicted probabilities compared with the observed are fairly accurate for each of the tertiles for each of the outcomes.
If aggregate data from the healthcare system were available to providers, they would know 55% of these patients maintain HbA1c values<75 mmol/mol at 2 years (ie, the pretest probability). The usefulness of a prediction rule is based on the proportion of patients whose probability has substantially shifted from the pretest probability. When predicting who will maintain HbA1c values of <75 mmol/mol, the majority of patients’ probabilities shifted. This did not occur for predicting who will ever have an HbA1c<75 mmol/mol; of the two, maintenance is more imperative clinically.
Most importantly, this rule identifies patients for whom an alternative approach is more appropriate. Resources should be reallocated for the 15% of patients with predicted probabilities of 0–0.4 and who are interested in meeting treatment goals: they have less than one-third chance of maintaining HbA1c values of <75 mmol/mol using the approach employed by PCPs (table 3). This implies a substantial shift in workload as it represents multiple visits currently occurring between PCPs and patients addressing treatment intensification. Our model suggests the presence of underlying drivers of poor glycaemic control that operate over the course of years. These factors may be psychosocial and should be addressed before such treatment is again attempted; our recommendation is psychosocial screening. In this way, patients are also being offered treatment intensification: once these issues have been addressed, they may be more likely to attain an HbA1c value of <75 mmol/mol.14 By identifying the problem from a population health perspective, we are recognising a gap in care and naturally risk-stratifying patients, so the greatest benefit goes to those with the most need, with the resources available. The application of this rule across the VA could result in reduced costs for diabetes care and increased costs for psychosocial support. Future studies should be done to identify such factors, assessing whether their management results in better outcomes than routine primary care.
When incorporated into our already-existing reporting mechanism, providers can receive the model results specific to each patient during, or in preparation of, the clinic visit. With these predictions, a provider can assess the patient’s values and motivation in treatment intensification. If interested, they can set a goal based on the patient’s age and comorbidities, discussing treatment options. If the patient is still above goal, then psychological, social and cultural assessment can be performed to identify treatment barriers. If psychological screening indicates a psychiatric or personality disorder or substance abuse, the provider should refer the patient to behavioural health. Alternatively, if social assessment indicates an occupational problem or homelessness, the provider should refer the patient to social service. If a cultural barrier is identified, the patient should be referred to a support group for culturally sensitive recommendations.
As evidenced by the models retaining time HbA1c≥75 mmol/mol, consecutive number of HbA1c values of ≥75 mmol/mol, baseline HbA1c value and receiving insulin treatment, it appears intermediate and short-term factors play an important part on whether a patient with an HbA1c≥75 mmol/mol will have subsequent HbA1c values of <75 mmol/mol. Fortunately, modifiable factors such as diet, exercise, treatment regimen and recent change in health status (eg, pneumonia) are captured among these, highlighting their importance. Since time-weighted average HbA1c entered the model predicting HbA1c measurement ever <75 mmol/mol, but not the model predicting final HbA1c measurement <75 mmol/mol, another predictor variable potentially is more statistically, but not clinically, significant. Also noteworthy, minority status changed directions across the models. Our cohort has 4738 (3.58%) patients whose qualifying HbA1c during baseline was their first documented HbA1c in the VA. Future studies should be conducted to further elucidate these relationships.
In our review of the literature, we found only one other paper reporting a prediction rule for HbA1c in patients with diabetes.15 Investigators of that study followed up 684 European patients with type 2 diabetes mellitus 12 months from clinical appointments; their dependent variable was ‘an observed increase in terms of HbA1c %≥0.5’. While we considered higher-risk patients to have baseline HbA1c≥75 mmol/mol, their patients had microvascular complications with a median (range) HbA1c of 55 mmol/mol (48–72 mmol/mol). The authors of that paper do not report sensitivity, specificity, positive predictive value or negative predictive value to allow comparison of model performance to ours.
Limitations
This study has several limitations. First, a significant Hosmer-Lemeshow indicates the potential presence of a systematic pattern of bias, such as model mis-specification; however, several criticisms exist about the Hosmer-Lemeshow test, including its use in large datasets as any small departure between observed and predicted frequencies is magnified.16 Although we do not know whether bias exists, a c-statistic is acceptable at the threshold of 0.7. Therefore, the c-statistics for each outcome indicate a satisfactory probability of correctly classifying a randomly selected pair of cases from those who did and did not attain HbA1c<75 mmol/mol. Second, although we have studied the population of patients with diabetes with an HbA1c≥75 mmol/mol, the findings may not reflect patients receiving care in other healthcare systems. For example, a comparison of demographics and health characteristics of the 2013 National Health Interview Survey suggested more similarity with VA patients and Medicare beneficiaries than patients with employer-based health insurance or Medicaid beneficiaries.17 Third, as with all secondary database analyses, the results depend on data entry of people independent of the study. To address this, the investigators applied clinical knowledge and understanding of the processes generating the data when dealing with issues of data integrity. Finally, no prediction rule should replace clinical judgement, especially when factors not available in a data source may play an important role. Rather, the findings are meant to inform the conversation between patient and provider. An improvement of this model can be the development of candidate predictor variables of modifiable patient characteristics. In particular, effects of various therapeutic classes will be helpful as the current ADA guidelines recommend many options, dependent on patient preferences and target HbA1c.4
Conclusions
Our project simultaneously addresses population health and patient-centred care. Similar observed and predicted tertile probabilities were found within each rule; the majority of patients experienced probability shifts for maintaining HbA1c values of <75 mmol/mol, showing its usefulness in a learning healthcare organisation. We recommend psychosocial screening for one in every seven patients for whom there is about one-third chance of maintaining HbA1c values of <75 mmol/mol. We plan to leverage the richness of the national databases while testing different aspects of the technology, including assessment of human factors, in a graduated manner before any intention of national implementation.
References
Footnotes
Contributors AM, GAC and GHM designed the research; HMC, AM and GHM performed the research; HMC, AM, GAC and GHM analysed the data; HMC, GAC and GHM wrote the manuscript.
Funding This research was supported by the Department of Veterans Affairs, Veterans Health Administration using resources and facilities at the New Mexico VA Health Care System, Raymond G. Murphy VA Medical Center, as well as the Department of Veterans Affairs, Veterans Health Administration, Office of Research and Development, Cooperative Studies Program using resources and facilities at the VA Cooperative Studies Program Clinical Research Pharmacy Coordinating Center. This support was necessary for the authors to design and conduct the study, interpret the data, draft and review the manuscript, and decide to submit. Drs Campbell (VA Cooperative Studies Program) and Murata (VA Cooperative Studies Program and New Mexico VA Health Care System) had full access to all the data in the study and take responsibility for the integrity of the data and the accuracy of the data analysis.
Disclaimer Contents are expressed by the authors and do not represent the views of the Department of Veterans Affairs or the United States Government.
Competing interests None declared.
Patient consent for publication Not required.
Provenance and peer review Not commissioned; externally peer reviewed.
Data availability statement No data are available. We conducted a secondary analysis of patient-specific data in VA’s EMR.