Article Text

Abstract
Background Clinic ‘no shows’ (NS) can be a burden on the healthcare system, and efforts to minimise them can reduce lost revenue and improve patient care. Leveraging a large data set via the electronic health record (EHR) has not been previously attempted to identify ‘high risk’ groups in paediatric orthopaedics.
Objective To use discrete data captured by the EHR system to identify predictors of non-attendance at paediatric orthopaedic outpatient appointments.
Methods Appointments from January 2014 to March 2016 were included. Variables included appointment status, age, gender, type of visit, payor type (government vs private insurance), distance of residence to clinic, region of residence, clinic location, clinic type, and appointment day of the week, hour and month. Classification and regression trees (CART) were constructed to identify predictors of NS.
Results 131 512 encounters were included, 15 543 of which were in the NS group (11.8%). CART identified three predictive covariates for NS: days in between scheduling and appointment, insurance type, and specific orthopaedic clinic type. The combination of covariates provided predictability of NS: if they had ≤38.5 days of waiting for appointment and had private insurance, the NS rate was 7.8% (the best result), compared with waiting >38.5 days for either a fracture or sports clinic, which had an NS rate of 29.3% (OR=4.9).
Conclusion Payor type and duration between scheduling and appointment may predict non-attendance at outpatient paediatric orthopaedic appointments. Although these findings allow for predicting and interventions for at-risk groups, even the best performing NS group occurred 7.8% of the time, highlighting the complexity of the NS phenomenon.
- record systems
- health care
This is an open access article distributed in accordance with the Creative Commons Attribution Non Commercial (CC BY-NC 4.0) license, which permits others to distribute, remix, adapt, build upon this work non-commercially, and license their derivative works on different terms, provided the original work is properly cited, appropriate credit is given, any changes made indicated, and the use is non-commercial. See: http://creativecommons.org/licenses/by-nc/4.0/.
Statistics from Altmetric.com
Summary
What is already known?
No-shows are a burden on the healthcare system as the workflow of a medical practice is detrimentally affected, reducing potential access for other patients and resulting in lost resources.
Non-surgical patients experience an increased rate of poor outcomes when they do not show up for their appointment.
For the surgical patient, a no-show visit disrupts the ability to modify the treatment plan during recovery.
What does this paper add?
Days in between scheduling and appointment was the most important predictor of no-shows, with a cut point of ≤38.5 days vs >38 days (approximately 5 weeks).
Insurance type was identified as a significant factor among encounters ≤38.5 days from scheduling (government vs private).
Clinic type was identified as a significant factor among encounters >38 days from scheduling.
Introduction
There are a number of well-documented consequences associated with a patient not showing up for their appointment. For the non-surgical patient, among other risks, there is an increased rate of poor outcomes.1 For the surgical patient, follow-up appointments allow the surgeon to monitor patient progress, and a no-show (NS) visit disrupts the ability to modify the treatment plan during recovery.2–4 Moreover, there is a burden on the healthcare system as the workflow of a medical practice is detrimentally affected, reducing potential access for other patients and resulting in lost resources.5 6 Past literature on this subject has drawn conclusions that suggest a myriad of factors contributing to the reasons why one patient becomes an NS and the other attends their visit.6–8
Existing studies have pointed to various potential risk factors for appointment non-attendance, which included transportation issues, number of chronic illnesses or severity of illness, time between scheduling and appointment, lack of reminders, perceived benefit, and socioeconomic status.9–17 The concern regarding NS patients in the paediatric orthopaedic clinic is significant because of the possibility of long-term detrimental outcomes related to growth plate pathology or potentially treatable musculoskeletal diseases that go untreated with risk for early adulthood debilitation. There are multiple studies that have documented this phenomenon of unchecked paediatric orthopaedic disease resulting in long-term consequences.18–21
With the advent of electronic health records (EHRs) and the rapid increase in utilisation of these systems, there has been an improvement in the platforms that allow for large data sets to be assessed and for reminders of appointments to be automated. The purposes of this study were to evaluate the NS rate in the paediatric orthopaedic population via EHR and to identify potential factors predictive of a higher NS rate in this new era.
Materials and methods
A member of the informatics team developed an SQL (structured query language) query to extract encounter data, filtered by visit type information, from the EHR reporting environment with random auditing of the resulting data to ensure accuracy. A contemporaneous time period was selected to minimise internal variations in clinic set-up and appointment protocols. Appointments from January 2014 to March 2016 were therefore included. The study was performed at a children’s hospital, so all visit types involved the spectrum of paediatric orthopaedics.
Encounter-level variables included the following: appointment status, child age, gender, type of visit, payor type, distance of residence to clinic, region of residence, clinic location (main campus or satellites), clinic type, duration from scheduling appointment to appointment date, and appointment day of the week, hour and month. The appointment status was defined as either completed, cancelled or no-show. Encounters categorised as NS or cancelled on the day of appointment were grouped into a single NS category and were compared with those who completed appointments.
The type of visits within the clinic set-up in the EHR included new patient, return patient, new to provider, procedure, preoperative, postoperative or nursing staff visit. The payor type was divided between ‘private’—HMO (Health Maintance Organization), PPO (preferred Provider Organization), HSA (Health Savings Account), FSA (Flexible Spending Account) and so on—or ‘government’ (state-sponsored) insurance, with military insurance being included in the ‘private’ payor cohort. Clinic type was defined by the intended purpose of the clinic: hip (HIP), spine/scoliosis (SPINE), sports medicine (SPORTS), clubfoot/congenital foot (CLUBFOOT), hand/brachial plexus (HAND), neuromuscular/cerebral palsy (CP), lower extremity alignment (LE ALIGN), ingrown toenail (TOE), early-onset scoliosis (EOS), general paediatric orthopaedic clinic without designation (ORTHO) or fracture (FX) clinics.
Statistical methods
Decision tree algorithm
The classification and regression tree (CART) function within SPSS V.24 was used to generate a decision tree predictive of NS events. This methodology allows for identification of predictor variables with the optimum cut points, as well as complex interactions among those predictors. This is a Bayesian-inspired methodology which uses machine learning to create predictive models. Recursive partitioning is used to identify optimal cut points for a predictive model within each partition. Complex interactions among predictor variables are also easily identified with this analysis. Hold-out validation was employed in order to validate on fully independent data, and thus the entire data set was split into two independent samples. The training set for the programme consisted of 50% of randomly selected cases of the data set, and the validation set was applied to the remaining 50% of cases. This method of training the CART allows for maximising the number of data points used to identify variables, while at the same time maximising the number of data points used to validate those identified data points. Any amount more or less than 50% of the entire data set would minimise either the training or the validating of the CART analysis.
Appointment status (0=completed appointment, 1=NS or same-day cancel) was entered as the dependent variable, and visit type, clinic location, clinic type, travel time to clinic, gender, patient age at time of appointment, month of appointment, day of week of appointment, days in between scheduling and appointment, and payor type (0=private, 1=government) were entered as independent (predictor) variables. The CART method uses binary recursive partitioning to identify variables that best predict the outcome and splits into child nodes according to a split criterion. The Gini split criterion was used in this study and the standard stopping criterion was selected, allowing for maximum tree depth of 5.
Binary logistic regression
For the entire cohort, the category or terminal node that each encounter belonged to according to the testing tree (of half the sample) was identified. The testing tree with its identified node categories was then assigned to the entire cohort, and a cross-tabulation table of NS versus completed events was constructed for each node. Binary logistic regression was performed in order to identify the OR of non-attendance rates for each category/node as compared with the category/node with the lowest non-attendance rate. Alpha for the regression was set at p<0.05.
Results
There were 131 512 encounters included in the analysis, 15 543 of which were in the NS group (11.8%). Descriptive statistics for the various potential predictor variables are seen in table 1.
Descriptive statistics for the potential predictor variables which were entered into the multivariate CART
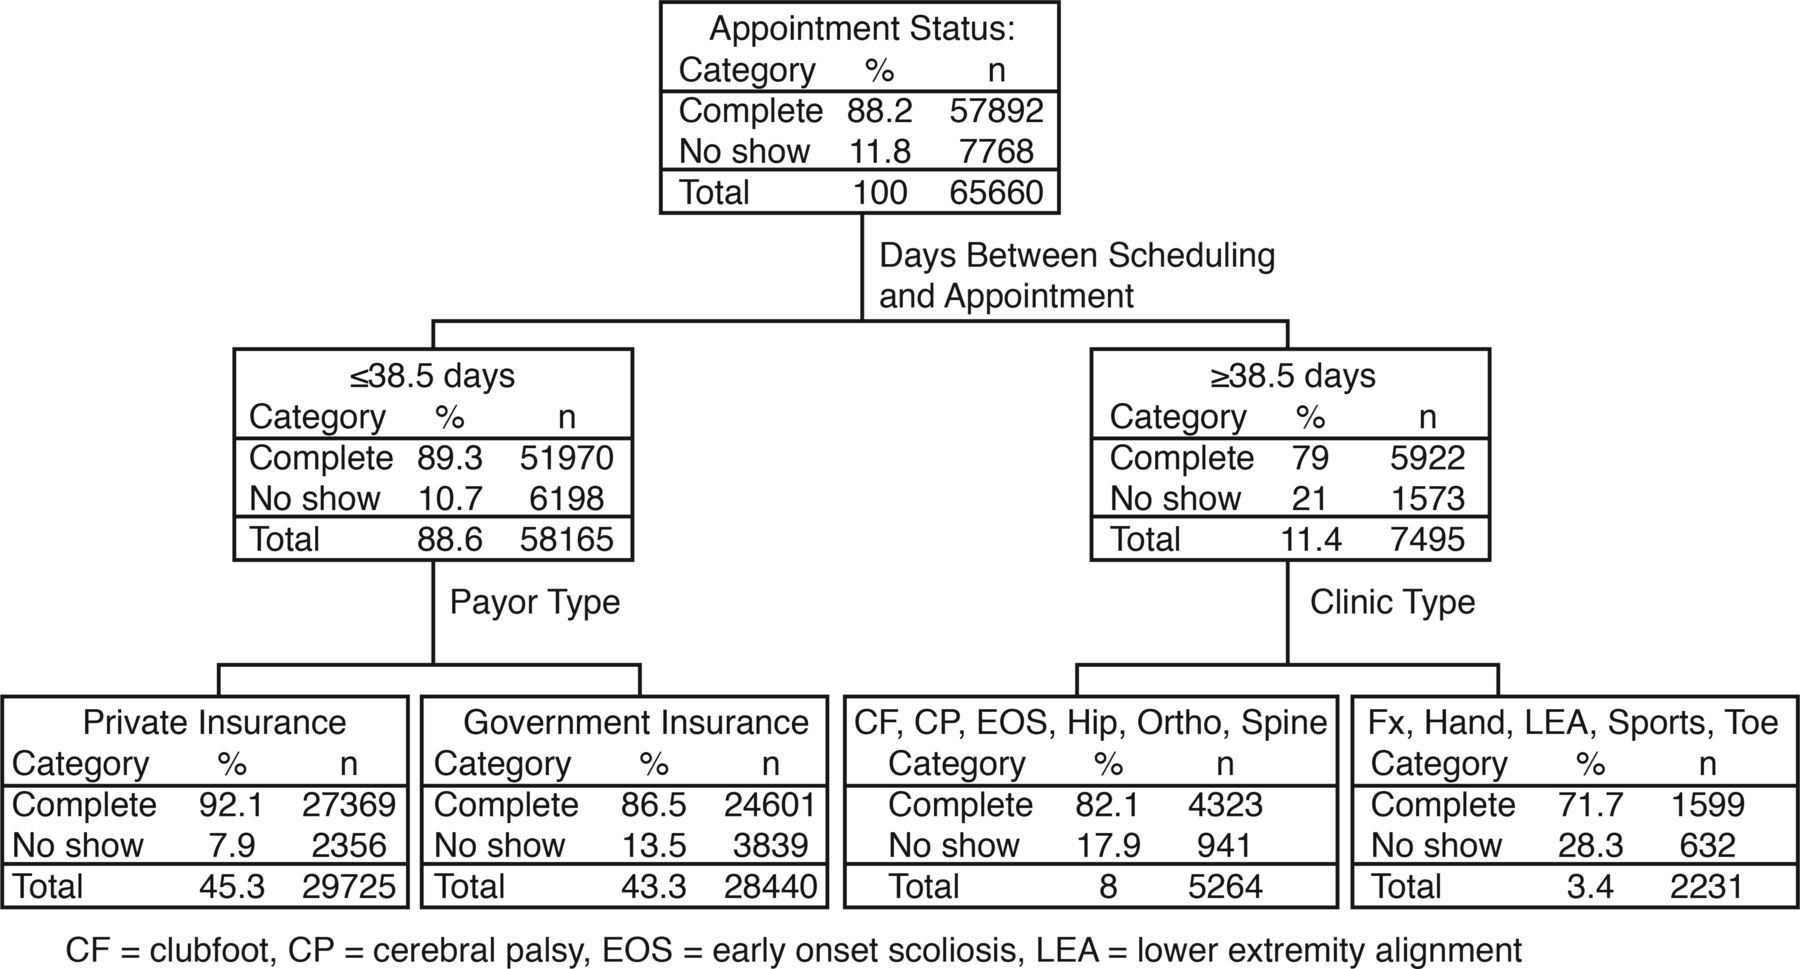
The CART resulted in four terminal nodes with three predictors (figure 1). The risk estimate for both the testing and training tree was 0.118 with an SE of 0.001. Days in between scheduling and appointment was the most important predictor, with a cut point of ≤38.5 days vs >38 days (approximately 5 weeks). Insurance type was identified as a significant factor among encounters ≤38.5 days from scheduling (government vs private). Next, clinic type was identified as a significant factor among encounters >38 days from scheduling.
Results of the testing tree from the CART analysis. CART, classification and regression tree; Fx, fracture.
The identified node categories of the entire cohort are presented with their cross-tabulations in table 2. The lowest NS rate identified among encounters scheduled within ≤38.5 of appointments and had private insurance was 7.8%. The rate of NS increased with the remaining nodes. Those with ≤38.5 scheduled days and government insurance demonstrated a 13.5% NS rate. CLUBFOOT, CP, EOS, HIP, ORTHO and SPINE clinics with >38.5 scheduled days had a 17.8% NS rate. Finally, in the FX, HAND, LE ALIGN, SPORTS and TOE clinics with >38.5 scheduled days, there was a 29.3% NS rate. Using the group with the lowest rate of NS as the reference category (<38.5 scheduled days, private insurance), the ORs were calculated for the subsequent categories and p values for those comparisons were reported (table 3).
Cross-tabulation table of complete versus no-show visit within the entire cohort using the predictors suggested by the training/testing trees of the CART
Summary of no-show rates and OR (with 95% CI) for each of the four suggested categories predictive of no-show events
Discussion
This large EHR database identified a relatively high overall rate of NS for the paediatric orthopaedic population, with 8.5 out of 100 patients missing their appointments. Days between scheduling and attending the visit, type of insurance payor, and the type of clinic all seem to have some predictive value in identifying potential families at risk for NS. These identified factors require further evaluation before appropriate interventions or quality programmes can be implemented.
There are no direct comparisons within the literature for paediatric orthopaedics because this type of analysis is relatively new and the techniques for improving patient care through EHR data sets are only newly evolving. However, the concept of ‘duration from scheduling an appointment to actually having the appointment’ being a predictable risk factor is not unheard of for the paediatric population.8 12 17 These studies also showed that the number of days between scheduling and next appointment was associated with a higher rate of NS. The underlying aetiology of this phenomenon may have many sources. These can include forgetfulness of the scheduled event, conflicting events for the families that trump clinic appointment priority or a change in the care plan of the child (families seeking earlier care at an outside orthopaedic/chiropractor office, urgent care or emergency department) without cancelling the scheduled visit. For paediatric orthopaedics, resolution of pain that drove scheduling the appointment in the first place can result in NS. Previous authors have documented factors related to increased time between events, such as transportation issues and absence of adequate reminder system for the appointment.9 22 The latter risk factor has been studied extensively and therefore has the most data available regarding causes and viable options to resolve NS. Research has demonstrated that there are a number of tools that can be used to mitigate this risk, including telephone reminders, social worker visits and focused efforts to provide appointments closer to the day of scheduling. These methodologies have demonstrated effectiveness in the previous publications outside paediatric orthopaedics.8 9 The data available to us through our EHR did not contain the details of transportation or the request for additional interim reminders of the pending appointment. However, regarding the potential to send families reminders of their pending appointment, we believe that the methodology used to improve the NS rate will likely require individualisation based on the following two discussion points: payor type and clinic type (patient type).
Our study demonstrated that the payor type also correlated with NS rates. Private insurance was found to have a 9% NS rate compared with 15% in patients with government/public insurance. Unlike time between appointment and scheduling, payor type is not a factor that clinics and healthcare providers can generally alter or affect. Therefore, efforts to improve NS rates associated with payor status are limited. The only potential way to improve care in this cohort is to identify if the underlying issue is related to delay in referral or delay in insurance approval via the government programme that lends to longer delays between scheduling an appointment and the scheduled date. There is the possibility of enacting a local hospital-wide programme to pay for certain payor types upfront, with a relative certainty of being reimbursed by the government programme. Such a programme has a high likelihood of being cumbersome and impractical given the NS rates and lack of immediate danger to paediatric orthopaedic NS patients. Otherwise, changes related to this issue would require global reform in government-provided insurance, rather than local hospital/provider practice initiatives, and therefore beyond the scope of this research. It is also unknown as to whether payor type served as a surrogate for socioeconomic status in our analysis. A study out of the UK, using the National Health Service, which is the predominant public health service in the UK, found a marker of socioeconomic status as one of their predictors of non-attendance.17
Finally, the general orthopaedic diagnosis for patients (clinic types) appears to play a role in predicting the risk for NS in the paediatric population. To our knowledge, no previous publications exist on this topic, and therefore no comparisons with past studies can be made regarding the breakdown of clinic type. Understanding why certain groups of paediatric orthopaedic patients have lower NS rates is a complicated matter. For example, when considering the nature of the SPINE and EOS clinics, one can make a few assumptions. One possibility is that parents tend to be very concerned about the spine and perhaps are more willing/able to remember a visit greater than 5 weeks out from scheduling when the reason is related to their child’s spine. However, it may also be related to the fact that many of our SPINE and EOS patients are followed for years (much like the CP and HIP patients) and therefore have more established care with our facility. Another possibility is that there is lower NS rate for those diseases that parents consider to be more ‘serious’ with higher potential for long-term complications. This would require further investigations into what parents consider to be more ‘serious’. These are all truly presumptions on why CLUBFOOT, CP, EOS, HIP, ORTHO and SPINE patients have less NS rates. When considering SPORTS, FX and TOE clinics, there are two potential primary explanations that may result in higher NS rates in these patients when they are scheduled greater than 5 weeks out. First, it may be that these are patients with an immediate need (whether real or perceived) and a clinic visit greater than 5 weeks away may be completely unacceptable to them. They may switch providers or visit an urgent care or emergency department to obtain earlier care without cancelling their scheduled appointment. Second, it may be possible that the child is completely (or mostly) better from their issue by the time the appointment comes and ultimately did not need specialised care from the orthopaedic surgeon.
Discussion with clinic managers and hospital administration is the next step to start reducing the rate of NS at our institution based on the predictors observed in this study. Overall, focusing efforts to identify factors associated with increased NS rates in the paediatric orthopaedic population will provide opportunities to create interventions to mitigate the identified risks. The effectiveness of these interventions can then be further studied using this same EHR system. These efforts allow for improved long-term patient outcomes and decreased burden on the healthcare system, and the programmes can be equally applied to patients with lower NS rates, improving the overall problem.
This study is not without limitations. The variables included were those easily queryable within the EMR (Electronic Medical Record) and potentially of influence on appointment attendance. There are likely other factors that may influence NS that we were unable to include. Since the data were pulled at the encounter level, we were also unable to determine whether serial NS occurs for individual patients.
Conclusions
Our data have demonstrated that factors such as payor type and longer duration between scheduling and appointment play a role in predicting non-attendance at outpatient orthopaedic appointments. These factors are interdependent, and the small effect sizes of the variables analysed in this study highlight the complexity of the NS phenomenon. Despite the multifactorial nature associated with the NS phenomenon, practices can be enacted to target each of the discriminators that are the best predictors of NS. Now that the best predictors of NS have primarily been identified as (1) time between appointment scheduling and appointment day and (2) payor type, interventions in these specific areas can be generated and applied. Minimising time between scheduling and appointments, enacting a call reminder system for those patients with government/public insurance, and individualised practices based on unique findings at each clinic are just a handful of possibilities. Future research can be focused on determining the efficacy of these intervention strategies.
References
Footnotes
Twitter @Joey Robaina
Contributors EWE and TPB were responsible for study design and manuscript preparation. ACR was responsible for data acquisition and manuscript editing. JAR and TPB were responsible for analysis and manuscript preparation.
Funding The authors have not declared a specific grant for this research from any funding agency in the public, commercial or not-for-profit sectors.
Competing interests None declared.
Patient consent for publication Not required.
Ethics approval A request for institution review board exemption was submitted and granted to query data from the EHR for orthopaedic appointments in a de-identified fashion under our institution's quality initiative process.
Provenance and peer review Not commissioned; externally peer reviewed.
Data availability statement No data are available. In order to share data with external entities, our institution would require a legally executed data use agreement between parties.