Article Text

Abstract
Background Obesity is a significant health issue and key public health priority. This study explored body mass index (BMI) recording in general practice within the Kent Integrated Dataset.
Methods Using a sample aged 18–100 years, resident within Kent, who were alive and currently registered to a Kent general practice as of 6 August 2018 within the Kent Integrated Dataset. We identified the latest BMI from event records between 2015/2016 and 2017/2018. Recording was evaluated by sex, age, deprivation, hypertension, serious mental illness and multimorbidity.
Results Between 2015/2016 and 2017/2018 using the sample of 1 154 652 persons, BMI was recorded for 43.7% of the sample. Multiple logistic regression showed that BMI recording was higher in females, the middle age bands, persons living in the most deprived areas and within persons who were hypertensive, had serious mental illness or were multimorbid.
Conclusions Findings were aligned to previous research using nationally representative samples. Completeness of recording varied by age, sex, deprivation and comorbidity. Recording within general practice was aligned to chronic disease management. From a prevention perspective, earlier assessment and intervention for the management of excess weight within primary care may be an opportunity for avoiding increases in BMI trajectory. There may also be merit in recognising that the external disease agents that influence obesity can be controlled or reduced (obesogenic environment) from a national policy perspective. Such a perspective may also help reduce stigmatisation and the pressure around arguments that centre on personal responsibility for obesity.
This is an open access article distributed in accordance with the Creative Commons Attribution Non Commercial (CC BY-NC 4.0) license, which permits others to distribute, remix, adapt, build upon this work non-commercially, and license their derivative works on different terms, provided the original work is properly cited, appropriate credit is given, any changes made indicated, and the use is non-commercial. See: http://creativecommons.org/licenses/by-nc/4.0/.
Statistics from Altmetric.com
Summary
What is already known?
BMI recording in general practice occurs infrequently, but is higher within some groups; women, ages 65-74, residents in areas of deprivation, within obesity and certain comorbidities.
What does this paper add?
This study reports data for a large sample from the Kent Integrated Dataset. Our findings aligned with previous research, but also identified that BMI recording was higher in persons with multimorbidity. Prioritising the earlier assessment and intervention for the management of excess weight in primary care may be an oppertunity for prevention.
Introduction
Obesity is a significant health issue and key public health priority from its association with increased risk of disease1 one that is costly to health and social care.2
The Health Survey for England estimates the percentage of adults (aged ≥16) who are overweight and obese, defined as a body mass index (BMI) ≥25 and ≥30 kg/m2, respectively, using height and weight measurements.3 This demonstrates that while obesity rose sharply between the 1990s and 2010, the prevalence of overweight and obesity has remained stable at a high level since. In 2016, 35.2% of adults were overweight and 23.3% of adults were obese, with a combined prevalence of 61.4%. There are known inequality gradients in the prevalence of obesity between those living within the most and the least deprived areas.3
The Kent County Council area is located within the South-East of England and has a total population of 1.5 million.4 Nearly 6% of Kent’s population live within the 32 lower super output areas within the most deprived 10%.4 Supporting Kent residents to achieve and maintain a healthy weight is a key priority across the County for Local Authorities and Clinical Commissioning Groups.
The National Institute for Health and Care Excellence makes recommendations on the assessment, prevention and management of excess weight with the recognition of the importance of practitioners providing information and advice within primary care.5 The Quality and Outcomes Framework (QOF) currently rewards general practices for the identification of obesity in those aged 18 and over within the previous 12 months and this has been in place since 2006.6 However, the current indicator used within the General Medical Services general practitioner (GP) contact does not specify the recoding of BMI within the management of long-term conditions.6
McLaughlin et al performed a systematic review that explored the epidemiology of adult weight recording by GPs within the UK and short-listed five relevant studies using local and national data.7 BMI recording within UK primary care between 2003 and 2010 has increased overtime and was found to be higher in females and middle-older age groups from a study using the UK Clinical Practice Datalink.8 Further research explored the regularity of obesity recording between 1997 and 2007 using the UK Clinical Practice Datalink, finding that BMI monitoring occurred infrequently, but that recording was higher within women, those aged 65–74 years, within persons resident in areas of deprivation and more likely within the obese patients relative to overweight patients.9 Previous research has also explored BMI recording (59.5% and 72.8%, respectively) as part of the NHS Health Check within Hammersmith and Fulham between 2008 and 2011 and within Ealing between 2008 and 2009.10 11 Both of these studies also explored BMI recording in relation to comorbidity; demonstrating higher recording of BMI for persons with hypertension,10 11 chronic kidney disease and non-cardiovascular comorbidity.10 BMI recording in severe mental illness within cardiovascular disease screening was also explored between 2000 and 2008; finding that before 2004 people with severe mental illness aged under 60 years were less likely to have a BMI record but after 2007 were just as likely as persons without severe mental illness, this was attributed to financial incentives from the QOF.12
While these studies have explored the quality of BMI recording in primary care in association with sex, age, deprivation and comorbidity this has not yet been explored in association with multimorbidity. The only relevant study exploring multimorbidity completed an analysis using a sample where patient records for BMI were complete using the UK Clinical Practice Datalink, finding that multimorbidity was associated with increasing BMI and obesity.13
The aim of this study was to evaluate BMI recording within general practices across Kent between 2015/2016 and 2017/2018 and explore associations with key demographic and socioeconomic variables as well as hypertension, serious mental illness and multimorbidity.
Methods
Kent Integrated Dataset
The Kent Integrated Dataset brings together data from the majority of health and social care provider organisations across Kent. The data set incorporates an industry standard NHS Number pseudonymisation process to preserve confidentiality and enable patient-level record linkage from services including general practices, hospitals, community health services, mental health services and social care. This provides a person-level, longitudinal record and allows analysis of the patient care journey alongside care costs. This is a shift from the traditional approach of collecting and analysing data at the level of organisations thereby reducing ecological confounding. The database represents over 90% of the Kent population.
The Kent Integrated Dataset was set up in 2014 as part of the NHS England funded programme Long Term Conditions Year of Care. Since then, its use has been extended to broader range of public health questions providing insight into population health and system-level use of services. There is a strong legal basis for sharing data due to a number of powers and duties being placed on Clinical Commissioning Groups and Local Authorities by the Health and Social Care Act 2012—especially in the context of public health surveillance. These powers have also been underlined within the General Data Protection Regulation as set out in Article 9 (2)(i), which allows the processing of ‘special category personal data’. Furthermore, the Health Service (Control of Patient Information) Regulations 2002 Regulation 3 also sets out a remit for risks to public health.
The sample was composed of persons aged 18–100 years, resident within Kent, who were alive and currently registered to 165 general practices as of 6 August 2018.
BMI read codes and clinical measurements
Height, weight and BMI clinical measurements, as well as read codes for BMI recording were obtained. A last observation carried forward approach was used for BMI measurement and recording between 2015/2016 and 2017/2018.
The read codes used within this study are detailed in table 1. Using the obtained height and weight measurements a BMI value was calculated for measurements on the same day, as well as weight records since last recorded height. The read codes to identify these categories are detailed in table 2. The following BMI categories were derived using measurement data: underweight <18.5 kg/m2, healthy weight 18.5–24.9 kg/m2, overweight 25.0–29.9 kg/m2, obese >30.0 kg/m2. Biologically implausible measures, defined according to previous research (weight <30 or >400 kg, BMI <14 or >70 kg/m2, height <1.2 or >2.2 m),9 were removed.
Read codes for body mass index recording
Read codes for height, weight and body mass index measurement
Hypertension
This used read codes for established hypertension aligned to the QOF business rules using hypertension diagnosis codes and blood pressure measurement.
Serious mental illness
This used read codes for schizophrenia, bipolar affective disorder, other psychoses and patients on lithium therapy aligned to the QOF business rules.
Multimorbidity
The definition of multimorbidity was based on diagnosis of two or more of the following long-term conditions: atrial fibrillation, asthma, cancer, coronary heart disease, chronic obstructive pulmonary disease, dementia, depression, diabetes, epilepsy, heart failure, hypertension, learning disabilities, mental illness, osteoporosis, peripheral arterial disease, rheumatoid arthritis and stroke. This used read codes aligned to the QOF business rules and are available on request.
Data analysis
Data analysis used multiple logistic regression to explore for the odds of null BMI recording using a dichotomous outcome variable in reference to valid recording. The model was adjusted for by sex, age, deprivation, hypertension, serious mental illness and multimorbidity. The continuous variable age was categorised into age band. Deprivation used the Index of Multiple Deprivation 2015 Kent population weighted quintiles.
Results
The sample included n=1 154 652 persons aged between 18 and 100 years, registered with a Kent general practice and resident in Kent.
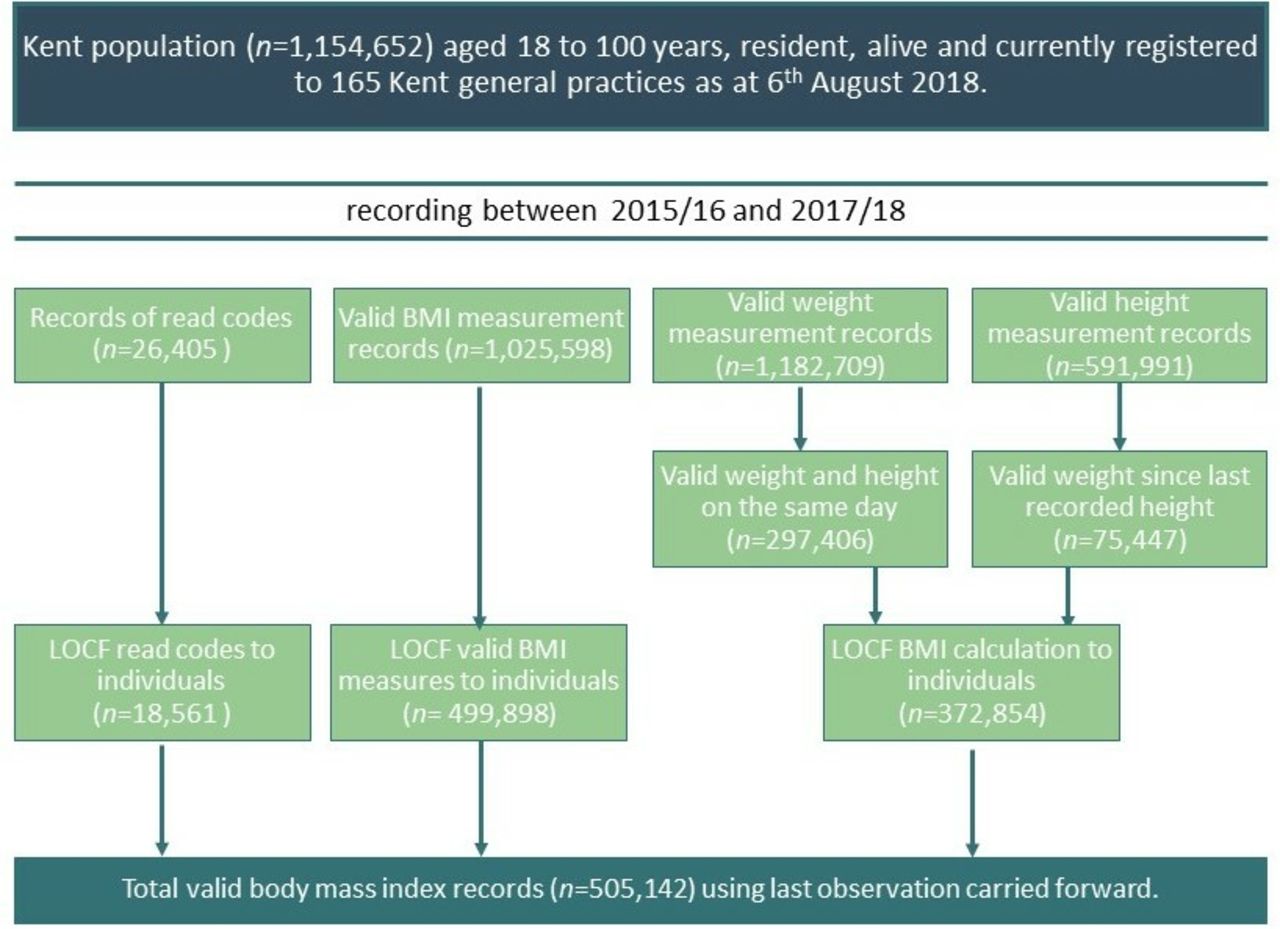
A total of 505 142 valid BMI records were identified using last observation carried forward. Figure 1 provides details of the selection of these records. This included 18 561 read codes and 499 898 valid BMI measurement records to individuals. We could also calculate BMI using height and weight measures for 377 854 individuals.

Flowchart showing data selection for analysis. BMI, body mass index; LOCF, last observation carried forward.
Overall, BMI was recorded between 2015/2016 and 2017/2018 for 43.7% of the sample, of these 48.5% were men (n=560 543) and 51.5% (n=594 109) were women. Missing BMI values accounted for 56.3% of the sample.
Table 3 shows the adjusted OR of the missing BMI group compared with the recorded BMI group. Gender was associated with BMI recording; females were more likely to have a valid BMI record. Current age was also associated; recording increased with age, peaking within the 45–74 age bands and then declining within the older groups. Socioeconomic deprivation was also associated with BMI recording; persons living in the most deprived areas were more likely to have a valid BMI record than persons within the least deprived Kent weighted Index of Multiple Deprivation 2015 quintile. Persons with hypertension, serious mental illness or multimorbidity were also more likely to have valid BMI records.
The logistic model for adjusted ORs for null body mass index recording compared with valid body mass index recording
Discussion
BMI recording was valid for 43.7% of the sample, using last observation carried forward for clinical measurements and read codes between 2015/2016 and 2017/2018. BMI data from clinical measurements recorded and calculated were more frequently available than the use of read codes to assign BMI category, similar has been found elsewhere.9 Comparatively higher levels (51%) of recent BMI recording had been found within a study exploring recording during 2009–2011 using the Clinical Practice Research Datalink.8 However, this figure has not been since updated within research using data relevant to general practice.
We found that BMI recording was higher for females, with increasing age band and declined in the older ages, was higher in persons resident in the most deprived areas and within persons with hypertension, serious mental illness and within multimorbidity. Similar to our study, the analysis of the UK Clinical Practice Datalink between 2003 and 2010 found higher BMI recording in females, higher deprivation and coexistent chronic disease.7 Similar findings were also reported by a UK Clinical Practice Datalink between 1997 and 2007, which explained that these groups were more likely to have a BMI record due to higher consultation rates in primary care.8
Previous studies have explored the completeness of BMI recording for the key demographic and socioeconomic variables, as well as in relation to coexistent chronic disease; hypertension, 10 & 11 chronic kidney disease and non-cardiovascular comorbidity.10 Further, multimorbidity had been associated with increasing BMI, regardless of age, sex and deprivation.9 However, this study adds to the knowledge base by identifying higher BMI recording in association with multimorbidity.
The Health Survey for England reported that 23.3% of adults across England were obese in 2016. In comparison, the QOF reported that 9.4% of adults were recorded to be obese within general practice during the 12 months of 2016/2017. This study used last observation carried forward to explore BMI recording between 2015/2016 and 2017/2018 and found the prevalence of obesity was greater than the figure reported by the QOF, but still an underestimate of that reported by the Health Survey for England. Previous studies exploring BMI recording using the UK Clinical Practice Datalink have reported the same finding; improved BMI in comparison to the QOF but an underestimate of the figure reported by the Health Survey for England.
We have also shown similarity to the large representative studies conducted using the UK Clinical Practice Datalink, therefore confirming the reliability of the Kent Integrated Dataset for use within epidemiological analysis of general practice recording of obesity.
Limitations of this study
This study has the advantage of being large and representative of the Kent context, with coverage of over 90% of the Kent registered general practice population. The approaches used to define the process for classifying BMI and implausible measurements here have been aligned to previous research to aid comparability. This study did explore a different range of long-term conditions to a previous study exploring multimorbidity; coronary heart disease, stroke, asthma, sleep apnoea, type 2 diabetes, neoplasms, gall bladder back pain, osteoarthritis, joint problems and depression.9 Our classifications were aligned to definitions used within the QOF for reliability.
Conclusions
Findings from this study were aligned to previous research using nationally representative samples demonstrating the reliability of the Kent Integrated Dataset. Therefore, use of the Kent Integrated Dataset could be extended for additional epidemiological studies to explore the equity of weight management interventions for the management of obesity across Kent. The Kent Integrated Dataset can also enable analysis of the patient care costs as it includes a person-level, longitudinal record of utilisation at general practices, hospitals, community health services, mental health services and social care.
Comparison to nationally representative survey estimates suggests that obesity recording was lower within primary care than the levels of obesity expected within the general population. The same is observed when comparing the Health Survey for England prevalence estimates to the QOF recorded prevalence. The under-recording of obesity within primary care is likely to negatively impact any healthy weight intervention.
While the QOF indicator does not specify the recoding of BMI within the management of long-term conditions, the recording of BMI within general practice appears to be aligned to chronic disease management. From a prevention perspective, the earlier assessment and intervention for the management of excess weight within primary care may be an opportunity for the avoidance of increases in BMI trajectory. There may also be merit in recognising that the external agents that influence obesity can be controlled or reduced (obesogenic environment) from a national policy perspective. Such a perspective may also help reduce stigmatisation and the pressure around arguments that centre on personal responsibility for obesity.14
Footnotes
Funding The authors have not declared a specific grant for this research from any funding agency in the public, commercial or not-for-profit sectors.
Competing interests None declared.
Patient consent for publication Not required.
Provenance and peer review Not commissioned; externally peer reviewed.