Article Text

Abstract
Background Health supply chain managers are unable to effectively monitor the performance of the immunisation supply chain in Nigeria. As a result, they are unable to make effective, data-driven decisions. This results in poor vaccine availability at some service delivery points. A lack of reliable data for evidence-based decision making is a significant contributor to this challenge.
Method The visibility and analytics network (VAN) principles were introduced to enable end-to-end visibility in the immunisation supply chain and logistics (ISCL) system and make more accurate data available to health supply chain managers.
Results The application of the VAN principles has led to improved data collection, real-time stock visibility and enhanced data analytics framework. This enhanced visibility has promoted a culture of accountability and data-driven decision-making, previously unattainable. Health supply chain managers are now equipped with better skills and tools to promote effective operation of the immunisation supply chain.
Conclusion The introduction of VAN principles has been an effective approach to improving data visibility and creating incremental improvements in the ISCL in Nigeria.
- VAN
- analytics
- immunisation supply chain
- data management
Commons license http://creativecommons.org/licenses/by/4.0/
Statistics from Altmetric.com
INTRODUCTION
Achieving Universal Health Coverage (UHC) is an important objective for Nigeria to attain equitable and sustainable health outcomes. However, a functioning primary health care system (PHC) is fundamental to the achievement of UHC,1 which has been the focus of recent statements by the Government of Nigeria (GoN), partners in development, advocacy groups and health stakeholders in Nigeria.
Despite the increasing attention to the importance of health care systems, which encompass the institutions, organisations and resources (physical, financial and human)2 assembled to deliver health care services that meet population needs, the health system in Nigeria still falls short of providing accessible, good-quality, comprehensive and integrated care.
Recent surveys and assessment of the Nigeria PHC system, including the Multiple Indicator Cluster Survey (MICS) conducted in 2016–2017 by the National Bureau of Statistics (NBS), the United Nation Children’ Fund (UNICEF) and other partners in development show the infant mortality rate to be 70 per 1000 live births. Equally, deaths among children under age five stands at 120 per 1000 live births.
Immunisation supply chain and logistics (ISCL) challenges such as vaccine stock-out, cold chain equipment failures, frequently unavailable transport and poor financial management are contributors to these sobering statistics.3 For instance, the 2012 audit of the ISCL identified a mismatch between programme need and vaccine distribution, and noted persistent vaccine shortages at health facilities (HFs), despite adequate supplies at the national level, as a contributor to poor immunisation coverage.3,4
Also, the 2012 effective vaccine management assessment found that 81% of local government areas (LGAs) and 54% of HFs did not have vehicles for vaccine distribution and outreach sessions,5 and in 1 month, 30% of States had no syringes, and 20% of States experienced vaccine stock-outs,6 making hard-to-reach rural populations even more difficult to immunise.
Evidently, Nigeria, with a population of about 180 million people,7 and a 33% immunisation rate for children between 12 and 23 months,8 the consequences of the poor state of the ISCL are numerous and affect maternal as well as child mortality.
The lack of reliable data for evidence-based decision-making is a major cause of these challenges.4 Several functions of the logistics management information system (LMIS), including archiving, record practices, accurate reporting of vaccine stock balance and tracking indicators and the use of data to spur action, require critical improvement in order to promote timely distribution of vaccines and basic health commodities to all levels of the health system.
The Expanded Programme on Immunisation (EPI), under the National Primary Health Care Development Agency (NPHCDA) of the Federal Ministry of Health, and in coordination with partners is mandated to improve child survival by reducing morbidity and mortality. Focus areas include vaccine-preventable diseases – Polio eradication initiative, meningitis-A control, measles control and elimination, yellow fever control and maternal neonatal tetanus elimination. The current national goal, set in 2015, is to achieve 87% immunisation coverage across all antigens.
In 2016, the NPHCDA began implementing the visibility and analytics network (VAN) principles as a means to improving the ISCL in Nigeria. This paper aims to share our experience in implementing the VAN towards providing end-to-end visibility in the Nigeria ISCL.
METHODS
Nigeria, through the NPHCDA, in collaboration with development partners, began to participate in the VAN initiative in 2015. The VAN initiative is a global collaboration of supply chain experts, country representatives and implementing partners interested in adapting commercial sector ‘control tower’ approaches to public health use-cases. The ‘control tower’ approach is a set of supply chain capabilities built on people and policies, processes and technology organised as a centralised shared service9 with the goal of providing end-to-end visibility into the supply chain.
People and policies
The Department of Logistics and Health Commodities (DLHC) was set up in September 2015 with the mandate ‘to ensure that vaccines and other health commodities are supplied to the point of delivery on time, in full and in optimum condition’. The DLHC became the central authority for supply chain transformation initiatives, replacing a complicated organisational structure with frequently blurred responsibilities resulting in poor accountability and performance.
Figure 1 illustrates the VAN principle of building a highly skilled team of supply chain professionals. This team delivers a set of well-defined supply chain services, including performing complex analytics to enable the right decisions at the right time to ensure product availability, performing continuous improvement in functional processes, creating optimised holistic plans and making proactive corrective action recommendations.

Process
Description of the VAN accountability framework
A systematic monitoring and evaluation system that measured the vaccine supply chain performance by collecting relevant evidence and tracking the VAN framework implementation was developed – Table 1). The framework focused on key indicators that cover the optimal functionality of the national logistics supply chain.
Technology governance framework
A large number of overlapping tools of varying appropriateness, quality and sustainability have been introduced into Nigeria’s vaccine supply chain ecosystem without guidance on the government’s priorities, contextual needs and appropriate placement. However, as a national network, they are fragmented and incomplete.
These initiatives have largely gone unchecked due to the government’s inability to evaluate tools before they enter the vaccine supply chain ecosystem. It was highlighted that, for a successful implementation of the VAN principles, their integration into the existing infrastructure to support and complement available resources was crucial.10
Thus, the DLHC devised the Technology Governance Framework as an objective method to evaluate, introduce and administrate potential technology solutions for use in the vaccine supply chain ecosystem in Nigeria. This pragmatic, inclusive approach to the ecosystem provides a platform for both existing solutions and new solutions to add value. It also helps to guide the addition, modification and subtraction of tools and reports from the overarching ecosystem and ensure the integration of existing tools prior to the introduction of new ones.
Technology
VAN principles suggest achieving end-to-end visibility by pursuing the following tenets:
Augmenting extant systems to create an ecosystem of integrated tools and processes
Creating an analytics framework feeding management dashboards
Creating centres of excellence for continuous improvement
Developing crosscutting programmatic integration designed to enable the end-to-end flow of key information and performance indicators throughout the ecosystem.
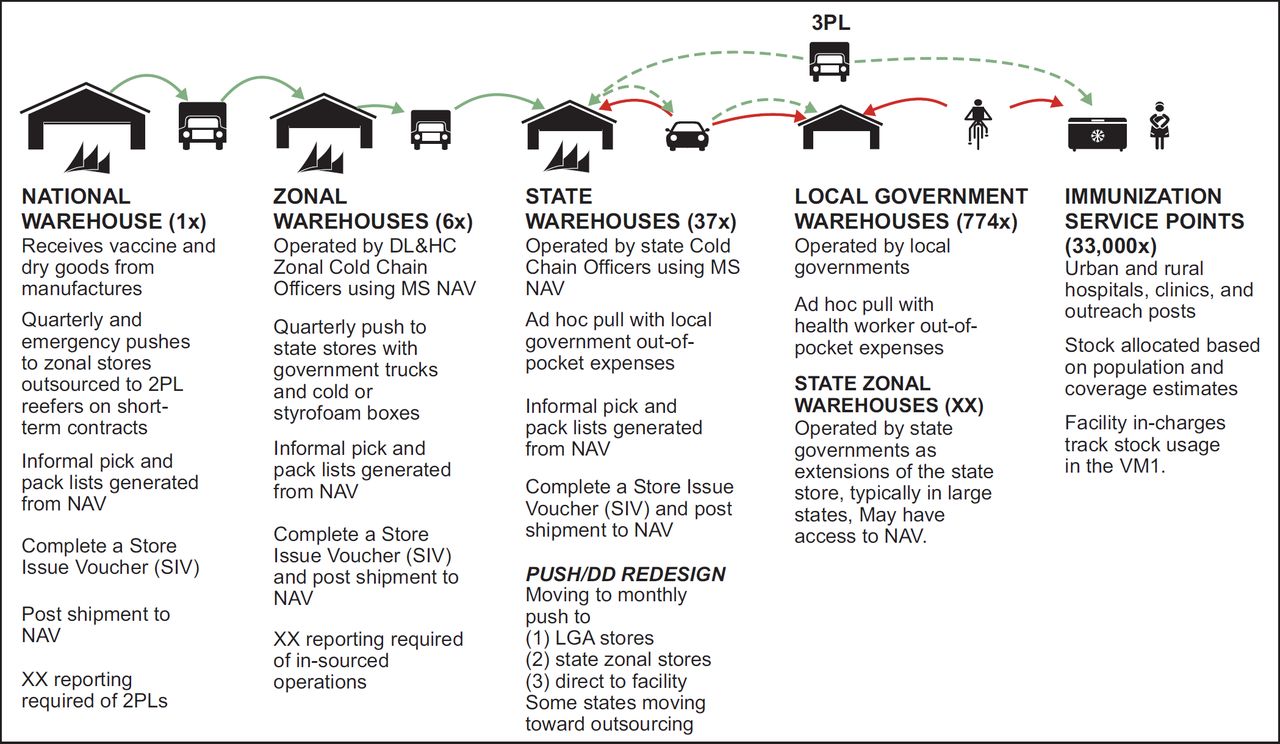
Utilising the VAN principles, Nigeria and its development partners have begun to design a supply chain system (Figure 2) that provides the right vaccines in the right quantities, in the right condition, at the right time, in the right place and at the right supply chain cost to the (over) 30,000 service delivery points (SDP)3 across Nigeria. The technology component of this project is best described in two focus areas:

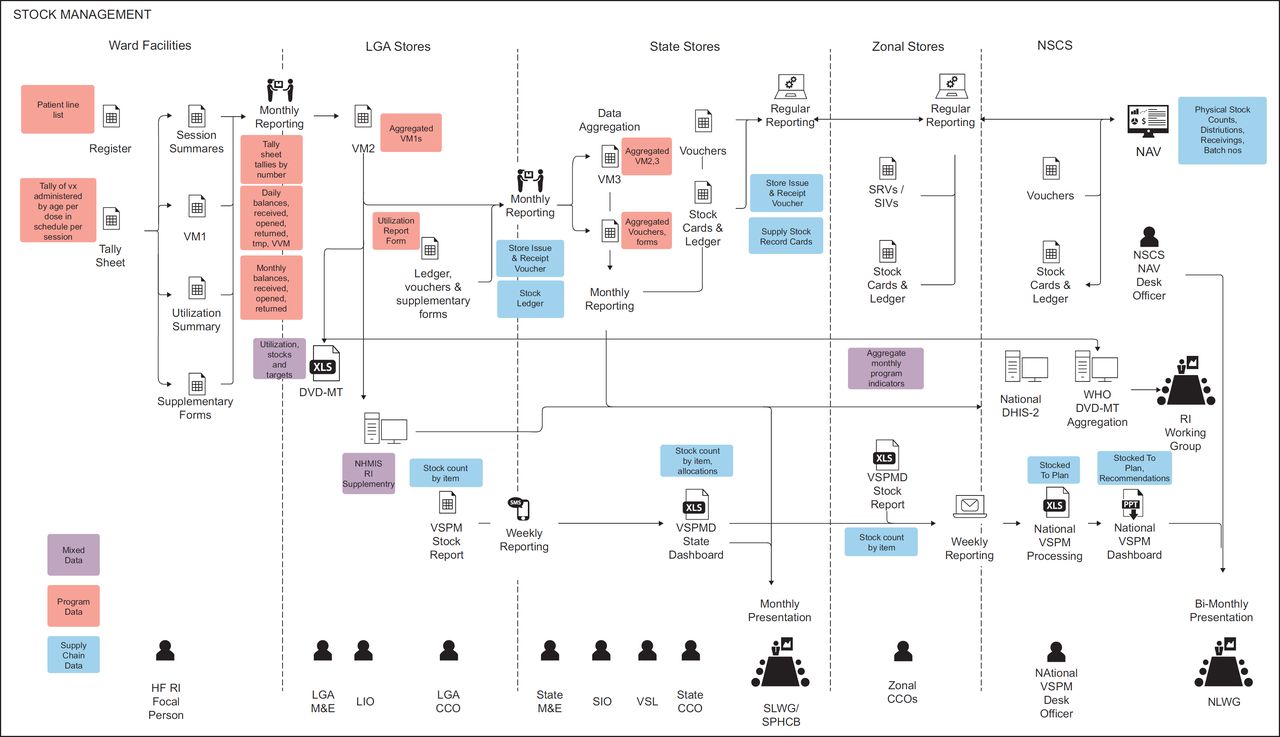
Figure 3 shows the stock management flow of the Nigerian ISCL from the National storage to the health facilities.
Vaccine stock performance management dashboard
The vaccine stock performance management dashboard (VSPMD), a web-based tool was designed and deployed for weekly reporting of vaccine stock from LGAs, States and Zonal stores. The VSPMD replaced the Excel-based stock management tool (SMT) that was hitherto used to manage vaccine distribution.
The data captured using the SMT could only be analysed within a 60-day period and its storage was augmented with Dropbox; thus, making it inaccessible to all stakeholders and insufficient to address the need for real-time inventory data for decision making.
The VSPMD improved reporting rates on vaccine stock availability but its parallel existence to the vaccine supply and distribution system remained a significant challenge.
Integrated navision dashboard
To address the challenges with the VSPMD, it became crucial to integrate vaccine stock data to the distribution and supply process to increase usage, deliver LGA visibility and set a foundation for Data for Management at scale.
This led to the development of the integrated Navision (NAV) Dashboard deployed for use at the National and State level to track RI stock. The NAV Dashboard provides a platform for weekly reporting of vaccine stock and provides real-time visibility to the national and state cold stores. Under the previous regime of paper and Excel-based tools, this level of real-time visibility was unimaginable.
RESULTS
The VAN approach and principles have helped to improve the ISCL in the following areas:
Data collection
A more accountable framework now exists with VAN in place, allowing for the seamless flow of service delivery data on stock levels, vaccine consumption, wastage rates, stock-outs, target populations and cold chain performance and many other data points within the Nigeria ISCL – Figure 4. These data points are passed up the supply chain where they are validated, aggregated and analysed according to VAN principles. This process enables evidence-based decision making for improved supply chain management.

Leadership and governance
The availability of data on the Dashboard has promoted weekly review of the vaccine supply chain at the National and sub-national level. At the National level, the National Logistics Working Group reviews the stock levels and cold chain performance for each State and is able to identify challenges and provide technical support to the States. The State Logistic Work Group also review the dashboard at the State level and provide technical support to LGAs.
These review sessions provide a platform for stakeholders to collaborate and collectively ensure the continuous improvement of the ISCL with the government driving the process and supported by its development partners.
Real-time stock visibility and management
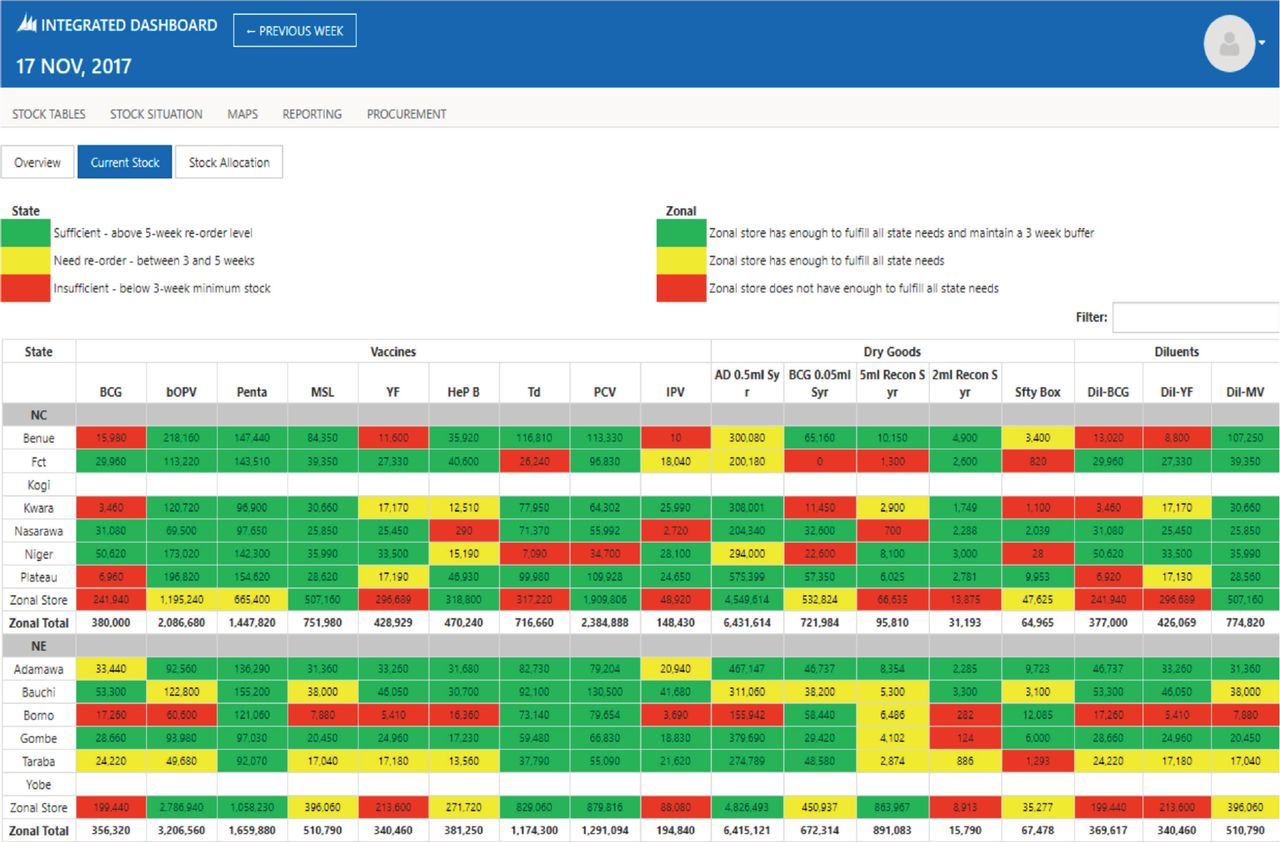
The roll-out of the dashboard which collects stock data from the 774 LGAs across the 36 States and the Federal Capital Territory, and the six zonal stores created visibility for the first time across the ISCL providing the NPHCDA and other stakeholders’ evidence for decision-making. The NAV Dashboard provides an analytic summary of availability of vaccines and devices across all States and LGAs (Figure 5). This information provides evidence for restock and prevents overstocking of cold stores and the potential wastage of vaccines.

Data submission improved considerably, with the States reporting more regularly on vaccine stock. The process began modestly, focusing on a weekly stock count of vaccines at the LGA cold stores by the LGA Cold Chain Officer. This stock count report is transmitted via SMS to the State Cold Chain Officer (SCCO) for input on the VSPMD and onward reporting to a logistician at the NPHCDA. The logistician at the NPHCDA would then aggregate all reports received from the States and undertake a summary analysis on the VSPMD.
This process has gradually evolved with the deployment of the Integrated Navision Dashboard. The SCCOs now have access to the integrated NAV Dashboard and able to enter the weekly stock count for their respective States directly on the platform and receive instant feedback on the required stock for distribution.
Data analysis, interpretation and use for decision-making
Logisticians, programme managers and stakeholders honed their ability to respond to ISCL problems using data as they gained a better appreciation of the value of improved data and analytics and felt more competent to perform logistical tasks and apply the VAN methodology to daily data management issues. Of note is the process discipline in adherence to the weekly and daily routine in reporting and the use that has become a culture of practice with the managers often negating weekends and public holidays.
Improved capacity
Training workshops on the VAN approach and the use of analytic tools organised at the national and sub-national levels improved participants’ knowledge and computing skills in using the NAV Dashboard for reporting, analysis, presentation and dissemination. The software vendors and stakeholders also benefitted from insights into new requirements and gained a better understanding of weaknesses related to local context and configuration of the VAN analytic tools.
KEY CHALLENGES
Funding
Funding for the project was largely donor-dependent. Even though efforts have been made to ensure project sustainability, there are concerns regarding the capacity and willingness of subnational governments to continue investing in supportive supervision, training and infrastructure maintenance that are vital for the project. The extension of the VAN to the last mile will also bring about additional costs in software licenses and other recurring expenditures.
Skilled human resources
The availability of personnel with sufficient skills in computer use poses a challenge to the success of the VAN. Though training has been conducted to build the capacity of logisticians at national and sub-national levels, there is a need for periodic refresher training.
VAN NEXT STEPS
The achieved centralised logistics data and user-centred workflows create opportunities for new processes, automation and analytics. VAN hopes to build on these opportunities to introduce new key performance indicators (KPIs) and implement cross-cutting SOPs and practices adapted for the EPI to allow for continuous improvement of the ISCL.
To sustain the gains of the VAN, the next line of action focuses on the following areas:
Service delivery data integration
Develop open NAV Application Programming Interfaces, forming the basis for extensible and maintainable analytics modules, and allowing logistics systems to contribute data.
Integrate LMIS indicators and analysis with the routine District Health Information System (DHIS), where joint supply and service indicators are presented – helping managers interpret programme performance and automatically crosscheck utilisation data with supply data.
LGA extension for last mile visibility
Develop LGA mobile and desktop versions of the new offline NAV restock reporting and distribution interfaces for LGA cold chain officers (CCOs), providing data directly from service tiers of the supply chain with tools that are resilient to contextual challenges (intermittent power, connectivity).
Rollout stock reporting practices to the LGA tier, empowering LGA CCOs with greater control over their own stock, allowing them to provide visibility into the facilities below them.
CONCLUSION
Nigeria has made remarkable progress in improving the performance of the ISCL since the implementation of the VAN. Introducing the VAN approach has moved the supply chain management in Nigeria to the next phase of growth by enabling a culture of data-driven decision-making.
It is hoped that by continuing to fine-tune the distribution system and expanding data visibility to additional users, analysis and continuous improvement practices can take place at the national and subnational levels. However, funding challenges and improvement of staff capacity at the National and State level remain a key factor in the sustained progress of the VAN.
Footnotes
Conflict of Interest None declared.