Article Text

Abstract
Background Globally, technologies have been recognised to improve productivity across different areas of practice including healthcare. This has been achieved by the expansion of computers and other forms of information technologies (ITs). Despite this advancement, there have also been growing challenges to the adoption and use of these technologies within practice, sometimes with unintended or unexpected consequences. However, the barriers and drivers to IT and, more specifically, e-health adoption within healthcare are little understood, especially in areas such as Sub-Saharan Africa (SSA) where e-health adoption is relatively new.
Methodology This paper describes a pilot study to develop and validate sample statements for use within a later substantive Q-methodology study. The aim of the main study was to understand factors that influence healthcare professionals’ (HCPs) attitudes towards IT adoption and use in SSA. We report on the use of this methodology to explore the subjectivity of HCPs together with the models of technology acceptance [technology acceptance model (TAM) and the unified-theory of acceptance and use of technology (UTAUT)] used in combination for the first time.
Results Following various stages and mapping of the two models of technology acceptance used, 46 statements were developed at the end of the pilot study. These statements were grouped into six themes to capture the constructs of the two models used in the study.
Conclusion Findings suggest that it is possible to use TAM and UTAUT to develop a comprehensive set of statements. These statements reflect choices that HCPs consider on IT/e-health adoption and use in SSA which can be used in a Q-study.
- e-health
- Q-methodology
- healthcare professionals
- technology acceptance model
- unified theory of acceptance and use of technology
- Sub-Saharan Africa
Commons license http://creativecommons.org/licenses/by/4.0/
Statistics from Altmetric.com
- e-health
- Q-methodology
- healthcare professionals
- technology acceptance model
- unified theory of acceptance and use of technology
- Sub-Saharan Africa
INTRODUCTION
There is poor adoption of technology among healthcare professionals (HCPs)1,2 in Sub-Saharan Africa (SSA), despite recognising that technology can improve healthcare delivery and outcomes. This paper explores HCPs’ views on the adoption and use of technologies within their clinical practices. The technology acceptance model (TAM) and the unified theory of acceptance use of technology (UTAUT) are used in this study to understand the views of HCPs working in the clinical area on the factors that influence their adoption and use of technologies within their clinical practice.
Technologies improve productivity across different areas of practice including healthcare and this has been achieved due to expansion of computers and other forms of information technologies (ITs).3 Information and communication technologies (ICTs) use and specifically innovations in e-health have the potential to deliver better healthcare through improved health strategies directed towards patient safety, healthcare collaborations, efficiency and healthcare research.4 The Royal College of Nursing (RCN) defined e-health as ‘concerned with promoting, empowering and facilitating health and wellbeing with individual, families and communities and the enhancement of professional practice using information management and information and communication technologies’ (RCN 2017). The RCN also identifies e-health to cover electronic patient records, electronics communication with patients and professionals, telehealth/telecare, information management, information governance and personal health records. However, there remains an on-going challenge of the adoption and use of these technologies within healthcare practice.3
The implementation of these technologies within healthcare practice has met with some barriers and facilitators.3,5,6 Harrison et al.7 identified that despite positive intentions unintended or unexpected consequences influence the perspectives of the HCPs that use these technologies. Consequently, there has been increased interest in research into the factors that influence e-health adoption and use within healthcare,5 though very few researchers have used a theory or model to explore this area (Table 1).6,8,9 Though various models and theories exist to explore ICT and e-health adoption and use among HCPs,8,10–12 TAM and UTAUT13,14 have been identified as the most widely used.15 They have been described as robust16–19 in understanding IT acceptance and use more generally. Holden and Karsh14 have identified some criticisms of use of these two models in healthcare. These includes researchers inability to standardise the models’ terminologies such interchanging ‘acceptance and adoption’ incorrectly and the great variability that exist between such studies [p. 167]. Despite this, both models evidently have wider applications in e-health research.14
Most studies tested the strength of the model’s constructs to determine which construct has more impact in the final adoption of e-health among HCPs6,9,17,20–22 rather than exploring the views as end users of these technologies. Our study uses Q-methodology, a method for the study of subjectivity to explore the perspectives of the HCPs on what influences their adoption and use of technology within their clinical practice utilising both the TAM and UTAUT as theoretical frameworks. This paper describes the previously unreported process of combining TAM and UTAUT with the Q-methodology approach.
MODELS OF TECHNOLOGY ACCEPTANCE AND USE
The technology acceptance model – TAM
TAM was proposed by Davis in 198623 to explain the potential user’s behavioural intention to use a technological innovation. TAM was developed from the Theory of Reasoned Action (TRA) of Martin Fishbein and Icek Ajzen (1975), though less general because it applies specifically to explain computer usage behaviour.23,24 The TRA asserted that both the attitude and subjective norm have an impact on behavioural intention, which in turn affects how people perform an action.25 Davis et al.23 stated that the goal of TAM was to provide an explanation of the determinants of computer acceptance across a range of contexts. It is also capable of explaining user behaviour across a broad range of end-user computing technologies and populations, while at the same time being both parsimonious and theoretically justified. The model was based on the premise that individuals’ ICT use is determined by two major variables: perceived usefulness (PU) – which is ‘the prospective user’s subjective probability that using a specific ICT will increase one’s job performance within an organisational context and perceived ease of use (PEOU) – defined as the degree to which the prospective user expects the target system to be free of effort’.13 The model suggests that actual technology usage is determined by behavioural intention to use the technology by individuals. This is affected by their PU, PEOU of the technology and their attitude towards it.13,17,19,23,26,27 Furthermore, DongPing and LianJin13 reported that the TAM theorises that the effects of external variables such as system characteristics, development process, and training are mediated by PU and PEOU. The external variables typically included system or ICT characteristics, user training in the ICT concerned, user participation in design and the nature of the implementation process.27
TAM robustness is seen as its ability to be applied to different technologies, under different situations, with different control factors (gender and type of organisation) and different subjects.28 According to Rogers (1995) cited in,29 the features of a technology that determines its adoption (and use) are its relative advantage, compatibility, complexity, trialability and observability. User exposure to these determinants generates reactions, which Venkatesh and Davis30 referred to as self-reported use. These identified reactions tend to be attributed to the user intention to use and actual use of the said technology.5,31–35
However, over the years, the model has been extended twice to capture factors that are believed to be critical in explaining usage behaviour.13 The first extension was identified as TAM2 by Venkatesh and Davis30 and was aimed at including key determinants to the model’s constructs and to understand the effects of the new determinants in the original model.13,30 This led to the removal of the ‘attitude’ construct and the addition of determinants to PU and intention to use constructs (Figure 1).13,27,30,36 Venkatesh and Bala37 further extended that TAM was used to explore organisational perspectives on decision making relating to the use of ITs in the work area. This led to the addition of determinants of PEOU of the TAM2 model. This revision by Venkatesh and Bala37 produced the TAM3 (Figure 1), which was expected to provide a ‘nomological network of determinants to individuals’ adoption and use of a technology’ (p. 301).

The unified-theory-of-acceptance-and-use-of-technology (UTAUT)
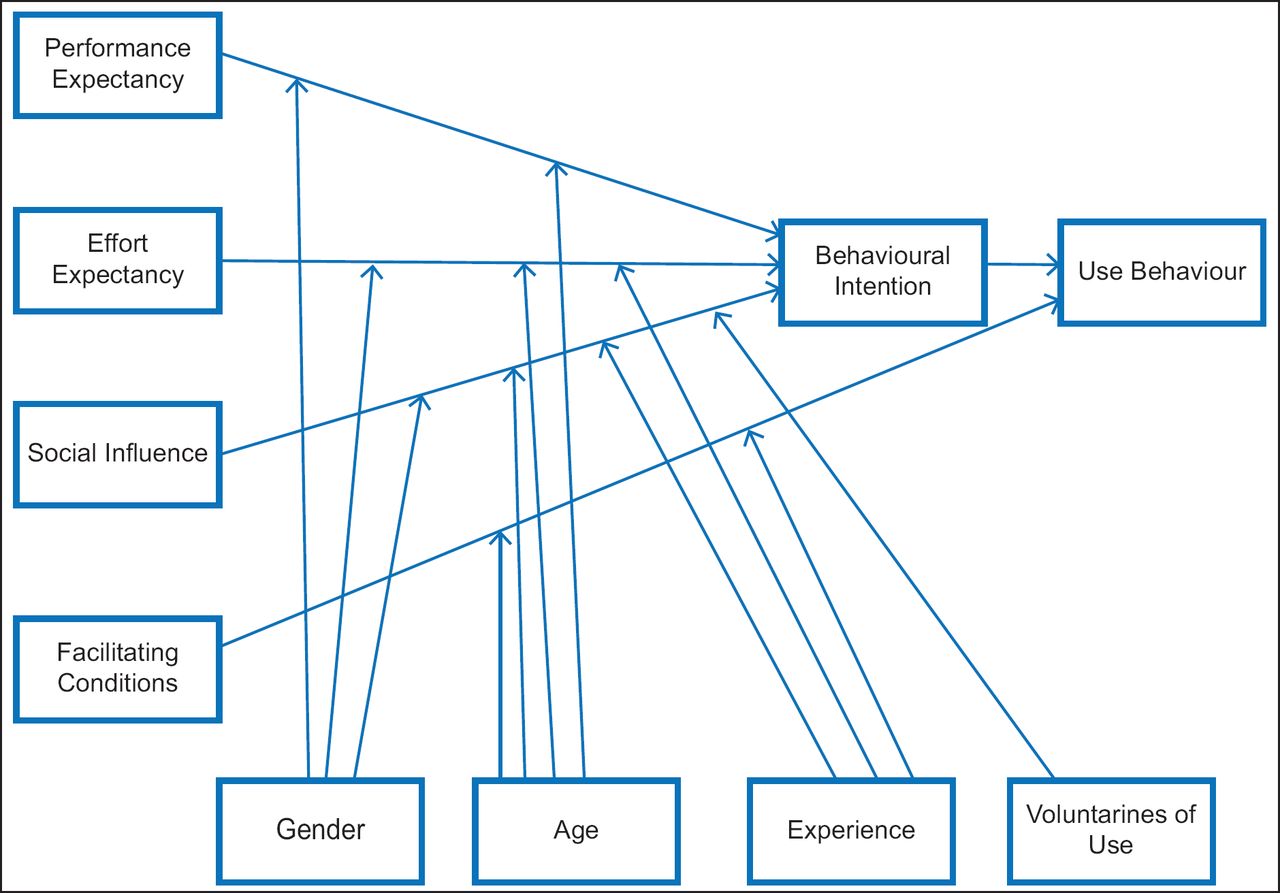
The UTAUT (Figure 2) developed by Venkatesh et al.38 unified the eight prominent competing ICT acceptance and use models. The unified models include TRA, TAM, the motivational model, the theory of planned behaviour (TPB), a model combining the TAM and TPB (C-TAM-TPB), the model of PC utilisation, the innovation diffusion theory and the social cognitive theory.13,39,40 The model was empirically tested and accounted for 70% of the variance in usage intention and it is suggested to be a behavioural model that aims to explain the behaviour of people or organisations in their use of ICT.13,38 UTAUT has four key constructs: performance expectancy (the degree to which an individual believes that using a system will help him/her attain gains in job performance), effort expectancy (degree of ease associated with the use of the system or ICT resource), social influence (degree to which an individual perceives that ‘important others’ believe he/she should use the technology) and facilitating conditions (degree to which an individual believes that an organisational and technical infrastructure exist to support the use of the technology). The model also has four moderating variables, which are age, gender, experience and voluntariness of use.13,38
LITERATURE REVIEW
TAM and UTAUT in healthcare
The TAM has attracted a lot of empirical and theoretical attention over the years of its existence but despite being the popular model for ICT adoption and use, it is still not seen as a healthcare specific model. Some have further argued that if used in its generic form, it may fail to capture or even contradict some unique contextual features of computerised healthcare, that is, indicating a significant gap in knowledge.14,17,41 Many studies have attempted to utilise the TAM in explaining or predicting ICT adoption in healthcare by applying it to specific healthcare applications20,22,26,42 or modifying the model to test new variables or hypotheses.6,18,20,43
Aggelidis and Chatzoglou42 used a modified TAM to examine health information systems (HIS) among HIS users by testing 23 hypotheses within the model using structural equation modelling (SEM) as seen in Table 1. They reported that the relationships between the initial TAM constructs hold and are significant. However, despite using a quantitative approach, the researchers identified among the limitations that a small and disproportionate sample was used, and that also emphasis was more on the information system (rather than the views of the users). Also, Gagnon et al.20 used a modified TAM to examine factors that influence the decision of HCPs’ use of an e-health resource. They identified a response rate of 39.7% and using logistic regression analysis, they reported that the TAM is a good model for predicting HCPs’ intention to use an e-health resource. Also, the researchers acknowledged that they adopted a questionnaire that has already been used in another TAM study and has not undergone test–retest reliability as consistent with quantitative studies. Emphasis within the study was also on the e-health resource and not the views of the users within the health sector. This study was similar to the study by Chismar and Wiley-Patton17 which also used a regression analysis to examine physicians’ acceptance of technology using the TAM modified by Venkatesh and Davis30 and adopting the questionnaire associated with the model. They have also identified as a limitation to their study, a small sample was used. Despite the stated limitation, they have identified that the relationship between the constructs within the TAM they used holds except for PEOU and subjective norm. In similar TAM related research, Bennani and Oumlil9 explored factors that influence IT acceptance by nurses. They modified the initial TAM model by adding two new constructs: trust and image. They tested 11 hypotheses using quantitative testing like those identified previously and used SEM. They also reported that the relationships within the constructs for TAM hold except for PEOU and the ‘trust’ construct they added.
Like studies involving the TAM, UTAUT research in healthcare mainly used quantitative approaches. Most researchers21,39,44 tested the empirical strengths of the model in their studies.
Kijsanayotin et al.39 employed a modified UTAUT to explore factors influencing health IT (HIT) adoption in community health centres in Thailand. They employed quantitative methods using SEM like in previously mentioned TAM studies, and their emphasis was on the HIT and model rather than the views of the participants on the factors influencing their adoption of HIT. Similarly, Sharifian et al.44 also used the UTAUT to identify factors influencing nurses’ acceptance of e-health resources in Iran again using a quantitative approach to identify the factors which influence e-health resource acceptance by testing the strength of the relationship within the model. The personal views of the participants regarding the e-health acceptance were not explored. Venkatesh et al.21 also utilised the UTAUT to explore an e-health resource adoption and use among physicians. SEM was used to predict the strength of the relationship within the model and although they established a relationship with the constructs with an explained variance of 44% this compared to 76% which was established when using the model in a previous study outside healthcare. However, they justified that the UTAUT should be integrated with other theories to enrich it when adopting it to the healthcare context.
Therefore, TAM and UTAUT have been the most consistently used models in exploring ICT within healthcare due to their reliable and validated robustness in technology adoption/acceptance and use literature. Despite this, however, more emphasis has been on establishing the relationships within the constructs of both models rather than the subjective views of the users’ interaction with the e-health resources. Some researchers11,45,46 suggested a move from the traditional quantitative methodology use in technology acceptance and use to a mixed approach. They argued that by using mixed methods in such studies, an understanding of the context will develop through the opinions of people who use such e-health resources. Others such as Venkatesh et al.21 have suggested using more than one model to explore factors that influence technology acceptance and use among HCPs. One such approach is Q-methodology which forms the basis of this paper. The paper aims to use both TAM and UTAUT to develop a comprehensive set of statements that reflect the views of HCPs on adoption and use technologies in clinical practice in SSA.
Q-methodology
Ami-Narh and Williams11 used a mixed method approach called Q-methodology48–50 to understand participants’ perspectives on e-health. This methodology has been described as the scientific study of subjectivity.51–53 It was developed by William Stephenson to explore individuals’ perception relating to an issue of discourse.54,55 This methodology allows participants to interpret items relating to an issue based on their own practice.51,55–57 It combines both qualitative and quantitative techniques. Each participant completes a sorting exercise where he/she will rank order a set of items in the form of statements drawn from the discourse (what is known about the topic) according to how they perceive it influences their practice. Q-methodology is less prevalent in the technology literature, where survey studies are frequently used.10,58,59
Q-methodology places emphasis on understanding the viewpoints of participants by focusing on their subjective standpoint on issues affecting them and how this standpoint is shared with other participants within the same study environment. Barker55 identified that the traditional methods of studying subjectivities such as focus group discussions and interviews or quantitative surveys pose difficulties in data reduction to a meaningful account. She also argued that using surveys presents the viewpoints of the participants into a homogenous whole rather than shared or individual perspectives.
Thus, the strength of Q-methodology lies in its approach to the study of subjectivity and its limitation is evident in its non-generalisable findings. However, Thomas and Baas60 suggested that the concept generated from a Q-study could be used beyond the population of study.
This will be the first time Q-methodology has been employed in conjunction with the models of technology acceptance to explore HCPs’ adoption and use of e-health within clinical practice.
METHODS
The process of Q-methodology
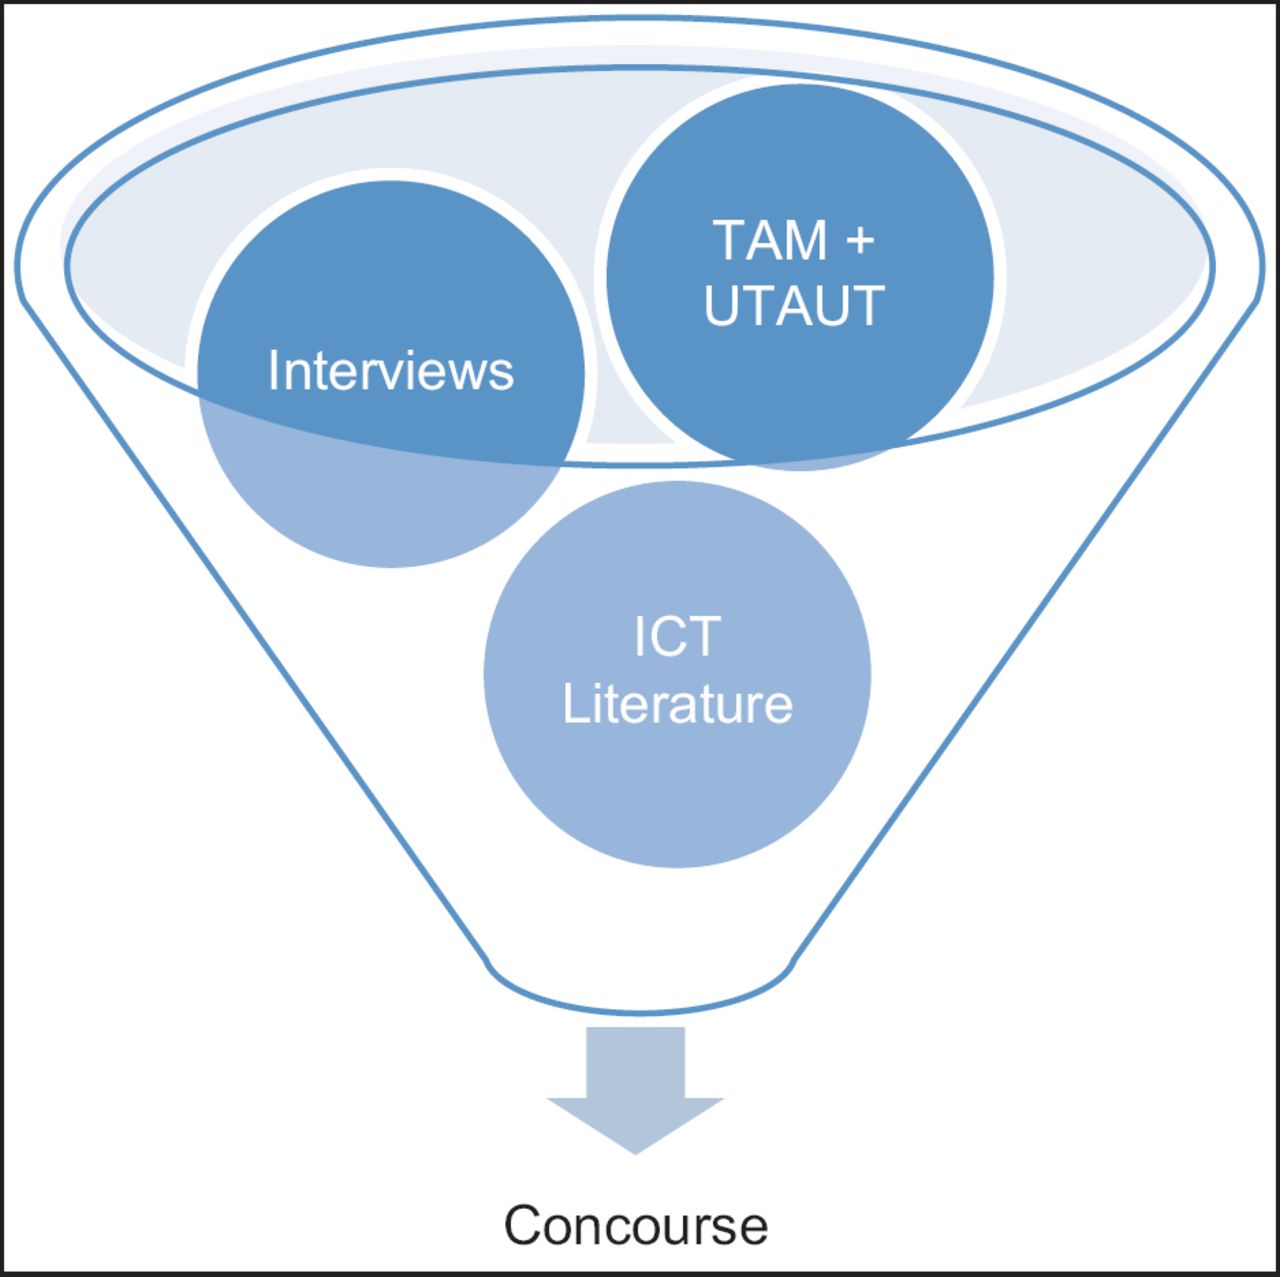
Various studies have outlined the steps involved in conducting a Q-study.53,55,57,59,61,62 Figure 3 shows the process from the formulation of a research question to the generation of a pool of relevant statements related to the context of study. This is called the concourse (Figure 4). The concourse is subsequently ‘filtered’ to develop the final sample items which in Q-studies are identified as the Q-set or the Q-sample.58,61,62 These statements are then provided to the participants to rank order. This ranking of the statements which is also called the Q-sorting is usually followed up by a post-sort interview53,63 to discuss the sorting exercise. The sorting exercise is then followed by a quantitative technique, that is, factor analysis which is called Q-factor analysis within Q-studies (because of its inverted factor analysis technique). The final stage of the Q-process is the interpretation which is based on how the Q-set items are ranked on the final shared opinions/viewpoints (factors) of participants or Q-sorts after Q-analysis. The interpretation is usually done in relation to statements or viewpoints which are shared. These are also referred to as consensus/agreement statements and the distinguishing statements or statements which characterise each factor when compared to another factor.51,52,62 This interpretation has recently been improved on with the use of a crib sheet.53 In using the crib sheet (representation of ranked statements viewpoint), the researcher adopts a holistic approach to characterise a shared viewpoint/factor based on how statement items are rank-ordered within it. There are available software dedicated to the analysis of Q-studies such as the PQMethod, Ken Q-analysis and PCQ for Windows. The analysis involves correlation, by-person factor analysis and computation of factors, respectively. During correlation, all finished sorts/Q-sorts are correlated with each other and then followed by an extraction process62 to identify factors (similar/shared viewpoints). The extraction could either be done using the centroid method or the principal component analysis (PCA), though Watts and Stenner53 state most Q-researchers opt for the former because of its ‘permissiveness’ in Q-studies and because it is more traditionally acceptable than PCA (p. 99). It should be noted that both methods provide similar results.53 After extraction, the factors are then rotated using either the Varimax or manual/judgemental rotation64 to understand the perspective of the participants’ viewpoint within a factor.

Since the pilot study aimed to refine and validate the statement items (steps 1 and 2 in Figure 3), complete Q-factor analysis (steps 3–6 in Figure 3) is not reported here. Nevertheless, the PQMethod software will be used for the main study during analysis because it is freely available and has been validated by most Q-methodology researchers.52,53
Moreover, the interpretation of the final factors will be done using the crib sheet and the distinguishing and consensus characteristics of the factors/viewpoints as already mentioned above. It is an iterative process which will be complemented by the post-sort interview data that will be collected during the main study.
The following sections will describe the Q-pilot study.
Developing the concourse
The concourse in Q is literally all that has been said or written about the subject or topic of discourse. The concourse may include paintings, photographs or even musical items.59
Prior to the development of the concourse, a research question must be identified to guide the entire research process. In doing so, the research question guiding this study was stated as: What are the factors that influence ICT use among HCPs in the clinical area in SSA? Since Q-methodology is an exploratory process,64 participants were able to identify the barriers and motivators to their use of ICT in healthcare or e-health resources. In developing the concourse for this study, the literature on models of technology acceptance, barriers and facilitators to ICT use in healthcare and informal interviews with experts in e-health were employed to build a rich pool of statements that relate to the research question.
At the end of the concourse development, 170 statement items were identified with six themes: PU/performance expectancy, PEOU/effort expectancy, social influence/ subjective norm, facilitating conditions, individual differences and behavioural intention (Figure 5). These themes, which were drawn mainly from the TAM and UTAUT, were adopted to guide the final statement selection for the Q-study.

Refining the statements
Traditionally, in Q-studies, the process of refining the statements involves both face and content validation of the concourse statements.59 The face validation involves refining the statements for clarity, readability and repetition. Content validity is done by experts within the subject of study. They check the items for ambiguity, applicability and completeness of the items within the context of study. This is usually followed up by a pilot study to understand if the items will capture what they are meant to capture during sorting by the participants.
In this study, statement refining was done by volunteer HCPs and experts within the host university. The sample statement items were reduced to 46 at the end of both face and content validation by the volunteers.
The participants and the ranking process
During the pilot study, volunteers were recruited to rank order the statement items. As with most qualitative studies, the participants in Q-studies (also called P-set or P-sample) are identified through purposive sampling. This means that participants who fall within the inclusion criteria of the study (must be HCPs who have had the experience of using IT within clinical practice). Five HCPs within the host university were recruited to participate in the pilot study.
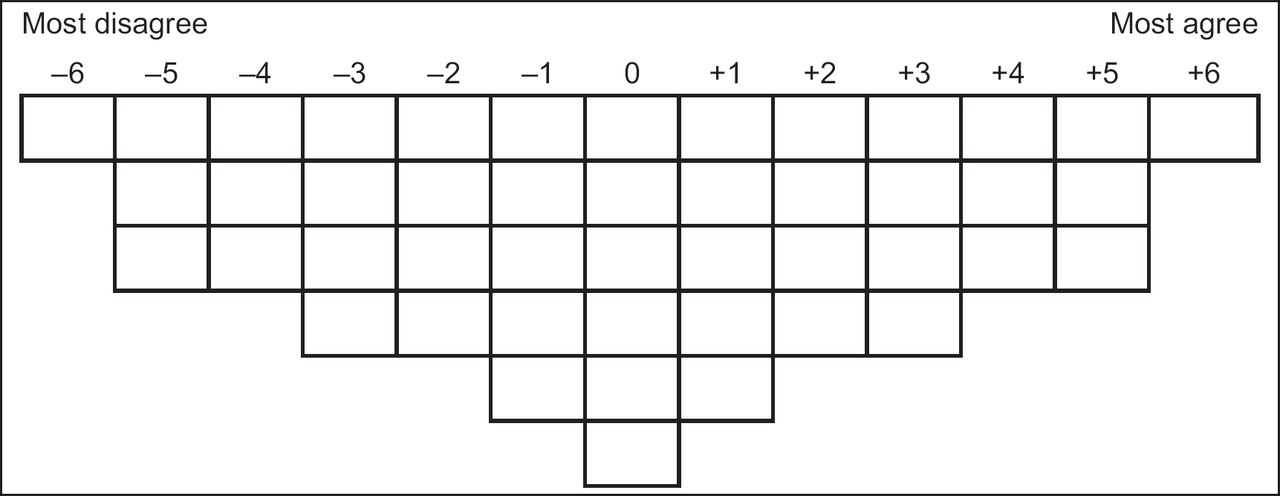
Each of the volunteers was provided with the 46 statement items printed on laminated cards of 5 cm × 8 cm, an instruction on how to do the sorting and an A0 size cardboard sheet with a defined sorting grid to rank the items based on how they agree or disagree with them along a 13-scale grid (Figure 6). At the end of the sorting exercise with the volunteers, a short interview was done to understand their views about the sorting process including if the instruction was clear and understandable, if the statements were also clear and complete (reflect all aspect of e-health).
RESULTS
Though all participants within the pilot reported that both the instruction and statements were clear and understandable, one statement was modified from ‘Using clinical information systems increases my chance of getting a raise’ was modified to ‘Using clinical information systems increases my chance of getting a praise or reward’. In addition, another statement ‘Using clinical information systems enhances my effectiveness in my job’ was removed, while another statement (My routine tasks prevent me from having time to use the clinical information systems) was suggested by a participant to make the items complete. This made the total Q-sample items to be 46 distributed across the six themes (Table 2).
The final 46 sample statements representing the Q-set will be printed on laminated cards as described above and provided to the HCPs within the study area in SSA to rank order. The ranking will be with regard to their respective agreement or disagreement of the statements in line with their clinical practice along the sorting grid (Figure 6). Together with a post-ranking interview, this will provide understanding on the shared perspectives (both similarities and differences) that the HCPs have about IT/e-health adoption and use in clinical practice in SSA.
DISCUSSION
Previous research studies have mainly used quantitative methodologies to demonstrate the relationship between e-health and HCPs. Though this approach may be important in testing new technologies, it might not be appropriate in understanding the views of the HCPs using such technologies.11 Thus, the use of both TAM and UTAUT together with Q-methodology as a new approach will provide an understanding of HCPs views about e-health and ICT in general within their respective clinical practices. This provides an alternative to the traditional methods of surveys and qualitative methods where limitations have been identified.55 It will also provide insight to unintended/undesired outcomes that may arise due to e-health adoption and use by HCPs in the clinical area in SSA.
Understanding the views of these HCPs after the main study will help inform decisions and address challenges about IT/e-health in clinical practice within this population in SSA or in a wider context.
CONCLUSION
This paper shows how TAM and UTAUT provide a well-theorised framework on which to base a comprehensive set of statements (Q-sets) exploring the views HCPs have on e-health adoption. This Q-set of 46 statements reflects the choices that HCPs consider and will be used in a study of HCPs e-health adoption in clinical practice in SSA.