Article Text

Abstract
Introduction Multimorbidity, or the co-occurrence of multiple chronic health conditions within an individual, is an increasingly dominant presence and burden in modern health care systems. To fully capture its complexity, further research is needed to uncover the patterns and consequences of these co-occurring health states. As such, the Multimorbidity Cluster Analysis Tool and the accompanying Multimorbidity Cluster Analysis Toolkit have been created to allow researchers to identify distinct clusters that exist within a sample of participants or patients living with multimorbidity.
Development The tool and toolkit were developed at Western University in London, ON, Canada. This open-access computational program (JAVA code and executable file) was developed and tested to support an analysis of thousands of individual records and up to 100 disease diagnoses or categories.
Application The computational program can be adapted to the methodological elements of a research project, including type of data, type of chronic disease reporting, measurement of multimorbidity, sample size and research setting. The computational program will identify all existing, and mutually exclusive, combinations and permutations within the dataset. An application of this computational program is provided as an example, in which more than 75,000 individual records and 20 chronic disease categories resulted in the detection of 10,411 unique combinations and 24,647 unique permutations among female and male patients.
Discussion The tool and toolkit are now available for use by researchers interested in exploring the complexities of multimorbidity. Its careful use, and the comparison between results, will be valuable additions to the nuanced understanding of multimorbidity.
- chronic disease
- comorbidity
- disease clustering
- multimorbidity
- multiple chronic conditions
Commons license http://creativecommons.org/licenses/by/4.0/
Statistics from Altmetric.com
Introduction
In examining the burden of multimorbidity, or the co-occurrence of multiple chronic health conditions within an individual, previous literature has focused on the descriptive counting of singular diseases and the prevalence of two or more and three or more chronic diseases.1–7 As such, the majority of research to date has been limited to reporting pairs or triplets of chronic disease occurrences. However, the full physical and psychological impact of multimorbidity can be highly dependent on the specific disease clusters that an individual is living with, in addition to the severity of disease and an individual’s ability to cope with the associated challenges.8–11 The analysis of cumulative interactions and the comprehensive reporting of the unique clusters occurring within a cohort will help lead to a more nuanced understanding of the complexity of multimorbidity.12–14 While epidemiological studies will likely show consistent trends in the rising prevalence of overall multimorbidity, research now must focus on understanding how specific clusters of diseases occur over time.
A computational analysis can be used to explore and detect all distinct profiles that exist among a sample of participants or patients within a health-related database (e.g. holding clinical, administrative or self-reported data). To detect these distinct profiles and because of the ongoing lack of a gold standard measure of multimorbidity, researchers must decide on the number and type of chronic disease categories that will be included. To inform this selection, a systematic review has indicated that at least 12 chronic diseases should be included to appropriately capture the burden of multimorbidity.15 Although including more than 12 chronic diseases in the study of multimorbidity is ideal, detecting all possible combinations (i.e. unordered clusters) and permutations (i.e. ordered clusters) within a cohort or dataset can become challenging to compute using common statistical programs (e.g. Statistical Analysis System, Stata or R). However, these results are valuable to report the prevalence of each unique cluster and to identify health outcomes from each cluster type.
The Multimorbidity Cluster Analysis Tool (herein referred to as Tool) and the accompanying Multimorbidity Cluster Analysis Toolkit (herein referred to as Toolkit) have been created to allow researchers to identify distinct clusters or clinical profiles that exist within a sample of participants or patients living with multimorbidity. Importantly, this tool can be adapted for use in research involving varying data sources, diagnostic or disease-reporting systems, multimorbidity measurements, sample sizes and research settings. Its intent is to facilitate a consistent approach to identifying sub-groups of participants or patients with multimorbidity, based on cluster type and cluster sequence. This information is driven by the data and the corresponding results should be interpreted carefully. While this information can be a helpful resource for research, clinical care and health policy decisions, the results should be interpreted within the appropriate context. Moreover, the term ‘disease category’ was used in this report as its purpose was not to differentiate among chronic disease categories, chronic or acute conditions, symptoms or risk factors.
DEVELOPMENT
The tool and toolkit were developed by a research team at Western University from the Department of Epidemiology and Biostatistics and the Department of Computer Science. The computational program was developed and prototyped using the de-identified electronic medical record (EMR) data from the Canadian Primary Care Sentinel Surveillance Network (CPCSSN) database. The accompanying toolkit was created to guide research teams in the appropriate adaptation of the computational program to the methodological details of their research project, including the measurement of multimorbidity and structure of the data type. The toolkit contains a number of screenshots of the input and output data structure to ensure high usability of the tool. A section detailing Frequently Asked Questions and an active email address are included within the toolkit to troubleshoot common issues.
The tool (which consists of JAVA code and an executable file) was developed and tested to support up to 250,000 individual records and up to 100 disease diagnoses or disease categories. The development of the tool was conducted in a progressive manner, starting with only 100 records, then 10,000 records and then 150,000 records. Some of the technical challenges that had to be overcome in the development of this computational program were ensuring efficient use of available computer memory and determining the proper and required structure of the input data file.
APPLICATION
As noted, the computational program can be adapted to the specific methodological elements of a research project. These methodological elements can vary in terms of the following: 1) type of data (e.g. databases containing clinical, administrative or self-reported information); 2) type of chronic disease information (e.g. identifying chronic diseases using self-reported diagnoses or specific classification systems such as the International Classification of Diseases or Read Codes); 3) measurement of multimorbidity (e.g. using a pre-determined list of chronic disease categories to measure multimorbidity); and 4) sample size (e.g. from 2 to approximately 250,000 individual records from participants or patients with multimorbidity). The computational program will identify all existing, and mutually exclusive, combinations and permutations within the submitted dataset. A description of each concept is included below. Because the concept of multimorbidity ensures that no single chronic disease diagnosis takes precedence or focus over any other co-occurring disease within an individual1,2, each chronic disease is of equal importance in the conceptualization and analysis of the data.
An example of an unordered cluster or combination of multiple chronic diseases would be those individuals (participants or patients) who have been diagnosed or have self-reported the same three chronic diseases (e.g. obesity, hypertension and cancer), but these diseases did not occur in the same sequence in each individual. For example, some individuals may have been diagnosed with obesity, then hypertension and then cancer. In comparison, other individuals may have been diagnosed with obesity, then cancer and then hypertension. Both of these sets of individuals would still be clustered into the same combination, but not the same permutation. An example of an ordered cluster or permutation of multiple chronic diseases would be those individuals (participants or patients) diagnosed with the same chronic diseases in the same sequence (e.g. obesity, then hypertension and then cancer, in that order). That is, all individuals who were diagnosed with obesity, then hypertension and then cancer would be clustered within the same permutation. In comparison, those individuals who were diagnosed with obesity, then cancer and then hypertension would be clustered within the same combination, but not the same permutation.
This computational program will conduct a record-level categorization to determine the frequency and type of mutually exclusive clusters of diseases (i.e. combinations and permutations) among a sample of individuals living with multimorbidity. Although the tool was developed with a focus on multiple chronic diseases, a similar approach could be carefully applied using a broader scope (e.g. incorporating risk factors or acute conditions). This analysis could also be tailored to exploring the burden of multimorbidity among a specific subset of participants or patients, which would adopt a co-morbidity approach to the analysis (e.g. focusing on a cohort of individuals all living with diabetes or depression). Regardless, it is important to highlight the fact that the results created by the computational program do not indicate any causal link between disease occurrences.
An analysis was conducted by the authors to demonstrate the use of the tool with the CPCSSN EMR database. This database holds de-identified, longitudinal, record-level clinical data for more than 1,000,000 primary health care patients across Canada.16 In this application, those patients with multimorbidity as of 30 September 2013 were identified using a list of 20 chronic disease categories. More than 75,000 individual records were input into the computational program, and a total of 6095 unique combinations and 14911 unique permutations were identified among female patients, while 4316 unique combinations and 9736 unique permutations were detected among male patients.17
Discussion
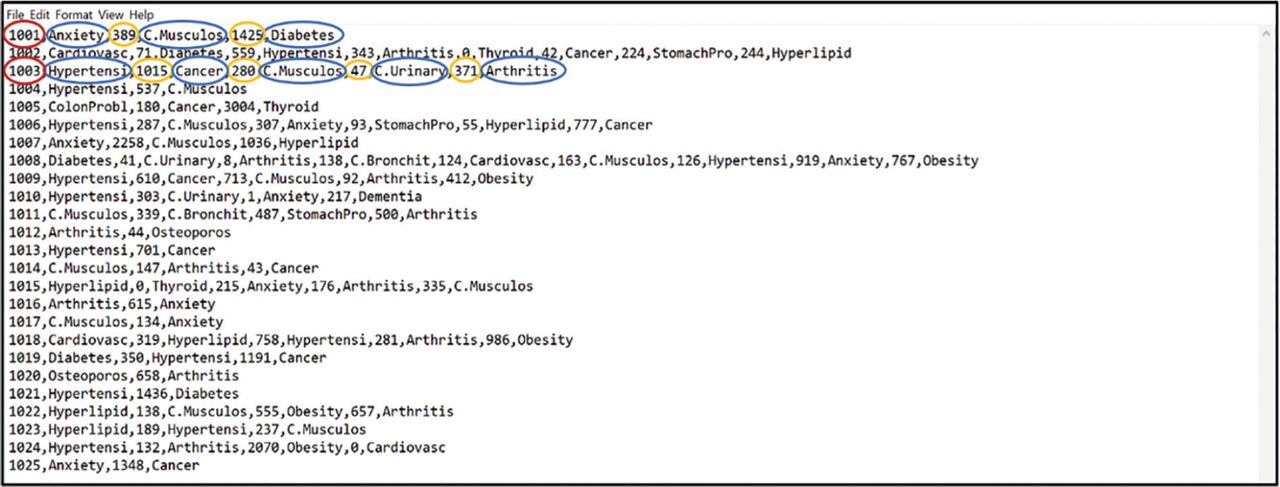
As a companion to the Multimorbidity Cluster Analysis Tool, the toolkit contains the following items: 1) a summary of the background, development and use of the tool; 2) a summary of the process of creating both the input and output files for the tool and 3) a section detailing Frequently Asked Questions. The process of using the tool is explained in two multi-part steps within the toolkit. Step 1 describes how to create the required structure of the input data file, and Step 2 describes how to run the computational program to produce valid output data files. The basic setup of the input data file was designed to allow for reasonable adaptability to methodological differences between studies. The structure of the input data file is included below and is depicted in Figure 1.

Identification Number, Disease 1, Time 1, Disease 2, Time 2, Disease 3, Time 3,…
The time that elapses between occurrences of a subsequent chronic disease can be explored using the tool (e.g. measured in whole years, months, days or hours), if the data are available. It is important that these time data must be included in the input data file as whole numbers (i.e. without any decimal places). If the date of diagnosis was not recorded in the dataset, or if the study design was a cross-sectional analysis, the tool can still be used. In order for the computational program to run properly, however, it is important to maintain a column for the time variable in the input data file. More specifically, all time data should be recorded as ‘0’. The structure of the input data file is included below:
Identification Number, Disease 1, Time 1, Disease 2, Time 2, Disease 3, Time 3, …
Where Time 1, Time 2 and Time 3 = 0
or
Identification Number, Disease 1, 0, Disease 2, 0, Disease 3, 0, …
The tool and toolkit presented in this report are now available for use by those interested in exploring the profile of participants or patients living with multimorbidity. Indeed, this work is beginning to inform a more nuanced understanding of the complexities of multiple chronic diseases, and the ordered and unordered sequence in which they occur. Both the tool and toolkit are accessible from www.csd.uwo.ca/faculty/bauer/ under the link called ‘Multimorbidity Toolkit’. For the program to run properly, a JAVA runtime environment is needed on the user’s system and can be downloaded for free online. Any questions or comments during the use of the tool and toolkit can be directed to mmclusteranalysis{at}gmail.com. The authors request that appropriate acknowledgement is made in any publications or presentations on studies that have used the tool. The appropriate citation information is provided in the Multimorbidity Cluster Analysis Toolkit.
References
Footnotes
Contributions Kathryn Nicholson, Michael Bauer, Amanda Terry, Martin Fortin, Tyler Williamson and Amardeep Thind contributed to study concept. Kathryn Nicholson drafted the manuscript. All authors contributed to the critical revision of the final manuscript and approved the final version of the manuscript submitted for publication.