Article Text

Abstract
Introduction The Informatics for Health congress, 24-26 April 2017, in Manchester, UK, brought together the Medical Informatics Europe (MIE) conference and the Farr Institute International Conference. This special issue of the Journal of Innovation in Health Informatics contains 113 presentation abstracts and 149 poster abstracts from the congress.
Discussion The twin programmes of “Big Data” and “Digital Health” are not always joined up by coherent policy and investment priorities. Substantial global investment in health IT and data science has led to sound progress but highly variable outcomes. Society needs an approach that brings together the science and the practice of health informatics. The goal is multi-level Learning Health Systems that consume and intelligently act upon both patient data and organizational intervention outcomes.
Conclusions Informatics for Health 2017 demonstrated the art of the possible, seen in the breadth and depth of our contributions. We call upon policy makers, research funders and programme leaders to learn from this joined-up approach.
Commons license http://creativecommons.org/licenses/by/4.0/
Statistics from Altmetric.com
Introduction
The Informatics for Health congress, 24-26 April 2017, in Manchester, UK, brought together the Medical Informatics Europe (MIE) conference and the Farr Institute International Conference. The conference was supported by the British Computer Society (BCS), as the national member body of the European Federation of Medical Informatics (EFMI).
Informatics for Health 2017 had the overarching theme of “Connected citizen-led wellness and population health” and five major subject tracks, each with a list of specific topic areas: (1) connected and digital health; (2) health data science; (3) human, organisational, and social aspects; (4) knowledge management; and (5) quality, safety and patient outcomes. Although health data science constituted 42% of submissions, as would be expected from the Farr community, the totality of contributions was quite evenly distributed across the sub-topics. The conference accepted a total of 535 submissions, a mixture of full papers, presentation abstracts, poster abstracts, demonstrations, panels and workshops. 118 full papers are published in the main proceedings.1 This special issue of the open access Journal of Innovation in Health Informatics contains 113 presentation abstracts and 149 poster abstracts from the conference. Please follow the citation guidance given at the end of this article.
Discussion
Digital technology offers enticing prospects: not only making frontline healthcare delivery better and safer, but producing high-quality, high-volume routine data as part of normal care provision. The ultimate vision is to build Learning Health Systems, where there is a virtuous circle of data-driven improvements to individual patient healthcare, service management and population health planning. Consequently, the last decade has witnessed huge investments in bio-health data science driven by the “Big Data” revolution, both in the UK and elsewhere. Separately, governments and care providers around the world are spending billions on health IT to deliver “Digital Health”.
Despite the obvious interdependency, the twin programmes of “Big Data” and “Digital Health” are not always joined up by coherent policy and investment priorities. The reality of many frontline care services was summed up well by the Richmond Group:2 although there is “huge potential that better use of healthcare data can unlock”, it is “currently being achieved in spite of the system, rather than because of it”. The scale of required change in healthcare services is formidable: the Wachter review of health IT in England3 highlighted that implementing digital health is “one of the most complex, adaptive changes in the history of healthcare, and perhaps of any industry”. Issues with the quality of the “Big Data” and how to extract actionable information from it were recurring themes in our conference contributions. Resolving data quality at source is essential to unlock the transformative potential of routinely-collected information.
Conclusions
Society needs an approach that joins up the science and the practice of health informatics, calling for thinking that is evidence-based and whole-system orientated. Informatics for Health 2017 contributed to that aim by bringing together academics, clinicians and industry from Europe and further afield via the EFMI and Farr communities.
Informatics for Health 2017 showcased the latest discoveries, innovations and evaluations in health informatics science and practice. As pressures on health and care systems increase with our ageing populations, policy makers, research funders and programme leaders would do well to understand and embrace the implications of the goal of Learning Health Systems – requiring the full spectrum of health informatics expertise in a joined-up approach.
Note: Please cite abstracts as: [Author surname, initials] [Abstract no.] in Scott, P. J. et al. (2017). Informatics for Health 2017: Advancing both science and practice, J Innov Health Inform, 24(1).
References
Randell, R. et al. (2017). Informatics for Health: Connected citizen-led wellness and population health. Stud Health Technol Inform, volume 235.
The Richmond Group of Charities. (2017) My data, my care. How better use of data improves health and wellbeing. https://richmondgroupofcharities.org.uk/sites/default/files/lr_5233_richmond_group_my_data_my_care_report.pdf
Wachter, R. et al. (2016) Making IT Work: Harnessing the Power of Health Information Technology to Improve Care in England. https://www.gov.uk/government/publications/using-information-technology-to-improve-the-nhs
Section 1: Presentation abstracts
Abstract no. 1 Health informatics in the undergraduate medical curriculum: a survey of current practice
Sarah Walpole, Hull York Medical School, York, UK
Amitava Banerjee and Paul Taylor, Farr Institute, London, UK
Introduction As the NHS moves towards ‘paperless’ operations and the ability to analyse and learn from ‘big data’ develops, it is increasingly important that clinicians understand health informatics (HI) and contribute to collection of high quality data at the clinical workface. Despite guidance from professional bodies, including the General Medical Council (GMC) and UK Royal College of Physicians, to incorporate HI into training, 2004 data suggest that medical schools were not providing adequate HI education. This study aimed to investigate which HI topics are taught in UK medical schools, which pedagogies are used, and what training gaps remain.
Methods To collect up-to-date data on the status of HI training, an online survey was developed informed by consensus guidance and recommendations of professional bodies. Senior academic staff and HI educators at 34 UK medical schools were invited to complete the survey. Reminders were sent after two weeks and two weeks before the survey closed. Quantitative and qualitative data were collated and analysed.
Results 26/34 (76%) of UK medical schools responded, of which 23 provided full information. Aspects of HI most frequently mentioned were literature searching and research governance. 17% of respondents felt there was little or no HI training in their medical school, although clinical record keeping was addressed by all medical schools.
Educators commented on the challenge of identifying HI teaching as use of HI is integral to many other medical knowledge and practice areas. HI was most commonly (76%) integrated across the curriculum rather than being taught as a stand-alone topic. HI is taught across all year groups, but most commonly taught in second year curriculum (71%). HI teaching is more frequently in core than optional teaching.
Pedagogies used to teach HI were self-directed learning (78%), lectures (70%), seminars (70%), informal clinical teaching (57%) and problem-based learning (22%). Respondents noted that HI is often in the hidden curriculum. 57% of respondents said that assessment of HI competency features in their curriculum. 41% said there had been a review of HI in their curriculum within the last two years. 9% said it had been over 10 years since the last review. 32% of respondents reported that students have low confidence that they can use HI adequately for their roles as doctors. Challenges were highlighted, including varying understanding of the term ‘informatics’, lack of HI capability among medical faculty and ensuring that students have access to clinical systems to use HI.
Conclusions In the most up-to-date survey of HI teaching in UK medical schools, there are three major findings. Firstly, many UK medical schools are not providing formal education or ensuring informal education on all aspects of HI that are outlined by the GMC as required learning. Secondly, there was considerable variation in content, pedagogy and timing of HI education across medical schools. Thirdly, HI is rarely assessed and the course content is not regularly updated. There is a role for national guidelines and further research to identify optimal pedagogies and timing for HI education.
Abstract no. 4 Competency gap analysis in health information system among health staff in a peri-urban health district in the ashanti region of Ghana
Richard Okyere Boadu, University of Cape Coast, Cape Coast, Ghana
Ernestine Akosua Addy and Peter Agyei-Baffour, School of Public Health, College of Health Sciences, Kwame Nkrumah University of Science and Technology, Kumasi, Ghana
Background Planning and decision making in health are largely influenced by health data quality and information generated by the routine health information system (RHIS). Routine health information (RHI) generated is integral and forms over 90% of health information. Yet RHI is faced with huge challenges, which reduce its decision making and planning yields. There is also limited empirical evidence on the magnitude of dysfunction in most health districts further deteriorating the utility of RHIS. The objective of the study was 1) to assess competency gap analysis of health staff’s performance in routine health information tasks and 2) to improve the competency level of health staff in performing RHIS tasks through application of the quality improvement process (QIP).
Methods A quasi-experimental, uncontrolled before and after study involving: assessment of participants’ competency level; development of a data QIP; training module to train staff to address any gaps identified, and follow up of 141 full time health staff in 18 health facilities, over a 12-month period in the Ejisu Juaben Municipal Health Directorate, was conducted. Data were analysed using the self-efficacy scale and the seven dimensions of the culture of information scale using Person correlation coefficients and Cronbach’s alpha, while test–retest reliability and sensitivity of the scale of selected variables were assessed through t-tests (Aqil et al., 2009). RHIS tasks were defined as competency in data analysis, data interpretation, and use of data.
Results The mean age of the respondents was 29.6 years (varying from 21 to 64 years), while the mean working experience of respondents was 5 years (varying from 1 to 37 years). The specialization of respondents includes doctor (5%), physician assistant (7%), nurses/midwives (45%), technical officers (34%), health information officers/biostatistician (7%) and other staff (1%). The study revealed huge competency gaps among staff amidst high confidence in undertaking RHIS tasks such as data analysis, interpretation and use of data, while their performance of RHIS tasks scored objectively, yielded low average scores of improvement in competency gaps, data analysis (–36.9%: +3.6%), and data interpretation (–42.2%: +9.8%) and use of data (–44.6%: +2.6%) in the baseline and endline evaluations, respectively. Generally, performance in the use of RHIS at the facility level improved significantly from 30 percent in baseline to 90 percent in the endline. Similar trends were observed in other RHIS parameters.
Conclusions The study concludes that the QIP drives the effectiveness and performance of RHIS. Large-scale implementation of QIP will necessarily strengthen the weaknesses of RHIS in resource poor settings.
Abstract no. 5 Disparities in the prevalence of autism spectrum disorder in western australia: opportunities for intervention in aboriginal children and all children from regional and remote areas
Jenny Fairthorne, British Columbia Children’s Hospital Research Institute, University of British Columbia, Vancouver, British Columbia, Canada
Helen Leonard, Jenny Bourke, Nick de Klerk, Andrew Whitehouse, and Carrington Shepherd, Telethon Kids Institute, Perth, Australia
Introduction While Aboriginal children suffer persistent disadvantages across most measurable aspects of health and well-being, the research indicates that they have an 80% lower prevalence of autism spectrum disorder (ASD) with comorbid intellectual disability (ID).
Method We examined prevalence rates of ASD with ID by Aboriginality and geographic remoteness and over time in order to clarify whether the lower rate among Aboriginal children is a function of differences in aetiology or access to diagnostic services and whether access is improving over time. We accessed linked registry data to access information on Aboriginality, remoteness, birth year and the diagnosis of ASD with ID in all children born from 1983 to 2005 in Western Australia. Non-parametric trend tests were used to assess trends of prevalence over time.
Results The prevalence of ASD with ID decreased with increasing levels of remoteness for all children, though the trend was only significant in non-Aboriginal children (possibly due to larger numbers). Over time, there were increasing trends for the prevalence of ASD with ID in non-Aboriginal children but not Aboriginal children.
Discussion Improved diagnostic opportunities for ASD with ID are needed for non-metropolitan children. A particular focus is needed in Aboriginal children to address the lack of increase over time in this population.
Conclusion With assistance from health-care workers to ensure access, more non-metropolitan children fulfilling the criteria for autism would be diagnosed and be eligible to receive suitable early interventions, other services and funding, which would improve these children’s life opportunities and the quality of life of their families.
Abstract no. 8 Increasing access to healthcare in rural Africa using telemedicine: using an mHealth system for diabetes patients in cameroon as a case study
Felix Holl, University of California, San Francisco, San Francisco, USA
Promise Munteh and Walter Swoboda, Neu-Ulm University of Applied Sciences, Neu-Ulm, Germany
Rainer Burk, Catholic University of Cameroon, Bamenda, Cameroon
Introduction Latest advances in smartphone technologies and increasing availability of mobile Web access have promoted the creation and expansion of mobile phone-based telemedical solutions, referred to as mHealth. Developing countries have been left behind from this trend due to a lack of infrastructure and availability of appropriate devices.1 With increasing availability of mobile Web, the most important requirement of mobile phone-based telemedicine systems has been met and in the researchers’ opinion, mHealth systems have the potential to reduce the negative effects of the shortage of medical staff in rural areas.
Methods A smartphone-based telemedical system for diabetes patients was tested in a field study at Mbingo Baptist Hospital in the rural and underserved Northwest Region of Cameroon in May 2014. The purpose was to investigate if such a system is generally feasible in resource-limited settings and if it can enhance the quality of care. A mixed-methods approach with a quantitative survey, semi-structured interviews and field observations was conducted. The system usability scale was used but adjusted to the study setting. A review was conducted for the feasibility aspects. Quantitative data were analyzed using descriptive statistics and qualitative data using grounded theory to discover trends and reoccurring themes.
Results The study had 10 participants, average age 56.1 years, ranging from 29 to 73. All participants owned a mobile phone, on average for 6.5 years. Three participants owned or had access to a computer. The post-study overall experience with the mHealth system rating by the patients on a scale from1 to 10 was at average 9.5. Most handling issues occurred in the first days of the study and primarily among elderly participants. After a few days and retraining, participants were comfortable using the system. One participant needed the regular support of his son. Several difficulties became eminent while conducting the study: 1) language barrier, 2) age, 3) impaired vision due to diabetic retinopathy and 4) analphabetism. The cost of mobile internet was very high at the time of the study, smartphones had only just started to become available and the cost of diabetic supplies was high.
Discussion The field study has shown that the system is technically feasible and can be a means to enhance to quality of care in the Northwest Region of Cameroon; however, it is not yet economically feasible. The benefits it offers do not outweigh the costs. Handling issues mostly occurred with elderly participants. Because non-communicable diseases disproportionally affect them, this must be kept in mind when roll out such tools. The study had certain limitations; to be able to fully evaluate the potential of the tested mHealth system in terms of enhancing the quality of care, an additional study with a significantly longer duration must be conducted.
Conclusion The mHealth system is generally feasible in resource-limited settings of developing countries and can be a means to increase the quality of care, but may currently not be feasible for economic reasons.
Abstract no. 10 Misclassification of glucocorticoid use within UK primary care electronic health records
Rebecca Joseph, NIHR Manchester Musculoskeletal Biomedical Research Unit, Central Manchester University Hospitals NHS Foundation Trust, Manchester, UK
Tjeerd van Staa, Arthritis Research UK Centre for Epidemiology, The University of Manchester, Manchester Academic Health Science Centre, Manchester, UK
Michal Abrahamowicz, Health eResearch Centre, Farr Institute for Health Informatics Research, The University of Manchester, Manchester, UK
Will Dixon, Department of Epidemiology, Biostatistics and Occupational Health, McGill University, Montreal, Canada
Introduction Drug safety studies are often set within databases of UK primary care electronic health records (EHRs) as these databases include information on all prescriptions issued in primary care. However, little is known about the extent to which patients take their prescribed medication. Non-adherence has clinical implications but can also lead to misclassification of drug exposure, potentially impacting the results of drug safety studies. To quantify misclassification in oral glucocorticoid (GC) use, we supplemented EHR with patients’ self-reported GC use.
Method The study was set within the Clinical Practice Research Datalink (CPRD), a UK primary care research database. Patients with rheumatoid arthritis with a current or recent oral GC prescription were recruited through their general practice. On a single occasion between September 2015 and April 2016, participants completed a paper diary reporting whether they had used oral GCs in the past 24 hours and the daily dose used. The GC status (on/off) and dosage according to the prescription data were compared to the self-reported GC use. Here, we describe misclassification of current status and dose.
Results 526 patients were invited to participate and 85 returned completed diaries, of whom 69% were female. The mean (standard deviation) age was 72 (10) years for men and 65 (13) years for women. 71 participants (84%) were correctly classified on or off GCs. Of the remaining 14 participants, six had received prescriptions for current GC use but did not report current use and eight had no active prescriptions yet reported current use. Those who were correctly and incorrectly classified did not differ in age. 23% of men and 14% of women were misclassified. 33 participants were correctly classified as current users (all of whom were taking prednisolone). Of these 33, we were able to determine the dose from the prescription data in 16 participants. 8/16 (50%) were taking the same dose as prescribed, six were taking more and two were taking less. For participants taking the same dose as prescribed, the median (range) dose was 7 (2.5–10) mg/day. Participants taking more than prescribed were prescribed 2–10mg/day but were taking 5–12mg/day. Those taking less were prescribed 5 and 15mg/day but were taking 3 and 10mg/day. The median (range) difference between the prescribed and reported doses was 2.5 (1–5) mg/day. For the six participants who were not prescribed GCs but reported taking them, the median (range) dose taken was 5 (3-30) mg/day.
Discussion The majority of participants were correctly classified as on/off GCs, although discrepancies between the dose prescribed and the dose taken were common. Quantifying misclassification in this way can be used to improve the accuracy of future research using EHR prescriptions. This was a small study of a specific patient population researchers should be cautious about generalising to other populations and medications. There are also clinical implications, as participants were both overusing and underusing their medications when compared to the prescription data.
Conclusion Primary care prescriptions appear to be a good representation of current GC exposure, but patients may not be taking the expected dose.
Abstract no. 13 Women of lowest and highest socio-economic deciles are at higher risk of hospitalizations associated with depression during the perinatal period
Jenny Fairthorne, Gillian Hanley, and Rollin Brant, British Columbia Children’s Hospital Research Institute, University of British Columbia, Vancouver, Canada
Tim Oberlander, Department of Obstetrics and Gynaecology, University of British Columbia, Vancouver, Canada
Background Research has consistently associated socio-economic status (SES) with depression, both generally and during the perinatal period. However, the relationship has not been studied with high-quality SES data and there are few studies investigating how SES is related to hospitalizations associated with depression prior during the perinatal period.
Objectives We aimed to explore the relationship between SES and maternal depression during the perinatal period.
Methods We accessed population-based data of women who delivered live infants in British Columbia from 1999 to 2009. We examined the relationship between SES and hospitalizations during the periods 12 months before, during and 12 months after the pregnancy. Birth records and census data were linked to the records of hospitalizations and SES deciles were determined from income data. We used multinomial logistic regression, with the explanatory variables maternal age and parity, to calculate odds ratios and a non-parametric trend test to investigate trends over SES. STATA14 was used for all analyses.
Results In our study were 348,273 pregnancies. From 12 months before conception to 12 months after the birth, disadvantaged mothers from deciles 1 to 2 had significantly increased odds of a hospitalization associated with depression [AOR = 1.64 (CI = 1.33, 2.01) P-value < 0.0005 AOR = 1.36 (CI: 1.10, 1.69) P-value = 0.004]. Odds were higher prior to pregnancy with the most disadvantaged mothers having nearly twice the odds of a hospitalization associated with depression [AOR = 1.93 (CI: 1.23, 3.05) P-value = 0.004]. During the pregnancy, over deciles 1–10, there was a significant negative trend for the odds of hospitalizations associated with depression (P-value = 0.001). Over all other periods, there were significant negative trends from decile 1 to a middle decile (P-values < 0.0005–0.002). From a middle decile to decile 10, there were weaker positive trends over these periods (P-values: 0.011–0.375).
Discussion In line with previous research, the most disadvantaged mothers had highest odds of a hospitalization associated with depression during all time periods. In all but the prenatal period, we found a two-phase trend with odds of a hospitalization being highest in the most disadvantaged mothers and the risk decreasing with increasing SES from the lowest decile to a middle decile. Phase 2 began with a middle decile, and over increasing deciles, the risk increased and mothers from decile 10 had highest odds of hospitalization during this second phase.
Conclusion The most disadvantaged mothers were at highest risk of a hospitalization associated with depression during the periods around and during pregnancy. The most advantaged mothers were also at higher risk than mothers of middle SES in all but the prenatal period. Further research is implicated to explore why the most advantaged mothers are at increased risk compared to middle decile mothers and their protection during pregnancy.
Abstract no. 20 Public attitudes to linkage and sharing of health data
Joanne Given and Helen Dolk, Ulster University, Newtownabbey, UK
Gillian Robinson, Ulster University, Londonderry, UK
Introduction There is huge potential for research arising from the effective linking and sharing of administrative data collected by government and other organisations. However, the use of such data presents challenges in terms of protecting individual privacy. Our objective was to capture a baseline of public attitudes in Northern Ireland towards health data linkage and sharing, which can then be reassessed at intervals to measure changes in public trust and understanding.
Method The Northern Ireland Life and Times (NILT) survey is an annual survey of the attitudes of the public of Northern Ireland to a wide range of social issues. Between October and December 2015, 1,202 respondents completed the NILT survey. The 2015 survey included a module of questions and vignettes relating to the theme of ‘public understanding and views of sharing of health data, data linking, and relevant safeguards’. A systematic random sample of addresses was used to identify respondents. Interviews were then carried out face to face in the respondent’s home via computer assisted personal interviewing. Descriptive statistics and Chi squared tests were used to explore the responses.
Results GP surgeries (91%) and the NHS (86%) were most trusted to ‘keep information or data that they have about people secure and use it appropriately’. Smaller percentages were prepared to trust government departments (73%) and academic researchers (72%) but trust plummeted when it came to commercial organisations (41%) and charities (51%). The majority of respondents supported sharing of identified health data in order to improve services. Over 95% were in favour of sharing data within the health service by means of the electronic care record, and over two thirds of people were in favour of health information being shared to improve access to benefits or other services.
There was a high level of support for all of the data protection measures currently employed for linking data for research. More than two thirds supported the concept of sharing de-identified health data for research and linking these to data from other sources, where there was public benefit. Respondents were less positive towards data sharing with commercial organisations and 50% believed the data protection safeguards, implemented for academic researchers, should be greater for commercial organisations. However, there was evidence that where there is great public benefit, there is greater support.
Nearly one-third of respondents felt that data should only be shared for research if there is explicit consent, even if this means that the research is impossible. This strict attitude towards the need for consent was associated with low trust in organisations including the government and NHS.
Discussion The results of this survey represent the expressed attitudes of people given their current experience and knowledge of these issues. This is a different approach to qualitative research, which seeks to hold in depth discussions with people to gauge what their attitudes would be if they fully understood the issues. Both types of research are needed.
Conclusion Public support for data sharing is linked to trust in organisations data protection measures and the perception of public benefit.
Abstract no. 21 Incorporating previous addresses into environmental epidemiology using routine data
Gareth John, NHS Wales Informatics Service, Cardiff, UK
Objective Environmental epidemiology is concerned with the discovery of the environmental exposures that contribute to or protect against injuries, illnesses, developmental conditions, disabilities, and deaths and identification of public health and health care actions to manage the risks associated with harmful exposures.
Epidemiological studies of this type require the levels of exposure for each member of the study population to be measured, along with various health outcome measures of interest. Standard in-depth studies may involve a series of questionnaires and in-depth interviews and can be costly and time consuming. As a result, these studies can be limited in terms of size and can therefore lack statistical power.
In contrast, routinely collected administrative data allow studies to be carried out at a population level, with little or no additional burden in terms of data capture. However, there can be limitations in terms of the breadth of information contained about individuals, in particular in relation to their previous places of residence, work or study, and typically, administrative datasets only contain information about the place of residence of an individual as at the time of the associated event or transaction.
In order to address some of these administrative data limitations, however, health population registers may be used to provide details of about previous residences of individuals. The Welsh Demographic Service (WDS) contains a full history of changes to residential addresses for all Welsh residents going back to 1992, and we will demonstrate how these can be used as part of an epidemiological analysis, which uses only routinely collected administrative data.
Approach A pseudonymised version of the WDS data is accessible to NHS Wales analysts and users of Swansea University’s SAIL databank, and this data can be used to ascertain an individual’s address at any point in time, for example on a particular census date of choice or during a specified period of time. This information can easily be linked to other health (or non-health) datasets at an individual level.
A case-control approach will be demonstrated, with cases and controls apportioned to geographic areas in accordance with the amount of time individuals have lived in those areas.
This approach can be applied equally well to hypothesis-based studies, where the focus is on the comparison of disease risk in ‘exposed’ versus ‘non-exposed’ areas, or to more general disease surveillance, for which odds ratios can be produced for different geographic areas.
Abstract no. 29 Informatics in clinical practice: developing an approach to identify ‘at risk’ COPD patients using clinical records
Matt Johnson and David Culliford, NIHR CLAHRC Wessex Methodological Hub, Faculty of Health Sciences, University of Southampton, Southampton, UK
Lucy Rigge, University Hospitals Southampton NHS Foundation Trust, Southampton, UK
Introduction Chronic obstructive pulmonary disease (COPD) is a high-prevalence, smoking-related lung condition. It is the second most common cause of emergency hospital admission in England, and one of the most expensive, representing a significant NHS expenditure. Utilising data already routinely collected in primary and secondary care, the dyspnoea, obstruction, smoking and exacerbation (DOSE) index is a composite measure of severity in COPD and has been validated as a risk predictor for mortality, hospitalisation and poor health status.
Method The Hampshire Health Record Analytical database is an electronic NHS database containing anonymised routine clinical data for approximately 75% of the Hampshire population (or ∼1.4 million patients). It is a patient-centric database linking data from various sectors of the local health system. We used the database to identify and describe prevalent cases of COPD as on 1 January 2010 to retrospectively apply the DOSE index to allocate a risk score to all diagnosed patients and to observe variations in predicted risk among patient groups. We sought to generate a maximum of four repeated DOSE scores to the end of 2014, separated by a minimum interval of one year, to enable longitudinal assessment of risk and its association with ongoing clinical outcomes and health status.
Results We identified 13,608 patients with a diagnosis of COPD. Longitudinal data was available from our data source to generate at least one DOSE score for 10,143 patients (or 75% of the patient cohort), at least two for 7,875 (58%) and at least three for 5,190 (38%).
Discussion A collaborative working approach drawing upon informatics, statistical and clinical expertise has enabled development of a method for calculation of the DOSE score using data that are already routinely collected and coded within primary and secondary care settings. Having generated at least one DOSE score for 75% of the patient cohort and at least two for over 50%, we have shown that there is a wealth of data available for use in this manner.
Our approach could be modified to use only primary care data, in which case it could be replicated natively within most primary care practice management systems as, while software systems differ, a single coding system is used to record clinical activity across the majority in England. It could therefore simplify in-practice risk stratification in COPD, allowing for more efficient and proactive allocation of clinical resource.
Conclusion DOSE scores could be used in practice to risk stratify patients with COPD, and we have shown that this is possible within a secondary data environment. Our approach could potentially generate benefits for clinicians and patient if used in practice.
We have demonstrated that multidisciplinary teams involving informaticians and clinicians can enable the secondary use of routinely collected clinical data, emphasising the value that informatics can bring to clinical practice in times of limited clinical resources.
Abstract no. 30 Impact of age on relative survival following transcatheter aortic valve implantation
Glen Martin, Matthew Sperrin, William Hulme, and Iain Buchan, University of Manchester, Manchester, UK
Mamas Mamas, Keele Cardiovascular Research Group, Stoke-on-Trent, UK
Introduction Aortic stenosis (AS) is the most common valve pathology in Europe and North America and occurs, among other factors, due to an age-related degeneration of the aortic valve. While surgical valve replacement is the mainstay treatment for AS, transcatheter aortic valve implantation (TAVI) is effective for patients considered high operative risk. Consequently, TAVI patients are older and have more comorbid conditions than those undergoing alternative treatments. Therefore, the long-term mortality profile is difficult to assess since by virtue of age and multi-morbidity, the risk of death from other causes is high. We aimed to report relative survival (RS) rates following TAVI, by accounting for background mortality risks in a matched general population. RS methods are frequently used in studies of survival post cancer diagnosis, but are rarely used in acute settings.
Methods National cohort data (n=6420) from the 2007 to 2014 UK TAVI registry were matched by age, sex and year to country-specific mortality rates for England and Wales (population 57.9 million). The Ederer II method was used to relate patient survival to their matched general population.1 Novel visualisations were created by deriving daily hazard ratios (HRs) of observed against expected hazard, which were plotted through time. A smoother was applied to the HRs, with the time transformed onto the logarithmic scale to capture the initially high and rapidly decreasing mortality rate immediately following the procedure. Modelling of RS was undertaken using a flexible parametric approach that was adjusted for background mortality rates.
Results All-cause 30-day, one-year and three-year survival estimates were 94.7%, 83.4% and 64.5%, respectively, and the corresponding RS rates were 95.4%, 90.2% and 83.8%. One year post TAVI, the hazards in >85 age group were not significantly different to those of the general population and by three years actual survival rates were comparable. Neither the <80 or the 80–85 groups’ hazards returned to that of the general population within three years after TAVI. The hazards were significantly lower for the 80–85 (HR 0.55, 95% CI: 0.44–0.68) and >85 (HR 0.34, 95% CI: 0.27–0.42) age groups compared with the <80 age group after adjusting for population hazard. The flexible parametric model highlighted that compared with those aged <80 years, the >85 age group were experiencing significantly less excess hazard throughout follow-up, and those aged 80–85 had significantly less excess hazard after 1.5 years post TAVI.
Discussion and Conclusion This study demonstrates high RS following TAVI. Although the hazards of mortality relative to the general population were high immediately following the procedure, they declined rapidly. After surviving the initially high-risk period following TAVI, survival in patients aged >85 approximated that in the matched general population by three years. While selection bias needs to be considered, the current analysis demonstrates the continued use of TAVI in elderly patients given the current careful selection practices within the UK.
Reference
Ederer F, Axtell LM and Cutler SJ. The relative survival rate: a statistical methodology. Journal of the National Cancer Institute Monographs 1961;6:101–21.
Abstract no. 32 A population-based study examining injury among older adults with and without dementia
Lynn Meuleners and Michelle Hobday, Curtin University, Perth, Australia
Introduction As the world’s population ages, the prevalence of dementia is also increasing. Evidence suggests that those living with dementia have worse outcomes from injury, including higher mortality rates as well as higher rates of institutionalisation following injury. This study aimed to estimate the incidence and risk factors for injuries among older adults, aged 50+, with and without dementia.
Method A retrospective, population-based study was undertaken using data from the Western Australian Data Linkage System (WADLS) from 2001 to 2011. Cases included 29,671 (47.9%) older adults with an index hospital admission for dementia. Comparison participants without dementia included a random sample of 32,277 (52.1%) older adults identified from the state electoral roll. A hospital admission to a metropolitan tertiary hospital for at least 24 hours with a diagnosis of an injury (ICD-10 codes S00.0 to T98.3) was counted as ‘hospitalisation due to an injury’ for the purposes of the study. Poisson regression with robust standard errors was used to examine risk factors for injuries in those with and without dementia, after adjusting for relevant confounders.
Results The age-standardised injury rates for older adults (60+ years) were 117 per 1,000 population with dementia and 24 per 1,000 population without dementia. The majority of injuries were caused by falls for both the dementia (94%) and non-dementia (87%) groups followed by transport-related injuries (2.6% and 5.6%) and burns (0.87% and 13.4% for dementia and non-dementia groups, respectively). The results of the multivariable analysis found that older adults with a diagnosis of dementia had over double the risk of hospital admission for an injury compared to those without dementia (IRR=2.05 95%, CI=1.96–2.15). Other significant predictors of an admission for all-cause injury were those aged 85+ years (IRR=1.43 95%, CI=1.13–1.81), being unmarried (IRR=1.07 95%, CI=1.03–1.12) and a history of falls in the year prior to the index hospitalisation (IRR=1.03 95%, CI=1.01–1.06). Females were at reduced risk of an admission to hospital with an injury (IRR=0.92 95%, CI=0.87–0.97).
Discussion Older adults with dementia were at increased risk for a hospital admission due to an all-cause injury, highlighting the role of cognitive impairment on injury risk. Higher risk of injury with increasing age and a history of falls may be related to poorer balance and muscle strength.
Conclusion Multifactorial injury prevention programs would benefit older people both with and without dementia, targeting those over 85 years, living alone and with a history of previous falls.
Abstract no. 42 Causal inference in observational clinical studies using bayesian additive regression trees
Thierry Wendling and Blanca Gallego Luxan, Australian Institute of Health Innovation, Sydney, Australia
Kenneth Jung and Nigam Shah, Stanford Centre for Biomedical Informatics Research, Stanford, USA
Introduction There is growing interest in using observational clinical data to quantify treatment effect heterogeneity in ‘real-world’ practice conditions and generate evidence for personalised medicine. This requires causal inference methods that can estimate heterogeneous treatment effects (HTEs) while controlling for confounding under potentially high-dimensional and sparse conditions. The machine learning method Bayesian Additive Regression Trees (BART) has shown good potential for estimating the HTE in observational studies.1 However, when applied naively to an observational sample, it can suffer from bias due to regions of the feature space lacking common causal support (CCS).2 The aim of this study was to evaluate the impact of confounding on the relative performance of BART, a BART approach to target the CCS (BART-CCS)2 and propensity score matching (PSM), through realistic simulations of observational clinical studies.
Method Covariate data for type 2 diabetes patients were generated with the Observational Medical Dataset Simulator Generation 23 (698 features for 50,000 patients). The 20 densest features were used to define hypothetical models for a binary treatment assignment and a binary outcome. The performance of the three methods in estimating the in-sample average treatment effect (ATE) and predicting out-of-sample individual treatment effects (ITEs) (not applicable for PSM) was compared across three confounding scenarios (low, moderate and high) with highly HTE.
Results Compared to PSM, BART produced less accurate ATE estimates in the moderate and high confounding scenarios and significantly worse coverage rates for the corresponding 95% intervals (in the high confounding scenario, the relative bias was 19.3% for BART versus 11.5% for PSM, with a coverage rate of 0% for BART versus 97% for PSM). However, discarding individuals lacking CCS prior to BART-based inference (the BART-CCS approach) helped reduce bias and remarkably improved coverage (relative bias of 3.6% and coverage rate of 73% in the high confounding case). In addition, while BART’s ability to confidently predict the ITE was significantly decreased with increasing confounding, BART-CCS produced accurate predictions with good individual-level coverage properties across all three scenarios (coverage rate of 64% for BART versus 81% for BART-CCS in the high confounding case).
Discussion BART-CCS is a practical machine learning method that enables accurate and robust estimation of the ATE and prediction of the ITE using high-dimensional and sparse observational data. It would be interesting to further compare its performance with that of recently proposed algorithms designed specifically to estimate HTE under high dimensionality (e.g. causal forest4).
References
Hill JL. Bayesian nonparametric modeling for causal inference. Journal of Computational and Graphical Statistics 2012;10:217–40.
Hill J and Su Y-S. Assessing lack of common support in causal inference using Bayesian nonparametrics: implications for evaluating the effect of breastfeeding on children’s cognitive outcomes. The Annals of Applied Statistics 2013;7:1386–1420.
Murray RE, Ryan PB and Reisinger SJ. Design and validation of a data simulation model for longitudinal healthcare data. AMIA Annual Symposium Proceedings 2011: 1176–85.
Wager S and Athey S. Estimation and inference of heterogeneous treatment effects using random forests. Cornell University Library. Available from: https://arxiv.org/abs/1510.04342.
Abstract no. 44 Respiratory infections as vascular triggers: time series analysis of hospital admission with myocardial infarction and laboratory-confirmed respiratory infection in England (2004–2015)
Ruth Blackburn, Andrew Hayward, and Charlotte Warren-Gash, University College London, London, UK
Richard Pebody, Public Health England, London, UK
Introduction Acute respiratory infections diagnosed in primary care are associated with increased risk of subsequent myocardial infarction (MI). However, the underlying microbiology is poorly characterised as few studies are able to identify the causative pathogen. Understanding the role of different respiratory pathogens as vascular triggers will help guide optimal vaccination and treatment strategies. We used laboratory-confirmed respiratory infections to explore temporal associations between different respiratory viruses and MI hospital admissions.
Methods We undertook a time series analysis of English national data on hospital admissions for MI (stratified by age: 45–64, 65–74, 75+ years), laboratory-confirmed viral respiratory infections and environmental data for 2004–2015. Weekly counts of MI admissions were modelled using Poisson regression with weekly counts of respiratory viruses (influenza, parainfluenza, rhinovirus, respiratory syncytial virus (RSV), adenovirus or human meta-pneumovirus (HMPV)) investigated as predictors. Model fit (using AIC) guided the multivariable modelling strategy with either splines or deciles for weekly temperature and absolute humidity. Seasonal variation in MI was modelled using categorical calendar quarter, month, Fourier-terms or splines. Lags of ±3 weeks between the exposure and outcome were investigated.
Results Weekly counts of hospital admissions for MI in adults aged 45+ years averaged 1347 per week (IQR 1217–1541) with median counts of all respiratory viruses in all ages totalling 226 per week (IQR 92–506). Multivariable models were adjusted for quarterly variations in MI admissions and deciles of maximum temperature and mean absolute humidity. Lags of 0 to –3 weeks improved model fit. There were small but strongly significant positive associations between MI in those aged 65–74 years and adenovirus, parainfluenza, rhinovirus and RSV (adjusted IRRs of 1.001, 1.0005, 1.0003 and 1.0001, respectively, all with p ≤ 0.009) with similar results for MI at age 75+ years. HMPV and influenza were associated with MI outcomes only in those aged 75+ years (adjusted IRRs of 1.001 (p < 0.0001) and 1.00005 (p = 0.002), respectively). 0.4 to 3% of MI admissions in 65+ years were attributable to infection, with 2%–7% of MIs attributable to infection during weeks with the highest burden of infections. No respiratory viruses were associated with MI in the under 65s.
Discussion This ecological study showed small but strongly significant associations between all respiratory viruses investigated and MI hospitalisations in the elderly. We identified differential effects of virus type in different age groups, with marked associations between infection and MI admissions in the over 65s. Trials show a marked cardio-protective effect of influenza vaccination. The small magnitude of association identified here may reflect the use of laboratory-confirmed surveillance data, which has high specificity but low sensitivity. Future studies using individual level linked data will provide further insights into the timing of exposure and nature of the outcome.
Conclusion Our results suggest that between 0.4% and 3% of MI admissions in the over 65s may be attributable to respiratory infection, but that this figure may rise to 7% during weeks with high levels of infection. The identification of differential effects of virus type and age group lends support to age-targeted influenza vaccination strategies and for further evaluation of antiviral impact on cardiovascular outcomes.
Abstract no. 49 Using feedback intervention theory to design clinical dashboards
Dawn Dowding and David Russell, Columbia University, New York, USA
Nicole Onorato, Robert Rosati, and Jacqueline Merrill, Visiting Nurse Service of New York, New York, USA
Yolanda Barron, VNA Health Group, Red Bank, USA
Introduction Providing performance feedback to clinicians on a variety of quality standards is thought to influence clinician and organizational behaviour leading to improved quality of care. One approach is through the use of clinical dashboards, a form of health information technology (HIT), that use data visualization techniques to provide feedback on quality metrics. In this presentation, we will outline a theoretical approach to the design of feedback interventions of feedback intervention theory (FIT)1 and describe how it can be used to design dashboards for home healthcare nurses.
Method A summary of the approach taken to ensure that the dashboard fits with FIT is provided in Table 1. Focus groups were conducted with nurses (n = 61) working in a large not-for-profit home care agency to identify actionable feedback goals. An online survey (n = 196) was utilized to identify individual characteristics such as numeracy and graph literacy that may affect understanding of dashboard visualizations.
Results Items that ranked highest for the need for feedback were for tracking of vital signs, symptoms and weight changes and alerts for patients at high risk for re-hospitalization.
There was an interaction between numeracy, graph literacy and comprehension. Nurses with low numeracy were less able to interpret line graphs, those with low graph literacy were less able to interpret spider graphs, and those with low literacy and numeracy were less able to understand information presented in a table.
Discussion Dashboards need to be designed using a theoretical framework that can explain how visualized data may influence behavior, and with the characteristics of the user in mind. The results of this study highlight how individual differences in users, such as their numeracy and graph literacy, may impact on their ability to comprehend data presented in a visualized format. In addition, it is important to ensure that feedback matches the information needs of clinical users.
Conclusion FIT can be used as the basis for the design of HIT such as clinical dashboards. The results of this study have been used to design dashboards at the point of care for home care nurses, incorporating design issues such as information available in both graphs and numerically. These dashboards are being evaluated for their impact on nurse behavior and patient outcomes.
Reference
Kluger A and de Nisi A. The effects of feedback interventions on performance: a historical review, a meta-analysis, and a preliminary feedback intervention theory. Psychological Bulletin 1996;119(2):254–84.
Abstract no. 51 Sociodemographic variations in the incidence of clinically diagnosed eczema, 1997–2015: a United Kingdom population-based cohort study
Lu Ban, Kim Thomas and Tracey Sach, University of Nottingham, Nottingham, UK
Sinead Langan, London School of Hygiene andTropical Medicine, London, UK
Katrina Abuabara, University of California, San Francisco (UCSF), San Francisco, USA
Alyshah Abdul Sultan, Keele University, Keele, Staffordshire, UK
Emma McManus and Miriam Santer, University of East Anglia, Norwich, UK
Sonia Ratib, University of Southampton, Southampton, UK
Introduction Eczema is one of the most common chronic conditions in children and associated with high morbidity. However, population-based estimates of incidence of eczema in children are lacking in the United Kingdom. This study aims to estimate the incidence of clinically diagnosed eczema in children, overall, and in children with different sociodemographic characteristics.
Methods We established an open cohort of children under the age of 18 between April 1997 and March 2015 years and who registered with their general practices within 3 months of birth from the Clinical Practice Research Datalink. We identified a child as having clinically diagnosed eczema using a previously validated algorithm based on both diagnostic and treatment codes and included the first diagnosis only. We also conducted sensitivity analysis using different definitions of eczema (e.g. excluding transient eczema in the first year of life). We calculated the overall incidence and also the incidence stratified by age, gender, socioeconomic status, ethnicity and calendar year and performed Poisson regression to calculate adjusted rate ratios (aRR). Since there were missing values for ethnicity, we conducted a complete case analysis first and then performed multiple imputation for ethnicity and compared the results to the complete case analysis.
Results A total of 675,087 children were identified of which 98,082 (14.5%, 95% confidence interval 14.4-14.6%) had eczema at some point during the follow-up period. Incidence of eczema in children was 2.8 per 100 person-years (2.8–2.9) and the annual incidence rate was stable during 1997–2015. The incidence rate was highest in the first year after birth (13.8 per 100 person-years, 13.7–13.9) and then decreased substantially afterwards to less than 1 per 100 person-years by age 5 years. Boys had a 40% higher rate than girls (aRR=1.4, 1.3-1.4) in the first year after birth, but a similar rate (aRR=1.0, 1.0–1.0) at age 1–4 years and a 30% lower rate (aRR = 0.7, 0.7–0.8) at age ≥5 years. Compared to children with lowest socioeconomic status, children with highest socioeconomic status had a 20% higher incidence rate in the first five years of life (aRR=1.2, 1.2–1.2 in children <1 year old and aRR = 1.2, 1.1–1.2 in children 1–4 years old), but there was no difference in children ≥5 years. Children from different non-white ethnicity groups had in general a twofold to threefold increased rate of eczema in the first year of life than white children but the difference was smaller afterwards.
Discussion Due to the nature of population-based study design, we were unable to validate every eczema case. However, the algorithm for identifying eczema used in our study have been validated in another study using data from The Health Improvement Network which shows a 90% (83%–96%) positive predictive value for defining prevalent eczema in children. We also conducted two sensitivity analyses by changing our eczema definition and found very similar patterns of results compared to the results from the main analysis.
Conclusion Incidence was high in the first year of life, especially in boys, non-white children and children with high socioeconomic status. These findings can usefully inform further research and prevention strategies.
Abstract no. 57 Standardisation of drug data preparation to improve the efficiency and transparency of pharmacoepidemiology
Rebecca Joseph, NIHR Manchester Musculoskeletal Biomedical Research Unit, Central Manchester University Hospitals NHS Foundation Trust, Manchester, UK
Ruth Costello, Kamilla Kopec-Harding, Ian Douglas, and Will Dixon, Arthritis Research UK Centre for Epidemiology, The University of Manchester, Manchester Academic Health Science Centre, Manchester, UK
Colin McCowan, London School for Hygiene and Tropical Medicine, London, UK
Mark Lunt, Robertson Centre for Biostatistics, University of Glasgow, Glasgow, UK
Introduction Routinely collected electronic health records (EHRs) have been widely used in studies of drug effects. It is necessary to clean and transform prescription data held in EHR databases before they can be used in analyses. Research groups may spend a long time developing data preparation strategies and specifying their own assumptions, while other research groups will be working with similar datasets in parallel, developing their own unique strategies and assumptions. Data preparation is generally not reported in detail, meaning it is unclear what steps have been taken and preventing reproducible research. The process is thus inefficient, lacks transparency, and can lead to differing results. We are developing a generic algorithm that will standardise the process of drug data preparation using EHRs. The aims are to develop and share the algorithm as a reusable tool to allow the efficient preparation of drug data, and to present a reporting framework that would enable replication of the cleaning process.
Methods A framework and analysis script has been developed. We are collaborating with research groups across the Farr Institute and UK Research in Musculoskeletal Epidemiology network to identify bugs, identify improvements and additional functionality and to plan a sharing strategy and reporting framework. Research groups are trialling the current algorithm in novel pharmacoepidemiology studies and feedback from user testing will inform the development of the algorithm.
Results The current algorithm has been developed in Stata to run on data from the Clinical Practice Research Datalink. Ten distinct preparation steps have been identified, and at each step, the user inputs a decision about how the data will be transformed. By selecting the same decisions, the data preparation process can be replicated. We have held an initial workshop with our collaborators: there is consensus that the work is important and we received useful feedback. User testing is currently underway using a range of data sources and drug types representing wide ranging clinical situations.
Discussion By developing an agreed, standardised algorithm for drug data preparation we aim to improve the efficiency and transparency of pharmacoepidemiology. There is a clear need for improvements: as well as the inefficiency arising from multiple research groups developing similar processes for cleaning similar datasets, decisions made during data cleaning can impact the results of clinical research. We aim for the algorithm to be integrated with the RECORD statement,1 which will provide a reporting structure for data preparation.
Conclusion There is a consensus that the efficiency and transparency of data preparation can be improved. We are developing a reusable algorithm to standardise data preparation using observational EHR and create a reporting framework, with support across the Farr Network.
References
The PLOS Medicine Editors. From Checklists to Tools: Lowering the Barrier to Better Research Reporting PLOS Medicine 2015;12(10):e1001885. doi: 10.1371/journal.pmed.1001885.
Abstract no. 62 Temporal expression extraction and normalization in italian clinical reports
Natalia Viani and Lucia Sacchi, Department of Electrical, Computer and Biomedical Engineering, University of Pavia, Pavia, Italy
Carlo Napolitano and Silvia G Priori, IRCCS Istituti Clinici Scientifici Maugeri, Pavia, Italy
Riccardo Bellazzi, Department of Molecular Medicine, University of Pavia, Pavia, Italy
Introduction Exploring the temporal aspects of narratives is essential to extract relevant information from medical reports. Temporal information extraction from English texts has gained increasing attention over the past years. However, related studies on other languages are still limited. For Italian, research on temporal analysis of texts has involved corpora annotation and organization of tasks for the general domain, leading to the development of supervised and rule-based approaches. However, no temporal corpora are freely available in the clinical domain. In this work, we explore and compare two unsupervised techniques to identify and normalize temporal expressions (TIMEXes) in Italian clinical reports.
Methods For TIMEXes extraction, we used HeidelTime,1 a rule-based system mainly based on regular expressions. For TIMEXes normalization, we explored both HeidelTime and TimeNorm.2 While the first system relies on rules, the second is based on a synchronous context-free grammar. The two systems were originally developed for the English language, but are available also for Italian.
We considered a dataset of 50 unstructured Italian clinical reports. We annotated TIMEXes on the 50 reports, adapting the ItTimeML standard (sites.google.com/site/ittimeml/) to the clinical domain (e.g. adding TIMEXes for drug frequencies). We split the dataset into development and test set and used the development set to update HeidelTime rules and TimeNorm grammar entries in an iterative way. We also modified the HeidelTime annotator code to better deal with relative TIMEXes (e.g. ‘the day after’). The final system was tested on the test set.
Results Each annotated document contained on average 14 TIMEXes. The original HeidelTime was run on the development set, leading to an F1-score of 0.61 for TIMEXes extraction. After updating the rules, F1-scores on the development and test sets were 0.95 and 0.98, respectively. Updating the HeidelTime annotator code allowed increasing the accuracy of the normalization on the development set from 0.92 to 0.99, with a final accuracy of 0.99 on the test set. Running the original TimeNorm on identified TIMEXes, we obtained an accuracy of 0.60 on the development set. After tuning the grammar, the computed accuracy was 0.96 on the development and 0.95 on the test set.
Discussion We were able to obtain good extraction results by tuning HeidelTime rules. In the normalization task, HeidelTime performed slightly better than TimeNorm, probably because this system does not access the TIMEX context, which is instead useful to normalize ambiguous expressions. The high performances that we obtained might be due to the small size of the considered corpus, where TIMEXes are often expressed in a very regular way.
Conclusion This work shows that it is possible to port unsupervised systems for temporal processing from the general to the clinical domain. To avoid overfitting, in the future we will extend the annotated corpus.
References
Strötgen J. and Gertz M. HeidelTime: high quality rule-based extraction and normalization of temporal expressions. Proceedings of the 5th International Workshop on Semantic Evaluation, Los Angeles, California. 2010:321–4.
Bethard S. A synchronous context free grammar for time normalization. Proceedings of the 2013 Conference on Empirical Methods in Natural Language Processing, Melbourne, Australia. 2013:821–6.
Abstract no. 66 Using informatics to improve the quality of kidney disease management in primary care
Gang Xu and David Shepherd, University of Leicester, Leicester, UK
Rupert Major and Nigel Brunskill, University Hospitals of Leicester, Leicester, UK
Introduction Chronic kidney disease (CKD) affects a significant fraction of the adult population and is estimated to contribute 6,500 excess strokes and 12,000 excess heart attacks annually in England. Patients who go on to develop renal failure consume 2% of the NHS budget. Simple management strategies, such as optimum blood pressure control, can improve long-term outcomes in CKD.
The diagnosis and management of CKD requires the synthesis of information from blood test results and other biomedical data. This is a time consuming task and difficult to perform accurately for individual primary care practices. Audit data suggest many CKD patients are undetected in the community, and therefore do not receive optimal quality care.
Method An informatics tool, called ‘Improving Patient care and Awareness of Kidney disease progression together (IMPAKT)’, was developed through collaboration with primary care researchers at East Midlands Collaboration for Leadership in Applied Health Research and Care (CLARHC), West Leicestershire Clinical Commissioning Group(WLCCG), and Leicester’s Biomedical Informatics Network for Education, Research and Industry. IMPAKT was deployed as part of a quality improvement (QI) project to improve the quality of care at practice level. IMPAKT uses a Web-based informatics platform to perform MiQUEST (Morbidity Query Information Export SynTax) based queries of complex data in practices. A CKD nurse liaised with practices to facilitate utilisation of the IMPAKT tool with an aim of improving diagnosis and producing a tailored list of patients not receiving optimal CKD care at each individual practice.
Results Twenty practices in WLCCG took part in the QI project for a period of 18 months. The project covered a population of 121,362, and two audit cycles have now been completed. The mean prevalence of CKD increased from 4.79% to 4.95%. 91.78% of patients with CKD had their blood pressure recorded within the past 12 months at the start of the project compared to 93.67% at the end. The mean percentage of CKD patients achieving optimum blood pressure at the baseline audit was 49.43%, this improved to 54.55% at the second audit, and the improvement was maintained at 53.93% at the third audit.
Discussion At the end of this QI project a significant percentage of patients with CKD were documented to have achieved better blood pressure control. This represents a significant improvement in quality of care being delivered in the community. A 4.5% improvement in BP control in a CKD population of roughly 6,000 would translate to 270 extra patients meeting blood pressure targets with associated potential reduction in cardiovascular events in this group. The costs associated with cardiovascular conditions such as stroke/myocardial infarction are significant for both health care services and individual patients. This intervention required minimal additional resources and was able to deliver measurable and sustained improvements in care for a group of patients at significant risk of cardiovascular morbidity. WLCCG have recognized the potential benefits of this project and funded the project to be disseminated widely across the local area.
Abstract no. 67 Towards a structured lexicon for the automated extraction of clinical audiology concepts from the multisource medical records of aged people with hearing disabilities
Gabriella Tognola, Alessia Paglialonga, and Ruby Karmacharya, Consiglio Nazionale delle Ricerche (CNR), Istituto di Elettronica e di Ingegneria dell’Informazione e delle Telecomunicazioni (IEIIT), e-HealthLAB, Milan, Italy
Domenico Cuda and Alessandra Murri, Ospedale ’Guglielmo da Saliceto‘, UO Otorinolaringoiatria, Piacenza, Italy
Francesco Pinciroli, Retired Full Professor, Politecnico di Milano, Dipartimento di Elettronica, Informazione e Bioingegneria, e-HealthLAB, Milan, Italy
Introduction Hearing impairment is very common in older adults, affecting one-third of people over 65. Despite the many effective technologies available to aid such patients, old and new challenges need to be answered properly. As for aged people, recent surveys demonstrate that a successful treatment plan should take into account not only the aspects related to the technology but also other aspects broadly related to auditory disability (e.g. perceived hearing difficulties, impact on quality of life and speech perception). Many valuable instruments are used in clinical practice to measure these different aspects of hearing disability. Unfortunately, most clinicians cannot utilise this wealth of existing information as it is dispersed in the patient record and across different repositories with no sustainable opportunity to collate and analyze data in a multidimensional approach. Also, most of this information is available as unstructured text that frequently is still to be extracted from clinical notes. At the moment, there is no relevant experimentation within the framework described above, thus we made an attempt to design and develop a multi-source and multi-dimensional architecture for extracting and collating together audiological clinical information from diversified sources.
Method Patient sample data consisting of medical records of hearing impaired aged people was considered. The enrolled cases were split into a training and a test set. The proposed architecture aims at the extraction of all information relevant to the planning, management and measurement of the outcomes of the audiological treatment. The design process followed by our multidisciplinary team comprised the modelling of the clinical process and the definition of the hierarchical organization of clinical concepts. Extraction of textual information from the unstructured medical notes was performed using regular expressions and UMLS mapping by MetaMap. Context analysis was performed using a locally modified version of ConText, temporal information was extracted using regular expressions and clinical concepts were modelled through openEHR archetypes.
Results The architecture we built comprises data extracted from different source documents, such as audiometric tests, questionnaires to measures the perceived impact of hearing loss on daily life, technical setup of hearing devices, user preferences, risks factors, etc. In the present pilot evaluation, the different source documents reside on a single archive system. Two different data types are managed: i) textual narrative information related to the past medical history, current complaints, aetiology and audiological diagnosis, risk factors for hearing loss and ii) numerical information extracted from the audiometric tests, the technical setup of the hearing device, and from the scores calculated from questionnaires. Data are put on a graphical timeline to allow the clinician to monitor the treatment and to adjust it according to the ongoing patient outcomes.
Discussion and Conclusions The proposed architecture is able to model information relevant to the treatment of aged hearing impaired people and can provide the clinician with a multi-source and multi-dimensional view of the main factors relating to hearing disability. The principles we followed to design the architecture may be transferred to other disease domains.
Grants Project ‘PNRCNR Aging Program 2012-2018’.
Abstract no. 80 Understanding and supporting clinical processes: the PROforma model after 20 years
John Fox, Oxford University, Oxford, UK
Background Between about 1976 and 1996, I and many colleagues explored a range of approaches to decision support and workflow management at the point of care, including Bayesian and rule-based methods, expert systems and knowledge engineering, logic programming and cognitive information processing. Eventually, we concluded that while all of these approaches have value, none can individually address all the challenges posed by the complex demands of clinical practice, notably the range of tasks carried out by clinicians, the uncertainty that pervades medicine and the safety critical nature of patient care.
PROforma We therefore set out to combine the strengths of several techniques into a more versatile framework for decision making and clinical process management. At a theoretical level, we developed a new logical model for reasoning under uncertainty (logic of argumentation), a theory of decision making that was more intuitive and versatile than classical quantitative theories (symbolic decision theory) and an ‘agent’ architecture that could support complex workflows and adaptively respond to changing clinical circumstances. These came together in a declarative language for modelling and programming clinical tasks called PROforma and a suite of application development software.
MIE medal This work was first reported at the EFMI Conference on Medical Informatics Europe in 1996. Our paper introduced PROforma and described an early PROforma execution engine, a visual process and decision modelling tool and example applications, and attracted the MIE 20th Anniversary Gold Medal. The medical and cognitive rationale and theoretical foundations of PROforma have since been comprehensively reviewed1 and a standard syntax and semantics has been published.2
Applications In the 20 years since the MIE conference in Copenhagen, many clinical applications have been built and deployed using PROforma, including applications in specialist medicine (e.g. oncology, endocrinology, cardiology, virology and haematology), primary care (e.g. drug prescribing, genetic risk assessment and GP referrals) and patient facing services (e.g. NHS symptom checkers). Some ten clinical evaluations and trials have been published in peer-reviewed journals that have demonstrated significant improvements in decision making. This short talk will be a brief reflection on these applications, the lessons learned and current use of PROforma in the OpenClinical knowledge sharing project; please visit www.OpenClinical.net.3
Data science meets knowledge engineering With the current interest in ‘big data’, machine learning, cognitive computing, etc., we are currently working on possible approaches to incorporating these techniques into the PROforma development lifecycle supported by OpenClinical. We are keen to meet and collaborate with data scientists and others interested in this challenge and who would like to exploit the OpenClinical platform in their research.
Declaration The author is the chief scientific officer of Deontics Ltd., a commercial supplier of PROforma Clinical Decision Support and Workflow Technologies.
References
Fox J and Das SK. Safe and Sound: Artificial Intelligence in Hazardous Applications, California:AAAI& MIT Press, 2000.
Sutton DR and Fox J, Syntax and Semantics of the PROforma guideline modelling language. Journal of the American Medical Informatics Association 2003;10(5):433–43.
Fox J, Gutenstein M, Khan O, South M and Thomson R. OpenClinical.net: a platform for creating and sharing knowledge for decision making and best practice in healthcare. Computers in Industry 2013;66: 63–72.
Abstract no. 82 Missing feature of health app development: patients
Amy Nguyen and Richard Day, University of New South Wales, Sydney, Australia
Melissa Baysari and Anna Fernon, Australian Institute for Health Innovation, Macquarie University, Sydney, Australia
Michael Wong, St Vincent’s Hospital, Sydney, Australia
Introduction Gout is a form of chronic arthritis caused by elevated serum uric acid (SUA). Gout culminates in severely painful acute attacks and can cause permanent joint damage if left untreated. Very effective uric acid-lowering therapies (ULTs) for gout exist; however, adherence to ULTs is extremely low, and gout prevalence is increasing. Mobile health applications (apps) have been shown to be useful in self-management of chronic conditions. However, very few health apps are developed in conjunction with end-users, such as patients, and thus their uptake and effectiveness are limited. Gout is a good candidate for patient self-management through an app. This is because gout’s clinical indicator, SUA, is directly correlated to the likelihood of acute attacks. An app could improve gout management by allowing patients to monitor their SUA, provide real-time feedback, and deliver education on the importance of ULT adherence. This presentation synthesises studies aimed at co-developing a mobile app for, and with, gout patients to self-manage their disease.
Methods As an initial step, all available gout management apps on iTunes and Google Play stores were identified. Of these apps, the six that were in English, designed for patients and provided both monitoring capabilities and patient education were assessed for concordance with international gout management guidelines. Using these six apps and a locally developed app for general health, focus groups were held with 13 gout patients to determine the app features useful for patient self-management. Via interviews and focus groups, an additional 11 gout patients provided feedback on in-house developed written text and animated video educational materials.
Results Of the six gout management apps available, only one was concordant with all patient-centred recommendations for gout management. However, this app was not fully electronic and required patients to manually complete printouts. Patients identified useful features of a gout self-management app to be an interactive graph to monitor SUA, gout educational information, reminders to take medications, a diary for recording acute attacks to monitor attack severity and triggers, and research updates. For the educational materials, patients reported that videos were an interactive way to capture their attention and deliver simple messages quickly. Patients preferred written material that was concise and individualised. In terms of content, the information gout patients viewed as key to communicate to app users were the causes of gout and effective treatments.
Discussion We involved patients in all developmental iterations of our gout management app to ensure the app provides useful information and functionality that is easy to use. Usability testing is currently underway and a large randomised controlled trial is planned to demonstrate the clinical effectiveness of this app in reaching and maintaining safe concentrations of SUA and minimising the frequency of gout attacks.
Conclusion This research has demonstrated the importance of involving patients in all stages of health app development. We predict that this iterative process will increase the likelihood that the end product is user-friendly and accepted by patients, which will ultimately lead to increased uptake and greater clinical effectiveness.
Abstract no. 83 Latent profile analysis to learn subgroups of lung function for personalised medicine
Danielle Belgrave and Adnan Custovic, Imperial College London, London, UK
Raquel Granell and John Henderson, University of Bristol, Bristol, UK
Angela Simpson, Lesley Lowe, and Iain Buchan, University of Manchester, Manchester, UK
Introduction The grand challenge of identifying personalised healthcare strategies relies on the discovery of subtypes of complex diseases that typical statistical methods might not uncover. Current clinical practice defines asthma as a single diagnosis characterised by impaired lung function and wheezing. We hypothesised that distinct syndromes with heterogeneous profiles of lung function from childhood to adolescence might be resolved by using advanced statistical learning methods and that the different trajectories indicate biological sub-types (endotypes) of asthma.
Method Data source: population-based birth cohorts: the Manchester Asthma and Allergy Study (MAAS) (n=1184 participants recruited in 1995) and the Avon Longitudinal Study of Parents and Children (ALSPAC) (n=14,541 participants recruited in 1991). Lung function was assessed using forced expiratory volume (FEV1) collected at ages 5, 8, 11 and 16 years in the MAAS and at ages 8, 15 and 24 years in the ALSPAC, and data were expressed as percent predicted FEV1 using standardised spirometry centile charts. We used a latent profile model to assign children to one of N latent trajectories (profiles) of FEV1, with the number or size of profiles not known a priori. The models were compared for goodness-of-fit. For each child, the posterior probability of belonging to a given class was calculated using Empirical Bayes and children were assigned to the latent profile with the largest conditional posterior probability. We then constructed a multivariable model to identify a set of early-life predictors of subsequent latent profiles of FEV1. We used receiver operating characteristic (ROC) curves to evaluate the model predictive ability. Analysis was repeated independently using data from ALSPAC.
Results The optimal model was a 4-class random intercept latent profile model. We labelled classes as: Class 1 [above average lung function (n = 46, 4.4%), mean FEV1 of 119.22% (95% CI, 117.62–120.81)] Class 2 [normal lung function (n = 474 45.3%), mean FEV1 104.34% (103.90–104.77)] Class 3 [tendency to diminished lung function (n = 490, 46.9%), mean FEV1 of 91.22% (90.77–91.67)] Class 4 [poor lung function (n = 36, 3.4%) and mean FEV1 of 76.31% (74.47–78.16)]. Multinomial regression analysis revealed that children who wheeze have severe exacerbations by age 3 years, have at least one positive skin test by age 3 years and have been exposed to smoking by age 3 years were more likely to belong to Class 4. This set of variables provided a good predictive ability for discriminating between children in Class 4 from children in Class 1 (area under ROC curve = 90.7%, sensitivity=81.8% specificity=80.95%). Similar profiles were identified in ALSPAC.
Discussion This study demonstrates that advanced statistical learning methods can uncover plausible, distinct profiles of lung function over time and we have identified conditionally independent predictors at age three years, which can distinguish children with poor prognosis in terms of lung function from ages 5 to 24 years. These profiles of lung function persist into adulthood, remaining a stable feature throughout life.
Conclusion Longitudinal clinical datasets contain statistically ‘learnable’ structure reflecting the heterogeneous profiles of disease that are key to advancing personalized medicine.
Abstract no. 93 Developing e-learning resources for families of African–Caribbean people diagnosed with schizophrenia: a qualitative approach to co-production
Dawn Edge and Henna Lemetyinen, The University of Manchester, Manchester
Introduction The African–Caribbean people in the UK are more likely than any other ethnic group to be diagnosed with schizophrenia. They report high levels of stigma and shame about mental illness. This contributes to delayed help-seeking and worse outcomes such as high rates of relapse. Stigma combined with barriers to accessing services is associated with more coercive care. African–Caribbeans negative experiences have created a ‘circle of fear’ towards engaging with statutory health services.
Psychoeducation has shown potential for improving outcomes for patients and families. Psychoeducation delivered via e-health programmes could contribute to reducing health inequalities in low income and minority groups to improve awareness of mental illness and services, especially delivered via smartphone. However, there are no culturally appropriate psychoeducation programmes for African–Caribbeans in the UK. Our study aims to inform development of a culturally appropriate e-learning resource with African–Caribbean stakeholders.
Method Collecting qualitative data was essential as no information of African–Caribbean stakeholders’ views of learning resources for schizophrenia is currently available. We conducted focus groups comprising i) persons diagnosed with schizophrenia (n = 7), ii) carers and family members (n = 6), iii) community members (n = 6) and iv) young (x̄ = 25 years) mixed group (n = 6). Participants were identified as African–Caribbean, Black African, Black British or ‘Mixed’ heritage, or cared for a person with schizophrenia of African–Caribbean descent. Participants were community members and people recruited via third sector organisations and local universities. Framework Analysis was conducted with NVivo (v11). The framework was constructed by identifying participants’ responses to a priori themes. Emergent themes and sub-themes were coded to inform resource development.
Results Data yielded ten a priori themes including perceptions of the ‘need for the resource’ and ‘culturally sensitive issues’ such as spirituality. Five other themes ‘self-acceptance’ and ‘police involvement’ emerged spontaneously. Findings showed that all groups perceived a strong need for a culturally appropriate learning resource.
There were similarities and differences in the groups’ responses. All groups prioritised learning about symptoms and treatment. However, whereas patients considered ‘relationships’ important theme, others highlighted the need for community-level psychoeducation. All participants perceived a need for personal recovery stories to counteract negative beliefs and attitudes. The ‘young mixed group’ (18–25) advocated telling one story told from multiple perspectives to illuminate key factors that might improve knowledge about schizophrenia and counteract negative perceptions.
Discussion The findings demonstrate that African–Caribbean participants prefer a combination of factual information and personal stories in an e-learning resource about schizophrenia. Participants also elaborated on the stigma attached to schizophrenia, particularly prevalent in African–Caribbean communities, and the role that an e-learning resource could play in improving individual and family outcomes. Participants discussed the importance of faith in their culture, which was often viewed as both a barrier to accessing care and as a therapeutic resource for recovery.
Conclusion Our findings demonstrate that African–Caribbeans perceive the need for more culturally appropriate learning resources about schizophrenia and psychosis. Contrary to previous reports of unwillingness to collaborate in research, our findings highlight the community’s desire to co-produce interventions that increase the understanding of schizophrenia to improve outcomes and reduce stigma.
Abstract no. 101 Patient stratification in psoriasis using large-scale patient-level data
Nophar Geifman, Niels Peek, and Iain Buchan, The University of Manchester, Manchester, UK
Introduction Biologic therapies, a class of drugs modifying specific parts of the immune system’s functioning, have led to remarkable improvements in outcomes for psoriasis patients. Biologics for treating severe psoriasis include adalimumab and etanercept (anti-tumour necrosis factor) and ustekinumab (anti-interleukin [IL]12/23). However, these drugs are expensive, may result in serious adverse events and the response to treatment is variable. The Psoriasis Stratification to Optimise Relevant Therapy consortium aims to target these therapies by using large-scale patient-level data to identify subgroups of patients for whom treatment with biologics will be most beneficial.
Methods Longitudinal patient-level data for 3546 patients treated with first-line biologic therapies (including adalimumab, etanercept, infliximab and ustekinumab) with a follow-up of up to three years were obtained from the British Association of Dermatologists Biologic Interventions Register. To these data, we applied a latent class mixed model (LCMM) in order to discern subgroups of patients with distinct responses to treatment over time, as measured by the Psoriasis Area Severity. Our model adjusted for age, age of onset of psoriasis, gender, ethnicity, body mass index and the specific biologic therapies patients were receiving. The optimal number of latent classes was assessed using the Bayesian information criterion (BIC). The model which had the lowest BIC, and a reasonable number of patients in all the resulting classes (at least 10%), was selected. Other patient-level variables, such as blood test analytes and comorbidities, were used to define these subgroups’ distinguishing characteristics and investigate the interaction between patient characteristics and treatment.
Results The LCMM resulted in two classes (subgroups) of patients, with 45.9% in Class 1 and 54.1% in Class 2. While both classes demonstrated some degree of response, Class 2 demonstrated greater reduction in disease symptoms and severity over time (95.4% versus 68.6% at 12 months). Additionally, Class 1 demonstrated a higher proportion of patients with erythrodermic psoriasis, palm involvement, nail involvement and prior exposure to UV therapy (P<0.05). Evaluation of comorbidities associated with patients in each of the resulting classes revealed that Class 1 has a significantly higher proportion of patients with a history of hypertension and anxiety (P<0.05).
Discussion Our results indicate the presence of at least two subgroups of psoriasis patients, ‘learned’ from clinical data, each demonstrating a different response to treatment with biologic therapies. This approach is merely hypothesis-generating but has uncovered some highly plausible subgroups that may prove to be distinct endotypes with further causal investigation. By focusing on the distinguishing characteristics of these subgroups at baseline, the prediction of response to treatment might usefully be stratified, thereby enabling better selection of therapies. As molecular data, such as genotyping and gene expression data, become available, our stratification approach will provide putative endotypes with greater discovery potential than current clinical labels when exploring omic associations in respect of biological mechanisms.
Conclusion This work illustrates how large-scale clinical datasets allow for the identification of clinically meaningful subgroups in psoriasis.
Abstract no. 104 Precision epidemiology for kidney disease in the east midlands
Rupert Major, Gang Xu, David Shepherd, and Nigel Brunskill, University of Leicester, Leicester, UK
Introduction The combined cost in England for kidney disease care is £1.4 billion, or 1.6% of the NHS England’s budget. It is estimated that 10% of the adult population may be affected by some form of kidney disease. Health informatics data linkage between primary and secondary care provides an opportunity to improve efficiency and deliver better quality precision care. We describe how the East Midlands has begun to tackle this problem through precision epidemiology for two kidney conditions, chronic kidney disease (CKD) and acute kidney injury (AKI). The aim of these studies is to generate accurate epidemiological data and translate the findings to help individual practices deliver personalised care for patients. These projects are supported by East Midlands Collaboration for Leadership in Applied Health Research and Care, local clinical commissioning groups, University Hospitals of Leicester, and Leicester’s Biomedical Informatics Network for Education, Research and Industry.
Methods Utilising the MIQUEST search methodology, we developed IMPAKT, an automated data extraction tool compatible with any electronic primary care clinical systems. Data extracted include demographic, co-morbidity and clinical investigation data. The tool has evolved from a quality improvement(QI) tool to a bespoke research tool for two large pragmatic clinical trials, in CKD (PSP-CKD) and AKI(IMPAKT-EVOLVE). All research data are anonymised via one-way hashing of NHS numbers. In addition to gathering data for epidemiological analysis, the IMPAKT tool can be used to identify patients at risk of CKD/AKI in an automated fashion and provide primary care practitioners with a precise list of patients who would benefit from intervention.
Results We have recruited over 70 primary care practices to participate in CKD/AKI QI and research projects. The total number of anonymised records extracted is over 250,000 combining 30 million data points. For an average sized primary care practice of 7,000 patients, the IMPAKT tool extracts over 400,000 data points. In total, 30,000 individuals, including approximately 6,000 individuals not previously correctly coded as having a kidney condition, are included in the CKD database. Linkage of these databases to secondary care has highlighted unidentified conditions in primary care records.
Discussion Epidemiological research and quality improvement has traditionally provided service level information for development of health care policy but not individualised care. With over 30 million data points for more than 250,000 anonymised individuals, the databases we have developed offer a comprehensive data source for quality improvement and research into individuals with renal disease and other chronic conditions. The initial analysis of the databases will pragmatically answer specific clinical questions regarding implementing improvements in clinical practice. To our knowledge, these studies are the first to integrate primary and secondary care data in this way to support clinical trials data in AKI and CKD. Through analysis of these datasets, we aim to deliver and develop evidence driven health care policy improvement.
Conclusion The principal outcomes of epidemiological research have traditionally influenced policy on a national level. For kidney disease in the East Midlands, we have developed large databases and processes regarding results to be disseminated on an individual patient and clinician level.
Abstract no. 108 Using lambeth datanet to identify ethnic variation in the control of hypertension
Mark Ashworth, Vasa Curcin, and Mariam Molokhia, King’s College London, London, UK
Introduction Patient-level primary care data provide a rich source of information for addressing health inequalities. In Lambeth, an innercity borough of south London, the Lambeth DataNet (LDN) database contains pseudonymised data from all 360,000 patients registered at 47 general practices.
LDN is a rich source of demographic data: 87% of patients have a record of ethnicity coding 51% have a record of ‘country of birth’ 74% have a record of ‘language preference’.
Hypertension (HT) is the single largest cause, after smoking, of avoidable cardiovascular morbidity and mortality. Population studies demonstrate that target treatment levels fail to be achieved by a substantial minority of patients. We aimed to identify mean levels of blood pressure (BP) control in patients diagnosed with HT and to determine the relationship with ethnicity and social deprivation.
Method LDN is based on patient-level data extracted from the clinical software system used by general practitioners. Read and EMIS codes are extracted and mapped to SNOMED-CT freetext data cannot be extracted. Access to data is controlled by the clinical commissioning group, the nominated ‘data processor’.
We conducted a cross-sectional case-control study of patients diagnosed with HT and recorded using validated clinical Read codes. Firstly, we determined HT control status, based on the achievement of a target BP of ≤150/90mm Hg. We then identified risk factors in those who achieved or failed to achieve the BP target, including age, gender, social deprivation (IMD-2015) and ethnicity (2011 Census ‘5+1’ categories).
We used regression modelling to determine the proportion of patients from each ethnic group achieving the BP target, adjusted for age, gender, deprivation and ethnicity. Ethnic groups were further refined using data from recording of language preference and country of origin.
Results A total of 292,385 patients were ≥18 years 32,452 (11.1%) had a recorded diagnosis of HT. 79.9% of patients with HT achieved the BP control target. The adjusted proportions of patients who achieved the BP target were White British, 84.3% (n=149,949), South Asian 85.1% (n=15,570) and African/Caribbean 79.5% (n=54,734).
The BP target achievements in specific populations were West African, 78.1% East African, 79.8% Caribbean, 81.8% Portuguese/Brazilian and75.7% Polish 69.8%.
Discussion Almost 80% of patients with HT achieved the BP control target. BP control was more successful in White British and South Asian patients, whereas African/Caribbean patients had less well-controlled HT. Among African/Caribbean patients, West Africans had below average and East Africans had above average BP control. Least successful BP control was found in the Polish and Portuguese/Brazilian populations.
Conclusion Although we adjusted for potential confounders, our other factors such as healthcare engagement and cultural lifestyle factors may have confounded our findings. Additionally, pharmacogenomic genetic variants related to renin–angiotensin gene polymorphisms may explain some of the differences in response to antihypertensive treatment in the black population. Apparent inequalities in HT control identified through novel informatics approaches based on detailed analysis of ethnicity could guide prioritisation of management and treatment in groups with greatest need.
Abstract no. 111 Documentation time during outpatient consultations with a new EHR: fears and figures
Ameen Abu-Hanna, Linköping University, Linköping, Sweden
Ronald Cornet, Academic Medical Center, University of Amsterdam, Amsterdam, The Netherlands and Linköping University, Linköping, Sweden
Erik Joukes and Nicolette de Keizer, Academic Medical Center, University of Amsterdam, Amsterdam, The Netherlands
Introduction Physicians spend considerable time documenting patient data. A time-and-motion study estimated that physicians spent 37% of their time on documentation during outpatient consultations,1 matching self-reported estimates of 40%.2 Implementation of a new, more structured and advanced, EHR makes end-users fear for even more time on documentation.2 They especially expect a higher documentation burden during the consultations, decreasing the time available for direct patient contact. Therefore, in this study, we investigate the following: what percentage of time do physicians spend on documentation during outpatient consultations and how does this change by the introduction of a new EHR?
Methods We developed an application to measure the physicians’ time spent on four categories of tasks during their outpatient consultations: documentation, patient care, communication and not care related. Working on multiple tasks simultaneously was supported. Observers, 23 students of the medical informatics programme of the University of Amsterdam, were instructed on possible scenarios and tasks and the use of the application. Each observer followed a physician for the duration of one session (morning or afternoon) of outpatient consultations. The physicians were from various specialisms (both surgical and internal medicine). The application logs the start and stop time of each performed task. Observations were repeated under similar circumstances with the same physicians six months after the introduction of the new EHR. We calculated the median and interquartile range of consultation duration and median percentage of time spent on all documentation tasks within these consultations (i.e. while in the examination room with the patient). Differences were tested by the paired Wilcoxon signed rank test.
Results We observed 13 physicians for a total of 94 hours covering 267 consultations (median of 3.5 h and 10 consultations per physician, per measurement session). The median duration of a consultation did not change significantly (13.2 (10.2–17.0) minpre-implementation to 13.0 (11.3–14.6) minpost-implementation, p=0.74). Also the percentage of time spent on documentation tasks within a consultation did not change significantly (30.5% (19.5–43.1) pre-implementation versus 27.1% (20.6–50.4) post-implementation, p=0.59).
Discussion and Conclusion The introduction of a new EHR did not significantly change the amount of documentation time during outpatient consultations. The measured documentation time (around 30%) is lower than the (self-reported) value of 37%–40% reported in the literature. This might be because for this study we calculated our results based only on the time within consultations. This means that we could not measure the possible shift in time spent on the tasks in the after-consultation hours. Further analysis will provide more insight into the distribution of all measured tasks during and between the consultations.
References
Sinsky C, Colligan L, Prgomet M, Goeders L, Westbrook J, Tutty M et al. Allocation of physician time in ambulatory practice: a time and motion study in 4 specialties. Annals of Internal Medicine 2016;165(11):753–60. doi:10.7326/M16-0961
Joukes E, De Keizer N, Abu-Hanna A, De Bruijne M and Cornet R. End-User Experiences and Expectations Regarding Data Registration and Reuse Before the Implementation of a (New) Electronic Health Record: A Case Study in Two University Hospitals, Studies in Health Technology and Informatics. 2015; 216:997.
Abstract no. 115 Care pathways related to scottish ambulance service contacts for people with psychiatric or self-harm emergencies
Edward Duncan, Cath Best, Silje Skar, and David Fitzpatrick, NMAHP Research Unit, University of Stirling, Stirling, UK
Nadine Dougall, School of Health & Social Care, Edinburgh Napier University, Edinburgh, UK
Josie Evans, Scottish Ambulance Service, Glasgow, UK
Alasdair Corfield, Faculty of Health Science and Sport, University of Stirling, Stirling, UK
Cameron Stark, Emergency Dept, Royal Alexandra Hospital, NHS Greater Glasgow & Clyde, Glasgow, UK
Wojtec Wojcik, Department of Public Health, NHS Highland, Inverness, UK
Isabella Goldie, Department of Psychological Medicine, Royal Infirmary, NHS Lothian, Edinburgh, UK
Chris White and Helen Snooks, Mental Health Foundation, Glasgow, UK
Margaret Maxwell, Institute of Life Sciences, Swansea University, Swansea, UK
Introduction People categorised as having a psychiatric emergency or self-harm episode account for thousands of Scottish Ambulance Service (SAS) emergency calls every year. Most are conveyed to emergency departments (EDs). Anecdotally many are highly vulnerable, at increased risk of suicide and repeat ED attendance, but previously no data were available to support this supposition. The aims of this study were to provide this epidemiological data and to inform the development of alternative care pathways.
Method The new ‘unscheduled care datamart’ developed by NHS Scotland Information Services Division comprises linked anonymised data for SAS, EDs, acute and mental health hospital episodes and Registrar General Scotland (RGS) recorded deaths. SAS attendances for ‘psychiatric emergencies’ or ‘self-harm’ were extracted for 2011 and 2012. People were followed up from their first contact with the SAS in 2011 for one year.
Results Nationwide during 2011, there were 9,014 calls attended by the SAS. These were made by 6,802 people (52% males, 48% females). Most people (n=5,624, 83%) made one call, with the remaining (n=1178, n=17%) making two or more calls, including 21 people who made 9 or more calls.
The most common four care pathways were:
1. conveyance to and discharge from ED (4,566 calls 51%),
2. conveyance to ED and inpatient acute admission (1,250 calls 14%),
3. attendance with no transfer, i.e. left primarily at home (1,003 calls 11%),
4. conveyance via ED or directly to inpatient mental health admission (793 calls 9%).
Within 12 months of their first recorded call, one in 25 people (n=279, 4.1%) had died, including 97 people recorded as suicide. Remaining deaths were ‘accidents’ (n=36, 13%), ‘mental and behavioural disorders’ (n=28, 10% dementia, alcohol and drug disorders) and ‘other’ (n=118, 42% long-term conditions with co-morbid psychological distress).
Two hundred and forty people died >1 day and <1 year after initial SAS attendance. Of these people who were last seen alive by SAS, one in four people went on to die by suicide (n=59 25%), of these almost half (n=27 46%) were either left at home by the SAS or discharged from the ED with no known follow-up.
Discussion RGS summary statistics for 2011 and 2012 recorded 772 and 762 deaths by suicide. There were 59 RGS recorded deaths by suicide in our data extraction, implying that 8% (59/762) had been in contact with SAS in the preceding year. The SAS had also been in contact with 102 people who were either left at home or transported to ED and discharged with no known follow-up. There is potential important benefit from implementing new suicide prevention interventions, and building resilience in people who habitually self-harm and call SAS, and are coded by paramedics as ‘psychiatric emergency’ or ‘self-harm’.
Conclusion Only very recently has ambulance service become routinely linked to other datasets, including mortality outcomes. This study highlights the enormous potential of linked data and provides completely new insights into the behaviour of people who self-harm and are suicidal. Opportunities now exist to develop new programmes of work targeting specific cohorts.
Abstract no. 117 Adoption of an electronic medication reconciliation tool and its impact on the quality of discharge prescriptions
Robyn Tamblyn, Nancy Winslade, Todd C Lee, Christina J Qian, and Teresa Moraga, McGill University, Montreal, Canada
Aude Motulsky, Research Center, Centre Hospitalier de l’Université de Montréal, Montreal, Canada
Isabelle Couture and Andre Bonnici, McGill University Health Centre, Montreal, Canada
Background It has been estimated that approximately 46% of medication errors and 20% of adverse drug events arise from a lack of medication reconciliation at admission and discharge from hospital. Despite medication reconciliation being widely mandated, it is rarely completed, much less to meet quality standards. This is largely due to its resource-intensive nature in gathering information for each patient, especially for those cared by multiple physicians or use multiple pharmacies. The use of electronic medication reconciliation tools that automate data retrieval and facilitate medication reconciliation may overcome many of these challenges and thus improve efficiency and hospital adherence. The aim of this study was to measure the adoption of an electronic medication reconciliation tool and its impact on reducing adjudication failures and medication discrepancies.
Methods A clustered randomized control trial was conducted at three hospital sites in Quebec from October 2014 to October 2016. Adult participants were eligible for inclusion if they were using prescription medication at admission, were covered by Quebec drug insurance plan, admitted from the community, admitted to a medical or surgical unit, and discharged alive. The intervention comprises the electronic retrieval of the community drug list, combined with an electronic discharge reconciliation module and a discharge communication module. The control was standard care. For this interim analysis, only patients whose charts had been completed and abstracted were included. Outcomes measured include adoption rates, adjudication failures, unintended stops and therapy duplication. These were defined, respectively, as percentage of completed discharges using the electronic tool among all completed discharges in intervention failure to account for disposition of community medications at discharge omission of community medications from the in-hospital chart or discharge prescription and prescription for a drug in the same class as a community drug that was not adjudicated or included in the discharge prescription.
Results An overall adoption rate of 86% was found in the intervention group. 87.5% of electronic discharges were completed on week days, and fewer discharges on weekends (12.5%), reflecting lower discharge volumes as well as the absence of pharmacists on the weekends who facilitate the process. Among all 2739 completely abstracted discharge charts in the intervention, there were 2% of patients who had adjudication failures, 0.7% with unintended stops and 1% with therapy duplication. While in the control group of 1351 control patients who had their charts abstracted, 30% had adjudication failures, 27% had unintended stops and 11% had therapy duplication (p < 0.0001 for all comparisons between control and intervention units). All discrepancies found in intervention patients occurred in those whose discharge medication reconciliation was not completed with the electronic tool.
Conclusions An electronic medication reconciliation tool that simplifies data retrieval and requires adjudication of all community medications can largely decrease and eliminate adjudication failures and unintentional discrepancies.
Abstract no. 118 Development and testing of clinical performance feedback theory in UK primary care: a meta-synthesis and pilot study
Benjamin Brown, Richard Williams, Panos Balatsoukas, Matthew Sperrin, Sabine van der Veer, Niels Peek, and Iain Buchan, Health eResearch Centre, Farr Institute for Health Informatics Research, The University of Manchester, Manchester, UK
Wouter Gude, Academic Medical Center, Amsterdam, The Netherlands
Thomas Blakeman, Greater Manchester CLAHRC, The University of Manchester, Manchester, UK
Gavin Daker-White, Centre for Primary Care, The University of Manchester, Manchester, UK
Introduction Clinical performance is increasingly quantified through analysis of structured electronic health record (EHR) data. This is especially true in UK primary care, which routinely captures clinician-coded data at the point-of-care. Cochrane reviews show that feedback of such analyses can be effective at improving care quality. However, the mechanisms by which this works are poorly understood. Consequently, the delivery of clinical performance intelligence is often suboptimal. Hence, there is a need for stronger theoretical underpinnings of such systems. We report findings from an ongoing study that is filling this evidence gap by:
1. Developing a detailed clinical performance feedback theory (CPFT).
2. Testing CPFT by using it to inform prototype software for UK primary care (the performance improvement plan generator (PINGR)), and evaluating its usability and potential impact on patients.
Methods Objective 1. Meta-synthesis of findings from qualitative studies of clinical performance feedback interventions (PROSPERO CRD42015017541). Qualitative studies tend to generate theory, though no previous attempt has been made to review this literature. Studies were synthesised through line-by-line coding. Framework analysis identified causal pathways in intervention effectiveness.
Objective 2. We used CPFT to design and implement PINGR and performed a multi-stage evaluation. Methods entailed: a) usability inspection studies conducted with experienced software evaluators employing heuristic evaluation and cognitive walkthrough, b) laboratory-based mixed method usability tests carried out with primary care clinicians, assessing task performance accuracy, visual search behaviour and user satisfaction and c) ongoing field tests in primary care practices in Salford UK, consisting of usage pattern and EHR data analysis, user interviews and observations.
Results Objective 1. From 16,413 screened papers, we synthesised findings from 65. CPFT posits that effective clinical performance feedback is a cyclical process consisting of goal setting data collection and analysis feedback message production perception and acceptance of feedback desire and intention to respond and action. This process is influenced by a number of moderating variables such as feedback message design.
Objective 2. Informed by CPFT, a defining feature of PINGR is that it recommends improvement actions tailored for both the practitioner/clinic and individual patients (‘decision-supported feedback’). Usability inspection studies (n=8) and usability tests (n=7) demonstrate that they are user-friendly, though they should prioritise information for user action. PINGR is currently deployed in selected primary care practices (n=4), with 39 target end-users. Within its first month of use, it directly influenced care for 28 patients by identifying undiagnosed conditions and reducing unnecessary diagnoses and medical tests.
Discussion CPFT is useful for guiding the design, implementation and evaluation of clinical performance intelligence systems. The PINGR demonstrates how this can be done in UK primary care for improving care quality. Its evaluation has generated further learning, such as the importance information prioritisation, which is likely generalizable to other clinical contexts and conditions. CPFT may also be applicable to clinical decision support systems.
Conclusion We have developed a theoretical model to guide the evolution of clinical performance intelligence systems. Such underpinning theory will grow in importance as the context of performance extends to care co-produced between patients and clinicians over shared records.
Abstract no. 123 Development of a questionnaire for determining important information needed in hospital care coordination
Laura-Maria Peltonen, Eriikka Siirala, and Riku Aantaa, Department of Nursing Science, University of Turku, Turku, Finland
Heljä Lundgrén-Laine, Eliisa Löyttyniemi, and Sanna Salanterä, Turku University Hospital, Turku, Finland
Introduction Coordinating daily care signifies organizing patient care activities when delivering health care services. This is demanding due to various actors involved in the provision of care. The professionals responsible for coordination in hospitals are nurses and physicians in charge. They need information systems, which provide crucial information quickly and in a clear form. Identifying important information is essential when developing information systems. A questionnaire exploring daily care coordination –related information needs has been developed for intensive care units, but yet no tool exists for a broader hospital setting. This study aimed to develop and test a questionnaire, which can be used to explore information needed in daily care coordination in emergency, radiology, angiographic units, and inpatient wards.
Method This instrument development study had two phases. First, an information needs questionnaire developed for the intensive care unit was modified for a broader hospital setting through observations (n=30 hours) and interviews (n=34 professionals). Items were added, modified and deleted based on the Content Validity Index method. The final version of the modified questionnaire included 114 items, which were divided into six dimensions. Second, the modified questionnaire was tested in two hospitals (n=258 professionals). Data were collected in 2014. Information was considered important when 70% of respondents rated it nine or ten on a scale from 0 (completely unnecessary information) to 10 (absolutely necessary information). The questionnaires psychometric properties were analyzed with item–total correlations, a split-half analysis and Cronbach’s α values.
Results The response rate was 26% (n=67). Staff members’ information needs were more varied compared to those of the managers. All respondents shared 31% (35 items) of the important information needs. Of all 114 items in the questionnaire, 26% (30 items) were important to professionals in the emergency unit, 42% (48 items) were important to professionals in the radiology unit and 40% (46 items) were important to professionals on the wards. The questionnaire showed good Cronbach’s α (0.85–0.96) and Spearman–Brown coefficient (0.90–0.97) values for all dimensions. The item–total correlation analysis showed that 109 items added to the explanatory power of the questionnaire.
Discussion The modified questionnaire was comprehensive and it distinguished important information needed in daily care coordination. It had good internal consistency and almost all items added to its’ explanatory power. Managers, staff and professionals in different units had different information needs, although near one-third of these were shared. The findings indicate that daily care coordination related information systems should be developed based on the users’ needs they should include essential information for all users and should also have flexibility to display user specific needs.
Conclusion A questionnaire was developed for the exploration of information needs of the professionals responsible for daily care coordination in hospitals. This can be used to determine the information needed in hospital daily care coordination and to develop information systems, which improve information management and support decision making. Research is needed to further determine the psychometric properties of the questionnaire and to generalize the findings related to information needs.
Abstract no. 124 Which variables are useful for phenotyping dementia in primary care records? A meta-analysis
Elizabeth Ford, Nicholas Greenslade, Priya Paudyal, and Jackie Cassell, Brighton and Sussex Medical School, Brighton, UK
Philip Rooney and Seb Oliver, University of Sussex, Brighton, UK
Introduction Dementia is usually identified in primary care by general practitioners (GPs). However, epidemiological studies suggest only 50% of dementia cases are currently identified or recorded in general practice. Increasing diagnosis rates is a strategic priority for the UK government and the NHS. A range of indicators in the primary care record are likely to be predictive of patients at high risk of dementia and could be combined in a predictive model. As part of the Wellcome Trust funded ASTRODEM study, we conducted a meta-analysis to identify conditions and medications previously associated with dementia in primary care records to inform development of a predictive model.
Method A systematic search of the literature, according to PRISMA guidelines, was conducted in Pubmed and Web of Science, between 7 January 2016 and 13 February 2016. We included cohort or case-control studies using routinely collected primary care data, which measured the association between any condition, symptom, or medication and dementia. Raw data were extracted from papers or supplied by study authors. RevMan 5.3 was used to pool associations between studies odds ratios were calculated for each predictor. Many studies used data from the Clinical Practice Research Datalink so a sensitivity analysis was conducted to check for the effect of cases not being independent between studies.
Results 24 studies were included, 19 from UK, 3 from the Netherlands and one each from Germany and Denmark. These looked at associations with Alzheimer’s disease (AD), vascular dementia (VaD), and dementia not otherwise specified (NOS). Six lifestyle variables, 33 conditions, 5 dementia signs and symptoms and 33 classes of medication were identified as risk factors from studies. Meta-analysis showed that cardiovascular risk factors such as stroke and hypertension were positively associated with VaD (OR 3.26 (95% CI: 3.14–3.37) and 1.16 (95% CI: 1.08–1.24), respectively) and negatively with AD (OR 0.55 (95% CI: 0.52–0.58) and 0.78 (95% CI: 0.66–0.93)). Neuro/psych symptoms were positively associated with all types of dementia, especially depression (OR 1.82, 95% CI: 1.36–2.42), anxiety (OR 2.05, 95% CI: 1.29–3.28) and seizures (OR 7.17, 95% CI: 5.99–8.58). Obesity and dementia NOS were negatively associated (OR 0.51, 95% CI: 0.35–0.76). Cognitive symptoms, incontinence and lower limb fractures were also strongly associated with dementia NOS. The sensitivity analysis showed similar results, but weaker or reversed associations with AD for obesity, smoking and dyslipidaemia.
Discussion Our meta-analysis suggests that a range of variables are associated with dementia in primary care records. These may be taken forward to inform development of a clinical prediction model for phenotyping or risk stratifying for dementia in primary care. Cardiovascular risk factors may be especially helpful in differentiating between AD and VaD. Early signs of dementia including depression, anxiety, seizures, incontinence, weight loss and lower limb fractures are most consistently predictive across dementia types, but may only be useful in identifying cases after onset of first symptoms, potentially reducing the timescale or clinical utility of the model.
Conclusion This meta-analysis will improve selection of predictors for the ASTRODEM study, enabling us to develop a phenotyping or risk-stratification model with improved performance and clinical value compared to previous studies.
Abstract no. 129 The prevalence of Adverse Childhood Experiences in the general population of Scottish children in the first eight years of life: identification through a birth cohort study
Louise Marryat, Farr Institute Scotland, University of Edinburgh, Edinburgh, UK
John Frank, University of Edinburgh, Edinburgh, UK
Introduction Adverse childhood experiences (ACEs) were first explored in the US with adults who had medical insurance with Kaiser Permanente. Participants were asked about childhood experiences covering psychological, physical and sexual abuse and household dysfunction. Half experienced at least one ACE. More recently, a review of ACEs in England also suggested half of adults experienced 1+ ACE. ACEs have been linked to a range of adverse physical and mental health outcomes in childhood and adulthood. Despite the current interest in ACEs and their seeming importance in relation to future outcomes, a recent Scottish report concluded that ‘Although data exists on various aspects of household dysfunction in Scotland, no published studies exist to date of the prevalence specifically of ACEs in the general population of Scotland’.
Method The current study uses data from the ‘Growing Up in Scotland’ study birth cohort 1, comprising 3,119 children born in 2004/5 and followed up to age 8. Although response rates were high, differential attrition was noted for those from the most disadvantaged backgrounds. Data were described and compared with other national and international data on ACEs prevalence. Regression models were fitted to explore associations between risk factors and ACE scores. Proportion attributable risk was calculated for experiencing relative poverty in the first year of life with ACE scores at age eight.
Results Two-thirds of children experienced at least one ACE, compared with half of participants in the original study, with 3% experiencing 4+ (6.2% in the original study). ACEs were associated with deprivation: 91.8% in the most deprived areas reported 1+ ACE versus 33.8% in the most affluent areas. Having more ACEs was independently associated with being a male, of a White UK ethnicity and deprivation, having a younger mother and a mother with lower educational qualifications. The population attributable risk of living under the poverty line was 0.22, suggesting that if no children lived under the poverty line, there would be 22% fewer children experiencing 1+ ACE in the entire population.
Discussion Results indicate that a high proportion of children experience ACEs in Scotland. ACEs were strongly, but not entirely, predicted by deprivation. This may mean that interventions that target children living in the most deprived circumstances may miss less deprived children also experiencing ACEs. The study demonstrated that the use of prospective cohort data can be used to ascertain levels of ACEs, albeit with very low reports of some ACEs, such as sexual abuse. It is unclear at this stage, however, whether it is the actual experience of ACEs or the long-term impact, suggested by remembering them as an adult, which most influences future health outcomes.
Conclusion ACEs currently affect a large proportion of Scottish children, particularly those born into the most disadvantaged circumstances. Future research is planned to explore resilience to ACEs in relation to outcomes at age 10.
Abstract no. 130 Using linked cohort and health records to investigate emotional and behavioural difficulties in early childhood and risk of injury in early adolescence
Amrita Bandyopadhyay and Sinead Brophy, FARR Institute (CIPHER - Swansea) Swansea University, Swansea, UK
Ashley Akbari and Ronan Lyons, Swansea University, Swansea, UK
Karen Tingay, Administrative Data Research Centre - Wales, Swansea University, Swansea, UK
Lucy Griffiths, Helen Bedford, Mario Cortina Borja, Suzanne Walton, and Carol Dezateux, University College London, London, UK
Ashley Akbari and Ronan Lyons, Swansea University, Swansea, UK
Introduction Risky behavioural characteristics are strongly associated with the likelihood of injury, a leading cause of death in adolescence. We investigated whether early behavioural and emotional difficulties, measured using the strengths and difficulties questionnaire (SDQ), predict the risk of injury in early adolescence. We used data from Welsh Millennium Cohort Study members, linked to their health records, to examine this question.
Method There were 1683 (871 boys and 812 girls) and 1730 (895 boys and 835 girls) children at age 3 and 5, respectively, with parent reported SDQ scores, who were linked, with consent, to injury history during early adolescence (11 to < 14 years), within the Secure Anonymised Information Linkage Databank at Swansea University. First injury, recorded as primary diagnosis in hospital or emergency records, during early adolescence was considered in the study. Emotional and behavioural difficulties were estimated from individual SDQ component scores (conduct disorder (CD), hyperactivity, emotional and peer relationship problems and prosocial behaviours) and ‘total difficulty’ scores (TDSs) (categorised as ‘normal, ‘borderline’ and ‘high’). Data were analysed using non-adjusted and adjusted (family factors, socio-economic level and gender) Cox proportional hazard models.
Results High hyperactivity scores were more common at age 3 than age 5 and more prevalent in boys than girls at both ages: the prevalence of high scores at ages 3 and 5, respectively, was 16.3% (10.2% boys, 6.1% girls) and 11.2% (7.12% boys and 4% girls). Similarly, high conduct disorder scores were observed in 35.1% of three year olds (19.3% boys, 15.8% girls) and 10.6% of five year olds (7.0% boys, 3.6% girls). Of those with SDQ information available at ages 3 and 5, it was found that 662 and 671 children had an injury during early adolescence, respectively. Children with higher hyperactivity and CD scores were at increased risk of at least one injury in early adolescence. The adjusted HR (95% CI) for hyperactivity at ages 3 and 5, respectively, were 1.50 (1.12–2.02) and 1.65 (1.15–2.25) and for conduct disorder 1.25 (0.98–1.60) and 1.47 (1.04–2.09). Boys with high hyperactivity scores at ages 3 and 5 were significantly more likely to experience an adolescent injury: respective HR (95% CI) 1.60 (1.12–2.3) and 1.44 (0.96–2.16) as were girls at age 5: 2.32 (1.26–4.24). Emotional symptoms, peer problems, prosocial behaviour and TDS were not significantly associated with risk of injury.
Discussion Preschool-aged children with high (maternally reported) hyperactivity or CD scores are at higher risk of experiencing at least one injury in early adolescence. The timing of onset of hyperactivity in relation to risk varies by gender.
Conclusion The findings indicate that parent reported behavioural difficulties in the preschool years are associated with an increased risk of injury in early adolescence. Future analysis will explore the type of injury (‘accidental’ and ‘non-accidental or suspected non-accidental’) associated with the preschool behavioural and emotional difficulties.
Abstract no. 135 Using linked data from health and social care to understand patient pathways and high resource users in Scotland
Hester Ward, David Baird, Andrew Lee, Andrew Mooney, and Jamie Munro, NHS National Services Scotland, Edinburgh, UK
Introduction In 2016, Scotland brought together many of its services within Health and Social Care Integrated Joint Boards (IJB). Information and intelligence are essential to identify health and social care needs and cost and to understand high resource users (HRs), in order to target interventions effectively to produce better outcomes for patients and efficiencies.
Method A Scottish, linked health and prescribing data platform was developed, with the ability to add in community, intermediate, social, unscheduled and end of life care data over time as these data become available. A patient level costing methodology1 attributed costs to individual patient level activity. Individuals were ranked according to total resource used. HRs defined as those where cumulative expenditure reached 50% of total expenditure per financial year. Novel data mining2 techniques were used to model flow, identify common pathways and HR cohorts, focusing on 2 group geriatric service users and those with multiple emergency admissions.
Results In 2014/15, just 2% (n= 105,000) of the Scottish population (5.3 million) accounted for50% (£2.7 billion) of hospital and community prescribed expenditure (termedHRs). Over half (60%) HRs are aged over 65, 84% are suffering from at least one chronic condition and 85% of delayed discharges from secondary care are HRs. 25% of HRs are from the most deprived quintile and 31% are in their last year of life. Of surviving HRs, around a quarter remain HRs from one year to the next. Geriatric service users and those with multiple emergency admissions together accounted for 43% HRs and 21% of relevant IJBs’ expenditure. Through mapping/visualisation of care pathways and understanding characteristics of HRs, IJB decision making is informed the methodology and findings of which are relevant for other areas in the UK and other countries.
Discussion Intelligence across the integrating care sectors is key to integration. It is important to understand how clients move within and across a health and social care setting to improve their care and outcomes. There are many challenges to producing this information from multiple linked, cross-sectoral datasets, including the complexity of the individuals and the systems. However, using linked information from multiple sources, key developments can be targeted by IJBs, such as capacity modelling, care pathway redesign, risk profiling and prevention strategies.
Conclusion The use of data linkage from multiple, cross-sectoral sources to understand care journeys between and within sectors is important for effective and efficient working and to improve outcomes for patients. Beginning to understand HRs will enable more effective targeting of resources.
References
Summary of ‘PLICS’ costing methodology used in IRF mapping. Information Services Division, NHS National Services Scotland, 2014. Available from: http://www.isdscotland.org/Health-Topics/Health-and-Social-Community-Care/Health-and-Social-Care-Integration/Analytical-Outputs/_docs/IRF-Mapping-Summary-of-PLICS-costing-methodology.pdf.
Günther CW, Van Der Aalst WM. Fuzzy Mining –Adaptive Process Simplification based on Multi-Perspective Metrics, International Conference on Business Process Management 2007 (24Sep), pp. 328-343. Alonso G, Dadam P and Rosemann M (ed), Business Process Management. BPM 2007. Lecture Notes in Computer Science, Vol. 4714. Berlin, Heidelberg:Springer
Abstract no. 146 Natural language processing pilot study for clinical trial pre-screening through to enrolment
Simon Thompson, Swansea University/FARR/ADRC/CLIMB/DPUK, Swansea, UK
Introduction It is believed that over 70% of the information held by the NHS is in the form of free text. This project will look at the feasibility of this information being used to streamline the process of pre-screening for clinical trials. It will evaluate exclusion and inclusion criteria for the trial and select those people eligible for enrolment. A Natural Language Processing (NLP) tool will be applied, this is currently done manually through document review.
Method Working with the Abertawe Bro Morgannwg University Health Board and a commercial vendor, a proof of concept project was established. It would apply the existing inclusion and exclusion criteria of a current clinical trial to more than 700,000 available discharge and clinic letters. This project was enabled by the infrastructure of the National Research Data Appliance(NRDA), which had already been deployed by FARR to the health board.
Results 757,000 documents were initially injected into the NRDA comprising 232,000 individual patients. Using a link to the trust patient administration system, a filter was then applied, excluding all patients aged less than 50. This gave a final dataset of 412,000 documents representing 124,000 individuals.
Using NLP, the trial criteria were applied to the NRDA 18,000 people met at least one of the trial criteria with 291 patients meeting all inclusion and exclusion criteria. These patients were then ranked per their suitability.
Discussion The output from the system was reviewed by the clinical trial unit and found the results to be extremely accurate. The list of these patients from the NRDA was recruited into the clinical trial.
The time to ingest the 757,000 documents was 2 days; once the queries were authored and the NLP process started, 2 hours elapsed to identify 291 eligible patients. The previous manual process had taken 18 months to recruit 18 patients.
Conclusion The project clearly demonstrated that this approach is feasible and is orders of magnitude more efficient than the manual review of medical records. Although error in this process is hard to quantify, if the system can identify a tightly targeted pool of eligible patients for the trial unit, then the skills within these units can be better utilised selecting the best candidates.
We are in the process of creating a business case to expand this infrastructure to all seven health boards across Wales with the aim to encode and make available all clinical free text documents held around the country. It is hoped that the cost and time needed to do feasibility and pre-screening for clinical trials can be vastly reduced and therefore attract more clinical trials to the UK.
Abstract no. 149 Effects of national housing quality standards on hospital emergency admissions: A quasi-experiment using data linkage
Sarah Rodgers, Rowena Bailey, Rhodri Johnson, Damon Berridge, and Ronan Lyons, Farr Institute, CIPHER, Swansea, UK
Wouter Poortinga, Architecture, Cardiff University, Cardiff, UK
Frank Dunstan, Cardiff University, Cardiff, UK
Introduction National housing quality standards are being applied throughout the UK. A housing improvement programme was delivered through a local authority to bring nearly 9000 homes up to the Welsh Housing Quality Standard (WHQS). Homes received multiple elements, including new kitchens, bathrooms, windows and doors, insulation, and heating and electrical systems, through an eight-year rolling work programme. The study aimed to determine the impacts of the different housing improvements on hospital emergency admissions for all residents.
Method Intervention homes and council homes that received at least one element of work were data linked to individual health records of residents. Counts of admissions relating to respiratory and cardiovascular conditions, and falls and burns, were obtained retrospectively for each individual in a dynamic housing cohort (January 2005–March 2015). The intervention cohort criterion was for someone to have lived in any one of the intervention homes for at least three months within the intervention period. Counts were captured for up to 123 consecutive months for 32,009 individuals in the intervention cohort and analysed using a multilevel approach to account for repeated observations for individuals, nested within geographic areas. Negative binomial regression models were constructed to determine the effect for each element of work on emergency admissions for those people living in homes in receipt of the intervention element, compared to those living in homes that did not meet quality standards at that time. We adjusted for background trends in the regional general population as well as for other confounding factors.
Results People of all ages had 34% fewer admissions for cardiovascular and respiratory conditions and fall and burn injuries while living in homes when the electrical systems were upgraded, compared to the reference group (IRR=0.66, 95% CI 0.58– 0.76). Reduced admissions were also found for new windows and doors (IRR=0.78, 0.70–0.87), wall insulation (IRR=0.80, 0.73–0.87) and garden paths (IRR=0.81, 0.73–0.90). There were no associations of change in emergency admissions with upgrading heating (IRR=0.92, 0.85–1.01), loft insulation, (IRR=1.02, 0.93–1.13), kitchens (IRR=1.01, 0.87–1.18), or bathrooms (IRR=0.99, 0.87–1.13).
Discussion and conclusion Improving housing to national standards reduces the number of emergency admissions to hospital for residents. Strengths of the data linkage approach included the retrospective collection of complete baseline and follow up using routine data for a long-term intervention and a large-scale regional adjustment.
Funding This project is funded by the National Institute for Health Research through the Public Health Research (PHR) program under Project 09/3006/02. The work is also supported by the Farr Institute, a 10-funder consortium: Arthritis Research UK, the British Heart Foundation, Cancer Research UK, the Economic and Social Research Council, the Engineering and Physical Sciences Research Council, the Medical Research Council, the National Institute of Health Research, the National Institute for Social Care and Health Research (Welsh Assembly Government), the Chief Scientist Office (Scottish Government Health Directorates), and the Wellcome Trust under MRC Grant MR/K006525/1.
Abstract no. 150 Associations between medication safety and use of an electronic medication safety dashboard in primary care
Wouter T. Gude, Academic Medical Center/University of Amsterdam, Amsterdam, The Netherlands
Richard Williams, Markel Vigo, Evangelos Kontopantelis, Mark Jeffries, Richard Keers, Darren Ashcroft, and Niels Peek, University of Manchester, Manchester, UK
Introduction The electronic nature of modern audit and feedback interventions creates opportunities to create a fine-grained picture of their effects on clinical decision making, by analysing interaction data that are a by-product of their use. The Salford MedicAtion Safety dasHboard (SMASH) intervention uses an electronic dashboard and trained clinical pharmacists to improve medication safety in primary care. The objective of this study was to assess how the dashboard was used, and how this was associated with improvements in medication safety.
Method The SMASH intervention was rolled out in 11 general practices in Salford, UK. The dashboard interrogates electronic health records using a set of 13 medication safety indicators and presents the resulting information to its users in both aggregated form and as lists of individual patients with potential safety hazards. Clinical pharmacists were aligned to participating practices to assist practice staff in resolving safety hazards identified by the dashboard for a period of 12 weeks (intervention period) and were free to continue using the dashboard (follow-up period). We analysed the database of identified safety hazards and log files of user interactions with the dashboard during the first 6 months of its deployment.
Results Eleven general practices had used SMASH for a mean period of 17 weeks (range 4 to 25) at the time of analysis. During the intervention period, 729 potential medication safety hazards in 677 unique patients were identified by the dashboard. The dashboard was used 1.6 (SD, 0.6) times by pharmacists and 0.2 (SD, 0.2) times by practice staff per week during intervention period, respectively, and 1.0 (SD, 0.7) and 0.4 (SD, 0.3) times per week in the follow-up period. Use by pharmacists decreased over time (−0.025 times per week 95% CI, −0.500 to −0.001), whereas the use by practice staff remained constant. Users viewed a page listing one or more patients with potential safety hazards in 56% (n = 217) of interactions 50% of hazards had been viewed after 7 days and 90% after 59 days. Hazards had been resolved after a median time of 102 days. At the end of the study period, 97% of hazards had been viewed at least once and 72.4% of identified hazards had been resolved. Higher interaction frequency was associated with faster resolution of hazards (36.7 days faster for each additional interaction per week 95% CI, 7.7 to 65.6).
Discussion This study illustrates how user interaction logs can be used to evaluate use of health informatics interventions in clinical practice. We may have overestimated the time it took for hazards to be resolved because several indicators relied on 3-month follow-up data to ensure that prescriptions were not reissued. However, this is unlikely to have affected the identified relationship between interaction frequency and hazard resolution follow-up research should point out whether this represents a causal relationship. If so, this research implicates that increased efforts to make sure participants use the dashboard benefits patient safety.
Conclusion A more frequent use of an electronic medication safety dashboard was associated with quicker resolution of medication safety hazards.
Abstract no. 154 Designing a decision aid to improve secondary prevention for stroke survivors with multimorbidity: A stakeholder engagement study
Talya Porat, Iain Marshall, Euan Sadler, Miguel A. Vadillo, Vasa Curcin, Christopher McKevitt, and Charles Wolfe, King’s College London, London, UK
Introduction Stroke survivors are at a high risk of a recurrent stroke, which is likely to be more disabling and fatal than first time strokes. Secondary prevention requires health professionals to offer interventions to monitor and manage risk factors (e.g. blood pressure and antithrombotic treatment) and patients to change health-related behaviours, such as smoking and diet, and adhere to preventative medications. Currently, vascular risk factors tend to be neither well managed nor controlled. In this study, we engaged stakeholders to iteratively design a decision aid informed by an integrated clinical and research dataset, aiming to facilitate shared decision making (SDM) on effective treatments for secondary stroke prevention and motivate the patient to adhere to the selected treatments thereby reducing the risk of recurrence.
Methods We used a range of methods to engage stakeholders (n=37), including service users (n=11), general practitioners (GPs, n=6) and other health and social care professionals (n=10), commissioners, service managers, policy makers, the third sector (n=6) and researchers (n=4). This engagement process involved: 1) initial exploration of priorities in long-term stroke care and intervention solutions through stakeholder engagement meetings, focus groups, nominal group techniques (priority setting and consensus building) and face-to-face interviews, 2) group discussions with stakeholder representatives (service users, GPs, health care professionals and commissioners), as part of core stakeholder group to discuss preliminary design interventions, reach agreement by consensus and prioritisation to develop a decision support aid targeting secondary prevention after stroke and 3) subsequent iterative review and design of the intervention with stakeholder representatives and a stroke service user research group. All qualitative data were analysed thematically.
Results The final design of the decision aid enables:
the patient to indicate his/her perceived risk of having a recurrent stroke
calculates the patient’s predicted stroke risk based on rules generated from the South London Stroke Registry (SLSR) using risk prediction algorithms
displays the most effective treatments and their relative benefit
presents common concerns for each treatment to elicit preferences
allows the GP and patient to decide on a management plan while identifying desired clinical and patient outcomes.
Discussion The stroke decision aid is a personalised multifaceted tool to be used by the GP and stroke patient during the consultation to facilitate SDM on effective treatments for secondary stroke prevention and motivate patients to adopt healthier behaviours, thereby reducing the risk of recurrence. The tool contains several unique features that may not have been identified in a researcher-led design process. These include prioritising treatments, communicating risk in an understandable way and incorporating patients’ desired outcomes on the management plan, which first need to be evaluated and then adapted to other decision aids supporting complex clinical conditions.
Conclusion The design of the tool has the potential to improve secondary prevention among stroke survivors by helping physicians to propose the most effective patient-centred treatments for the patient and allowing patients to decide on the treatments that best suit their preferences and desired outcomes. The evaluation is currently ongoing and initial findings will be reported.
Abstract no. 157 Evolution of IgE responses to multiple allergen components throughout childhood
Rebecca Howard, Panagiotis Papastamoulis, Angela Simpson, and Magnus Rattray, University of Manchester, Manchester, UK
Danielle Belgrave and Adnan Custovic, Imperial College London, London, UK
Introduction Allergic sensitizations can be assessed with high resolution through component-resolved diagnostics (CRD), which measures specific IgE antibodies to a large number of individual allergenic proteins (components) from multiple sources. We hypothesize that there are distinct longitudinal developmental patterns of component-specific IgE responses that are associated with different clinical presentations of allergic diseases (such as asthma and rhinitis) and that we can use the pattern of responses in early childhood to predict later clinical outcomes.
Methods In a population-based birth cohort study, we measured sIgE to 112 components using ISAC multiplex allergen chip at ages 1, 3, 5, 8, 11 and 16 years. At each age, we clustered allergen components based on their sIgE response profiles across participants to identify sets of closely associated components. We developed a Bayesian method to estimate a mixture of Bernoulli distributions from the binary data and used it to discover the number and composition of clusters at each age. Each participant’s IgE response profile was reduced based on their responses to each of these clusters. We assessed clinical outcomes at age 16 years (current wheeze, asthma and rhinitis) and investigated the associations of clusters at age 5 with clinical outcomes at age 16 years.
Results After testing on synthetic data, we applied our clustering method to CRD data available for 922 children. One sensitization cluster was identified at age one year, 3 at age three, 4 at ages five and eight, 5 at age 11, and six at age 16 years. We qualitatively labelled clusters based on the profile of allergen components to which sensitization occurred. For each time point, the ‘broad’ cluster comprised of components originating from multiple sources and was the only cluster identified at every time point. From age three, the ‘House Dust Mite’ cluster (consisting of four mite components) formed and remained unchanged by age 16. At age three, a single-component ‘grass’ cluster emerged. This cluster absorbed additional three grass components and one cat component Fel.d.1 to form the ‘grass/cat’ cluster at age five. Two new clusters formed at age 11: ‘cat’ cluster (comprising of Fel.d.1) and ‘PR-10/profilin’ cluster. The latter cluster divided at age 16 into the ‘PR-10’ and ‘Profilin’ clusters. Cluster membership at age 5 predicted clinical outcomes at age 16 years. Asthma and wheeze were strongly associated with the ‘grass/cat’ cluster (ORs 9.97 [95% CI, 4.58–21.70, P<0.001] and 5.68 [95% CI, 2.82–9.60, P<0.001], respectively), while rhinitis was associated with sensitization to the ‘broad’ cluster (ORs, 7.40 [95% CI, 4.35–11.48, P<0.001).
Discussion and Conclusion Different patterns of sIgE responses to multiple allergen components evolve throughout childhood and can be uncovered using our clustering method. Sensitization patterns at early ages are predictive of disease status at age 16. Recent NICE guidelines do not recommend the use of CRD in the diagnosis or management of asthma, citing a lack of evidence. Our results provide the first evidence on clinical utility of CRD data in the prediction of allergic disease throughout childhood.
Abstract no. 159 A data-driven approach for identifying falls subgroups through semantic similarity analysis
Muhannad Almohaimeed and Thamer Ba-Dhfari, Health eResearch Centre, Farr Institute for Health Informatics Research, The University of Manchester, Manchester, UK
Andrew Brass, Division of Informatics, Imaging and Data Sciences, School of Health, The University of Manchester, Manchester, UK
Introduction The information contained within medical data is often used to make new medical discoveries. However, the most common way to use such data has been to query the data to answer very specific questions. For example, does having diabetes cause some patients to experience falls? If researchers have good questions, then the data can provide good answers. However, are there any other equally important questions that could be asked of the data that people have not yet thought to ask?
We are exploring a new strategy that we have developed to look for unusual and interesting patterns about falls in the elderly subgroups level to see the different risks associated with different groups. Some of these risks will be associated with questions that are already well known, but some should point to new and important questions that have not yet been asked. This opens up a better opportunity to identify patients at risk of falls, helping guide policy so as to reduce falls.
Methods We mapped patient records into a low-dimensional space using the notions of semantic similarity (Resnik node-based) and machine learning (principal component analysis) to provide a good representation of the data. This representation was used for clustering and visualisation through the DBSCAN algorithm. To look for enrichment in the resultant clusters, we analysed each cluster separately and look at the sets of patients defined in these clusters. Then, classic data mining techniques were used in order to generate hypotheses. The associations found were then be tested using more traditional comorbidity measures such as relative risk and its confidence intervals.
Results and discussion We demonstrated the methodology on 589,169 older adults from the Clinical Practice Research Datalink. We successfully identified six distinct subgroups of falls from the elderly population who are identified with different risks. Some of the associations found are well defined in the literature, for example depression and musculoskeletal conditions are significantly associated with falls. However, a number of associations are not reported in the clinical literature. Such hypotheses need further exploration by epidemiologists.
Conclusion Future work will focus on incorporating temporal dimension, which might provide useful insights into missed opportunities detection and risk modelling and understanding of a disease. Last, this methodology holds promises for the study of other complex diseases using any source of data, which are described using terms from taxonomies or ontologies.
Abstract no. 163 Linking mental health to social network data
Akkapon Wongkoblap, Department of Informatics, King’s College London, London, UK
Miguel A. Vadillo, Primary Care & Public Health Sciences, King’s College London, London, UK
Vasa Curcin, Departamento de Psicología Básica, Universidad Autónoma de Madrid, Madrid, Spain
Introduction Around the world, we are seeing an increasing number of people suffering from mental health conditions. The World Health Organisation estimates that there are over 3.5 million global patients with depression. In the UK, nearly 25% of the population suffers from at least one mental illness. The global economic burden of mental health problems reached U.S. $2.5 trillion in 2010 and is expected to grow to U.S. $6.0 trillion by 2030. Thus, new approaches are needed to deal with the scale of the problem. With the advent of social networks, people tend to disclose their emotions, feelings, and thoughts on social network platforms such as Facebook and Twitter, resulting in growing interest in detecting early stages of mental illness associated with user-generated content on these platforms using machine learning to find representative symptom patterns and construct predictive models.
Method We have surveyed the relevant sources to establish the current state of mental health research using social network data. The search was conducted using PRISMA methodology on PubMed, IEEE, ACM, Web of Science and Scopus.
Results In total, 4,606 articles matched our keywords for search and were further screened according to defined inclusion criteria, giving a final set of 39 papers. The important processes of predicting mental health based on social network data were categorised into data collection, pre-processing, feature extraction, feature selection, model construction and model validation. The standard machine learning techniques focused on textual posts by the users, with the Linguistic Inquiry and Word Count extraction tool,1,2 while some predictive models partly based on image analysis3 and social graph analysis.4 To build predictive models, support vector machine, regression, decision trees, and deep learning techniques5 were trained by extracted features from those methods. We also focused on the ethical concerns surrounding use of social network data for research.
Discussion Predictive models were successfully used to detect users with mental health problems in several studies; however, the framework for conducting this type of research work is still in its infancy, e.g. there is no consensus on the ethical requirements, with some studies going for full Institutional Ethics Board approval, while others assumed that the data scraped from social networks can be considered public.
Conclusion Based on the reviewed articles, we found that despite promising technical achievements, successful automated mental health interventions based on these technologies are still lacking. This is largely due to a methodological gap that prevents these ideas from being evaluated in standard clinical studies.
References
de ChoudhuryM, GamonM, CountsSand Horvitz E, Predicting Depression via Social Media, ICWSM, 2013.Available from: www.aaai.org/ocs/index.php/ICWSM/ICWSM13/paper/viewFile/6124/6351.
Coppersmith G, Dredze M and Harman C, Quantifying Mental Health Signals in Twitter, ACL, 2014.Available from: www.aclweb.org/anthology/W14-3207.
Kang K, Yoon C and Kim E, Identifying depressive users in Twitter using multimodal analysis, International Conference on Big Data and Smart Computing, IEEE Computer Society 2016:231–6.
Wang X, Zhang C and Sun L, An improved model for depression detection in micro-blog social network, 13th International Conference on Data Mining Workshops (ICDMW), Dallas, 2013.
Lin H, Jia J, Guo Q, Xue Y, Li Q, Huang J et al., User-level psychological stress detection from social media using deep neural network, Proceedings of the 22nd ACM international conference on Multimedia, Orlando, Florida, USA, 2014.
Abstract no. 164 A UK data discovery lattice
Colin Veal, Dhiwagaran Thangavelu, Tim Beck, Vagelis Ladas, Charalambos Chrysostomou, Owen Lancaster, and Anthony Brookes, University of Leicester, Leicester, UK
Introduction Data ‘sharing’ cannot be optimized without a supportive layer of data ‘discovery’ approaches, i.e. enabling data seekers to query for the ‘existence’ rather than the ‘substance’ of particular datasets. Ideally, such services will evolve and grow into a comprehensive lattice of resources that can be universally interrogated in discovery mode by suitably authorized users. To this end, Cafe Variome (www.cafevariome.org) provides flexible/customisable, Web-based, data discovery capabilities that can be quickly installed by any genotype–phenotype data owner, or network of data owners, to make safe or sensitive content appropriately discoverable. Cafe Variome ensures data owners/custodians retain full control of data in their systems and returns a simple response (i.e. yes/no or a count of query ‘hits’) to queries by data seekers. It can also optionally enable secure communication between both parties to facilitate data access negotiations.
Method Cafe Variome is a highly configurable modular system consisting of the following mechanism: A data component that stores and formats discoverable data for rapid searching, whereby different records and/or fields or versions can be made discoverable to different classes of users/networks.
A query component that includes simple and advanced ‘query-builder’ interfaces enabling queries to be formulated on diverse data types from simple ID and label fields to extensive genotype and phenotype details based, all optionally constrained by ontologies.
An administration component where a data custodian specifies who can perform discovery on which data sets (and whether they can view whichever parts of the data) create or join federated discovery networks employing Cafe Variome and change the site appearance/branding.
Discovery using Cafe Variome can operate within projects, between groups within institutes, between networks of data owners and via ‘shop window’ public websites.
Results Current EU and UK exemplar implementations support multi-site Alzheimer subject recruitment, matching across rare disease mutation registries (EDS Consortium), discovery of big-pharma toxicity data (EU-eTOX) and biomaterial finding based on tissue type and sample characteristics (UK-HCV). Locally, members of Leicester’s Biomedical Informatics Network for Education, Research and Industry have established a Cafe Variome implementation for cohorting via biobank genotype and phenotype content (Leicester Bioresource).
Discussion Data ‘discovery’ approaches are in their infancy and user requirements will change with time, and thus Cafe Variome is under continuous development to anticipate and respond to these requirements. We are now adding support for querying by data use conditions (e.g. using the GA4GH ‘ADA-M’ standard), a modular OAuth2 system to enable discovery with trusted alternative discovery providers (e.g. GA4GH Beacons), interactive graphical display of datasets summaries and a genomics browser query and display interface.
Conclusion The increasing need to ‘share’ data has to be accompanied by methods to ‘discover’ the existence of data while keeping that data secure. Cafe Variome is a flexible system that enables rapid querying of datasets on single systems or across federated networks while allowing data owners to retain full control.
Abstract no. 165 Switching medical terminologies should be easy
Shao-Fen Liang, Division of Social and Health Care Research, King’s College London, London, UK
Talya Porat, Archana Tapuria and Vasa Curcin, King’s College London, London, UK
Jean-François ETHIER and Brendan Delaney, Imperial College London, London, UK
Introduction Mappings between codes in different medical terminologies are seen as a part of medical data analysis among ICD10, SNOMED CT and READ clinical terminology. Looking up terminologies from Unified Medical Language System Terminology Service (UTS) is one of the ways of achieving this. However, the service provided by the US National Library is too general for users to be able to filter out unwanted information. Another route is to use the NCBO BioPortal, via an online ontology browsing facility. Terms collected in each ontology have been organised in a structured tree for a better visualisation. However, multiple ontologies cannot be used simultaneously, and there is a need to facilitate this task for medical data researchers who do this on a regular basis.
Method We propose MeTMapS, a simplified, easily maintainable dynamic system for mapping terminologies. UTS APIs are used to retrieve Unified Concept Identifier (CUIs) with user-specified terminologies displayed in hierarchical views using the BioPortal tree widget. The hierarchical tree display contains check boxes for each term, allowing users to design their own mapping from one terminology to others.
Results All the information in MeTMapS is displayed on a single page for increased visibility. There are four main functions: 1. searching for a term in selected terminologies, 2. creating mappings between terminologies, 3. removing unwanted mappings if necessary and 4. storing produced mappings for further use.
Discussion The system was tested with clinicians, clinical informaticians and IT specialists, investigating both usability and terminology mapping perspectives. The feedback shows the users find the system guidance clear and there was no confusion or hesitation noted while using the tool. The system relies on both BioPortal and UTS, ensuring the results are dynamic and up to date. MeTMapS can also handle terminologies, which have not yet been included in UTS. Once a paired terminology and mapping files are uploaded into BioPortal and MeTMapS, respectively, the newly created terminology is ready for use.
Conclusion Our work is aimed at easing the terminology mapping burden for medical data scientists. The system has been designed with usability in mind, and for a broad user base and is being launched online as a free service.
Abstract no. 166 A protocol for integrating between decision support systems and electronic health records
Samhar Mahmoud and Vasa Curcin, King’s College London, London, UK
Derek Corrigan, Royal College of Surgeons in Ireland, Dublin, UK
Brendan Delaney, Imperial College London, London, UK
Introduction Learning health systems (LHSs) rely on routine extraction, aggregation and transformation of medical data from a variety of sources into actionable clinical knowledge. Diagnostic decision support systems (DDSSs) are tools that are suitable for delivery using the LHS model; however, their acceptance has been hampered by perceived usability problems that hinder clinicians’ workflow. A significant challenge identified is the need for fully integrated DDSS into EHRs. Before addressing semantic integration and data privacy issues involved in the communication between a DDSS and an EHR, there is a need to agree on a standard dialogue of messages exchanged in the process of generating a DSS recommendation. To that goal, we present an abstract protocol based on service-oriented architecture for integrating DDSS with EHR, describing the messages and data content required at each step of the task.
Methods Abstract integration model: We assume a general DSS is split into three logical units. The evidence service (ES) is the diagnostic knowledge base, the decision support mediator (DSM) coordinates communication between the EHR and ES decision support interface (DSI), which is a graphical front-end embedded into the EHR. The sequence of interactions comprises three phases.
Initialisation and data extraction: The diagnostic consultation starts by extracting patient EHR data, while the DSI captures the main presentation reason. All data are then passed to the ES as a diagnostic question. The ES response is an initial ranked list of diagnoses to consider, each accompanied by a list of cues and examinations pertinent to each diagnosis.
Data capture: Further diagnostic cues are captured in a structured manner by the DSI. In each iteration, every newly captured cue is sent to the DSM and the ES to obtain an updated ranked differential diagnosis list for display to the clinician, followed by an optional capture of a working diagnosis.
Data storage: The final step is to write back the captured diagnostic cue data into the patient record using EHR compatible format.
Results The resulting interaction protocol has been successfully implemented in a prototype DDSS, supporting both data extraction and recording to the EHR. The tool, developed as part of the TRANSFoRm project, has been integrated with Vision v3, a leading UK EHR system for general practice. The interaction with Vision is through a specialised API that requires XML formatting of data. Data extracted involves risk factors, lifestyle activities and demographics. The communication with the ES uses rest service calls and XML format for data exchange. The usability evaluation of this prototype has shown that the clinical decision-making has improved by 8%.1
Discussion and Conclusion This work presents a step towards the standardisation of the integration between decision support tools and electronic health record systems. We have outlined the main interactions steps that are needed to perform such integration, and we explained how it was applied with a leading EHR system in the UK.
Reference
Kostopoulou O, Porat T, Corrigan D, Mahmoud S and Delaney BC. Supporting first impressions reduces diagnostic error: evidence from a high-fidelity simulation (In Press). British Journal of General Practice. 2016.
Abstract no. 168 Public benefits: a central justification and problematic dimension of health informatics
Mhairi Aitken, Carol Porteous, and Sarah Cunningham-Burley, University of Edinburgh, Edinburgh, UK
Introduction Public benefits serve as a key justification underpinning health informatics research and a driver for increasing secondary use of routinely collected public sector data. Moreover, previous research has pointed to perceived (potential or actual) public benefits as crucial for public support for research using people’s data. Nevertheless, while ‘public benefits’ are routinely referred to, this remains an under-theorised and under-researched topic. Given the increasing interest in public acceptability of health informatics research, and in light of recent highly publicized controversies relating to secondary uses of data, understanding what ‘public benefit’ means to different groups is vital for ensuring that health informatics research proceeds in ways which reflect public interests.
Method This paper reports on a programme of research activities exploring the ways in which public benefits are conceptualized by both researchers and members of the public. This includes a thematic synthesis of literature on public responses to data linkage, a discrete choice experiment examining factors influencing public preferences around data linkage, interviews with researchers and deliberative meetings with public panels associated with the Farr Institute, Scotland and Administrative Data Research Centre, Scotland.
Results Among the public, there is widespread conditional support for health informatics research, but a key condition for this support is that the research has, or is expected to have, ‘public benefits’. Where people are not convinced of claims to (potential) public benefits, they are likely to be critical of other aspects of the research. Therefore, assurances of public benefit are central to public responses and acceptance. However, public benefits are understood and conceptualised in different ways. We find that researchers and other stakeholders involved in health informatics often have different understandings of what constitutes a public benefit compared to members of the public. Additionally, there are a range of perspectives within the public. For example, for some wealth creation, profits are considered public benefits, while others perceive a clear distinction between public benefits and private, commercial or economic benefit. For some public benefits are discussed in terms of ‘the greater good’, while others consider that research using data of particular patient groups should principally benefit those individuals or the particular patient group.
Discussion Our research examines the various ways that public benefits are conceptualized and understood. It is clear that while this term is routinely used as a rationale underpinning health informatics research, it is not clearly defined. Despite being crucial to decisions of which research is conducted, the differences and tensions within understandings of ‘public benefit’ typically remain implicit.
Conclusion By highlighting the tensions in understanding, our research highlights the importance of understanding public perspectives in order to ensure that research proceeds in publically acceptable ways. Moreover, greater theorization and deliberation of the concept of ‘public benefits’ would be helpful to pursue a common understanding of what this means and how public benefits can be realized and maximized.
Abstract no. 169 Clinical code set management: a review of methods reported in the literature
Richard Williams, NIHR Greater Manchester Primary Care Patient Safety Translational Research Centre, The University of Manchester, Manchester, UK
Evangelos Kontopantelis and Niels Peek, The University of Manchester, Manchester, UK
Iain Buchan, Farr Institute, MRC Health eResearch Centre (HeRC), Division of Informatics, Imaging and Data Sciences, School of Health Sciences, Faculty of Biology, Medicine and Health, University of Manchester, Manchester, UK
Introduction The creation of sets of clinical codes for querying routine healthcare databases is an important part of using such data for research. It is usually an early step and a hazardous one, where missing or wrongly specified codes result in selection biases that propagate throughout subsequent analyses. Reviews have shown that code sets are rarely reported in publications, let alone their construction process. This process is the key, as the explicit methodology could be peer reviewed, and reused by others to improve their research. We review methods for managing (constructing, sharing, revising and reusing) clinical code sets reported in the literature and develop recommendations.
Method A PubMed literature search was performed to exhaustively search for methodological papers on code set management published until August 2016. This included papers whose title/abstract contained any of ‘code set’, ‘set of codes’, ‘code list’, ‘list of codes’ or ‘value set’. The list was supplemented with papers identified by searching citations of relevant material, via snowball sampling. In total, 659 papers were screened with 629 rejected for lack of relevance (544 title, 46 abstract and 39 full text). This review is based on 30 papers.
Results Although differences existed between the methods described, common themes emerged. A popular approach was to reuse an existing code set (n = 21) from a previous study (n = 5) a national clinical quality management scheme (n = 11) or both (n = 5). The reused set was often updated or extended (n = 20). Authors reported some specific strategies: exploiting the hierarchical nature of coding terminologies (n = 23) preparing a synonym list to search for (n = 20) employing an iterative approach after preliminary searches (n = 13). The putative sets were usually reviewed (n = 26), mostly by clinicians (n = 20), before definitive use. There were frequent calls for openness and sharing of code sets and code set management methods (n = 14), with some giving actual suggestions or platforms for sharing (n = 8). The need for sensitivity analysis (n = 19) and caution due to the temporal and dynamic nature of code sets (n = 13) were also mentioned. Seven papers described software to support the selection of code sets and a further two suggested features for such tools.
Discussion The process of constructing clinical code sets is time consuming and error prone. This review has identified and analysed the code selection methods that are commonly reported, which probably reflects better practice than in those studies where methods are unreported. However, despite the existence of relevant software tools, their use is seldom reported, suggesting that they are underused. Potential barriers to their uptake might be lack of awareness of their existence ignorance of their necessity or deficiencies in the tool themselves, either in functionality or that they are time consuming to use. To facilitate the widespread adoption of software tools for code set construction, they should be quick and easy to use have minimal setup facilitate the reuse, validation and sharing of code sets and not simply their construction.
Conclusion Research using healthcare databases could be improved through the further development, more widespread use and routine reporting of the methods by which clinical codes were selected.
Abstract no. 170 Fast and simple text classification gets things done
Berry de Bruijn, National Research Council, Ottawa, Canada
M. Scott Marshall, The Netherlands Cancer Institute, Amsterdam, The Netherlands
Andre Dekker, Department of Radiation Oncology (Maastro Clinic), GROW School for Oncology and Developmental Biology, Maastricht University Medical Centre, Maastricht, The Netherlands
Introduction Research in Clinical Text Analytics tools has pushed the envelope in terms of accuracy, but virtues such as simplicity and computational efficiency tend to be sacrificed. In this study, we set out to do specifically not that. We forego domain resources, ontologies, language resources, background corpora and precise parameter optimization in pursuit of simplicity and flexibility. We demonstrate that such a machine-learned text classifier can still achieve competitive effectiveness. We also illustrate that the tool can be used when full domain adaptation is not practical or possible.
Method Within the EURECA project (FP7-ICT-2012-6-270253), a text classifier was developed, based on earlier efforts. It can be trained and applied for three uses: assigning a label to (1) an entire string of text, (2) a concept in text given its context and (3) the relationship type between two concepts in text. Scenario (2) is used here. The classifier is entirely based on surface strings: sequences of characters (up to 7) and words (up to 4) with wildcards. The surface string analysis leads to a high-dimensional (into the millions) but sparse vector representation, which is fed into a standard linear classifier (LibLinear). Annotation efforts can be limited, as training starts at ∼100 instances. We validate the classifier reusing data and method of the 2010 i2b2 challenge on assertion detection.1 It predicts the state of a symptom (given its context) as present, absent, possible, conditional, hypothetical, or applicable to someone else. We also explore its use on clinical text from MAASTRO Clinic (in Dutch and containing OCR errors), aiming to assess patients for trial eligibility through metastasis status (a common exclusion criterion).
Results On the i2b2 data, the benchmark is formed by 0.9362 precision = recall = F1,2 achieved by a fully decked-out and optimized system. Our bell-less and whistle-less classifier scored 0.9230, virtually ranking 10th among the 21 challenge participants. Training and application over 72k instances dropped from multiple hours originally, to roughly 5 min.
On the MAASTRO data, the classifier was trained on 272 training instances from 30 patient records and applied to 1116 instances across 133 patients. Measured over instances, F1 = 0.85 in a three-way classification (metastasis confirmed/suspected/ruled out). Over patients, the tool labelled 32 as requiring manual review, 65 as ineligible (fallout 6.0%) and 36 patients as likely eligible (precision 89%). A baseline system using regular expressions gave 32% fallout.
Discussion The i2b2 replication indicates how, for practical applications, the much reduced system complexity might outweigh the limited drop in performance. The MAASTRO application indicates that transfer of the classifier to a new domain is readily feasible, giving reasonable output with limited training. This classifier reduces manual screening time by 75%.
Conclusion A versatile and efficient machine classifier is presented, which deliberately avoids language, domain, or computationally expensive resources such as stemmers, parsers, thesauri, ontologies and word embedding algorithms. It is demonstrated to be a compelling candidate for practical application.
References
Uzuner Ö, South BR, Shen S and DuVall SL, 2010 i2b2/VA challenge on concepts, assertions, and relations in clinical text Journal of the American Medical Informatics Association 2011; 18(5):552–6. doi:10.1136/amiajnl-2011-000203.
de Bruijn B, Cherry C, Kiritchenko S, Martin J and Zhu X, Machine-learned solutions for three stages of clinical information extraction: the state of the art at i2b2 2010 Journal of the American Medical Informatics Association 2011; 18(5):557–62. doi:10.1136/amiajnl-2011-000150.
Abstract no. 173 An information system for real-time gastro-intestinal surveillance monitoring
Barry Rowlingson, Peter Diggle and Alison Hale, Lancaster University, Lancaster, UK
Introduction As part of the Integrate project, we have developed a system for the receipt, analysis, and presentation of spatio-temporal modelling of daily reports of gastro-intestinal symptoms to the NHS111 telephone service.
Method A cluster of virtual machines running on Lancaster University private cloud systems is now used to securely receive daily data from Public Health England containing all calls to NHS111 that are triaged into vomiting or diarrhoea classes. A daily task runs and computes probabilities of exceeding multiples of the baseline risk over English postcode districts. These probabilities are computed via a spatio-temporal conditional auto-regressive model over three syndrome groups and age bands. Warnings of high-level exceedance probabilities are emailed to public health staff, and a Web-based interactive mapping application allows browsing of the predictions of the day and historical data.
A number of technologies are being used: public key encryption for data transfer spatio-temporal MCMC models in the R language parallel processing for speed and efficiency Web-maps produced using the ‘leaflet’ mapping engine within an R-based ‘Shiny’ Web framework system monitoring and failure alerting using the healthchecks.ioservice.
Results The system has been operational since August 2016 and has detected nothing as significant to report as of early November 2016. We expect to continue running until at least March 2017.
Discussion Spatio-temporal modelling of NHS call data was first done in the early 2000s by the AEGISS project. At that time, call data was geolocated to the unit postcode. The present application only has spatial precision of postcode district (e.g. PO11 rather than PO11 1AB). This imprecision means the current application cannot detect small, tight clusters that may constitute an outbreak. We are currently re-analysing the data from 2000 to 2004 to assess the effect of having area-based data on different scales. We expect this may inform the design of future spatial surveillance systems.
Conclusion The system demonstrates integration of several computing systems with dedicated functions for disease surveillance. Many of the principles applied here can be used generally for similar applications. We expect to build more such systems in the future, using both open and restricted data.
Abstract no. 177 Use of national health service electronic dental treatment records in dental public health genetics research
Mairead Bermingham, Archie Campbell, and David Porteous, Centre for Genomics and Experimental Medicine, Institute of Genetics and Molecular Medicine, University of Edinburgh, Edinburgh, UK
Angus Walls, Centre for Cognitive Ageing and Cognitive Epidemiology, University of Edinburgh, Edinburgh, UK
Introduction Electronic health records provide unprecedented opportunity for their re-use for many purposes, including public health genetics research. However, electronic health record data from clinical settings, such as dental practices, can be inaccurate or of insufficient granularity to be of use. In this study, we wish to determine the utility of National Health Service (NHS) electronic dental treatment records in dental public health genetics research. The objective of this study is to estimate the heritability of periodontal disease using NHS electronic dental treatment records linked to health and non-health data within the Generation Scotland: Scottish Family Health Study (GS:SFHS).
Method We linked 852,355 NHS Scotland electronic dental treatment records from April 2000 to July 2015 to 20,626 participants within GS:SFHS with pedigree, genomic, sociodemographic and clinical data. We then conducted a proof-of-principle genetic analysis using periodontal (gum) disease treatment records. The dataset analysed consisted of 160,508 dental treatment records from 13,717 study participants 3,387 of which were periodontal treatment records (from 2,192 study participants). A repeatability model in ASReml statistical software was used to model the longitudinal data. We adjusted for the effects of previous treatment record, interval since last treatment, age, sex, treatment year, and treatment month, Scottish Index of Multiple Deprivation, alcohol consumption, diabetes diagnosis and smoking status. The dataset was too large to allow for the partitioning of genomic variation in ASReml. We therefore extracted residuals from the repeatability model and fit them in a linear mixed model (with correction for population stratification) in the genome-wide complex trait analysis software package, to estimate the pedigree and genomic based heritability of periodontal disease.
Results We estimated the familial heritability of periodontal (gum) disease at 10.42% (95% confidence interval 5.97%–14.88%). The genomic component did not contribute significantly to the heritability estimate.
Discussion We have demonstrated the usefulness of electronic dental treatment records in dental public health genetics research. This study has also, to the best of our knowledge, provided the first population based estimates of the genetic parameters for periodontal disease confirming its familial nature.
Conclusion The invaluable and unique NHS Scotland electronic dental treatment record resource will allow the acceleration of dental public health genetics research in Scotland and the exploration of research questions that could not be considered previously.
Abstract no. 185 Serotonin reuptake inhibitor use and mortality in epilepsy: findings from a contemporary linked electronic health records cohort study
Colin Josephson, Nathalie Jette, Tolulope Sajobi, Scott Patten, and Samuel Wiebe, University of Calgary, Calgary, Canada
Arturo Gonzalez-Izquierdo, Spiros Denaxas, and Natalie Fitzpatrick, University College London, London, UK
Jordan Engbers, Desid Labs, Calgary, Canada
Introduction Selective serotonin reuptake inhibitors (SSRIs) have been associated with reduced risk of seizure-related death in murine models of epilepsy. We therefore sought to examine the relationship between SSRI use and mortality in patients with epilepsy using electronic health records (EHRs).
Methods A published case definition for epilepsy was used to extract a cohort of patients from the CALIBER resource (which contains national linked structured EHR data from primary care, hospital care and a cause-specific mortality registry) between 1 January 1997 and 31 March 2010. We selected only those patients with active epilepsy defined by the failure to achieve 12-month seizure freedom over the duration of follow-up. The primary outcome was all-cause mortality treating SSRI use as a time varying covariate in a Cox proportional hazard regression model. Patients were considered exposed following their second SSRI prescription. We also evaluated the temporal association between SSRI use and mortality by dividing follow-up into 6- and 12-month epochs. We then used competing and cause-specific risk models with Firth correction to evaluate the association between SSRI use and possible seizure-related death. All regression models controlled for age, sex, depression status (past or current as defined by a previously published case definition), Charlson comorbidity index and Townsend index (a measure of social deprivation).
Results We identified 2,718,952 patients in CALIBER of whom 16, 379 (0.60%) had epilepsy and 11,938 were considered to have active epilepsy. Median age and follow-up were 44 (interquartile range (IQR) 30–62]) and 5.9 years (IQR 2.7–10.2 years) respectively. A total of 1526 patients (13%) had at least two SSRI prescriptions. Hazard of all-cause mortality was significantly higher following a second prescription for an SSRI compared to one or no prescriptions (hazard ratio (HR) 1.61, 95% confidence interval [95% CI] 1.37–1.89, p < 0.001). This was lower than the hazard calculated for 180,199 age, sex, and GP practice matched control methods without epilepsy (HR 2.05, 95% CI 1.91–2.18, p < 0.001). In those with epilepsy, the hazard of all-cause mortality was also elevated when SSRI exposure and mortality were tabulated individually during 6-month (HR 1.08, 95% CI 1.02–1.14, p = 0.002) and 12-month (HR 1.06, 95% CI 1.02–1.09, p < 0.001) epochs of follow-up. There was no significant difference in the hazard of possible seizure-related death whether analysed by time-varying exposure to a second SSRI (HR 1.01, 95% CI 0.46–2.20, p = 0.972) or during discrete 6-month (HR 1.06, 95% CI 0.83–1.35, p = 0.63) and 12-month epochs (HR 1.04, 95% CI 0.88–1.23, p = 0.0.63) follow-up.
Discussion Patients with active epilepsy exposed to an SSRI appear to be at increased risk of all-cause mortality, especially over timespans greater than 1 year, though the risk is lower than that for a matched population without epilepsy. The influence of SSRI use on possible-seizure related death appears negligible at best and not robust enough to offset the risk of all-cause mortality.
Conclusion A randomised controlled trial of SSRIs for the prevention of seizure-related death in patients with epilepsy appears impractical. Using increasingly large, linked electronic health record studies can therefore potentially offer valuable a solution in resolving the question of whether they prevent seizure-related deaths.
Abstract no. 191 Knowledge graph prediction of adverse drug reactions
Daniel Bean, Honghan Wu, and Richard Dobson, Department of Biostatistics and Health Informatics, Institute of Psychiatry Psychology and Neuroscience, King’s College London, London, UK
Olubanke Dzahini, South London and Maudsley NHS Trust, London, UK
Introduction Adverse drug reactions (ADRs) are a significant risk to patient health and are an important factor in deciding whether the potential benefits of a drug treatment outweigh the risks. Although clinical trials monitor ADRs, they are not able to detect all possible adverse effects due to limitations in sample size, duration and demographics. Therefore, spontaneous reports of previously unknown ADRs are important to the ongoing monitoring of drug safety in the post-marketing period. We have built a graph model of drug knowledge (protein targets and known side effects), developed a graph-based computational method to predict unknown ADRs and tested these predictions in electronic health records (EHRs).
Method Drug targets were retrieved from DrugBank, known side effects from SIDER and protein–protein interactions from IntAct. These databases were parsed into a graph database in Neo4j. Based on this graph, a model is built and optimised to correctly classify the known causes of each ADR. The known causes of each ADR are compared to all other drugs in the network to identify predictive neighbours. The score for a drug is the sum of its adjacency with these predictors, multiplied by weight for each predictor type (target or ADR). Drugs with a final score above a threshold are predicted to cause the ADR, i.e. each model is a binary classifier used to place edges in the network. These weights and the threshold are adjusted iteratively to optimise the performance of the model for each ADR. To validate the new predictions from the ADR models, an NLP pipeline was used to recover drug–ADR associations from the anonymised EHR data available through the Clinical Record Interactive Search in South London and Maudsley NHS Trust.
Results Predictive models were built for 311 ADRs. Based on leave-one-out cross validation, 78% of drug–ADR edges were correctly predicted by the best models. Ten different ADRs that can occur within weeks of beginning drug treatment were selected for validation, covering a range of severity and frequency, e.g. Stevens–Johnson Syndrome and hypersalivation. All ADR models were enriched for positive associations compared to chance, with 10/10 significantly enriched (hypergeometric test p < 0.05 at FDR <5%). The average enrichment for positive associations compared to chance was 1.82 ± 0.47.
Discussion The EHR validation is a strong indication that the new ADR predictions could be observed in clinical practice. There is potential to improve the predictions of each model further by including more known data on each drug, such as its indications or physical properties. Crucially, the prediction algorithm is generic and can be applied to other domains.
Conclusion This graph-based prediction method is able to accurately recover known drug–ADR associations and predict ADRs observed in practice that are not found in SIDER. This method could be used to predict possible ADRs for drugs that have not been observed in clinical trials before they occur in patients.
Abstract no. 196 The development and implementation of stroke risk prediction model in National Health Insurance’s personal health record
Kyunghee Cho, NHIC Ilsan Hospital, Koyang-shi, Goyang, South Korea
JaeWoo Lee, Department of Policy Research Affair, NHIMC, Koyang Shi, Goyang, South Korea
Objectives The purpose of this study was to build a 10-year stroke prediction model and categorize a probability of stroke using the Korean national health examination data. Then it intended to develop the algorithm to provide a personalized warning on the basis of each user’s level of stroke risk and a lifestyle correction message about the stroke risk factors.
Methods Subject to national health examinees in 2002–2003, the stroke prediction model identified when stroke (ICD-10 criteria) was first diagnosed by following up the cohort until 2013 and estimated a 10-year probability of stroke. It sorted the user’s individual probability of stroke into five categories: normal, mild, moderate, high and very high, according to the five rages of average probability of stroke in comparison to total population, less than 50%, 50%–70%, 70%–90%, 90%–99.9% and more than 99.9%, and constructed the personalized warning and lifestyle correction messages by each category.
Results Risk factors in the stroke risk model include the age, the square of the age, body mass index, cholesterol, blood pressure, blood glucose level, smoking status and intensity, physical activity, alcohol intake, past history (hypertension, coronary heart disease and stroke) and family history (stroke and coronary heart disease). The AUC values of the stroke risk prediction model from the external validation data set were 0.827 in men and 0.822 in women, which showed a high predictive power. The probability of stroke within 10 years for men in the normal group (less than 50%) was less than 3.92% and in the very high group (top 0.01%) was 66.2% and over. The women’s probability of stroke within 10 years was less than 3.77% in the normal group (less than 50%) and 55.24% and over in the very high group.
Conclusion This study developed the personalized warning and the lifestyle correction message about the stroke risk factors based on the nation health examination results and uploaded them to the personal health record service called My Health Bank in the health information website Health iN (http://hi.nhis.or.kr/main.do). By doing so, it urged medical users to strengthen the motivation of health management and induced changes in their health behaviours.
Abstract no. 198 Envisioning data science for health services research
Therese Stukel, Mahmoud Azimaee, Susan Bronskill, Astrid Guttmann, Michael Paterson, Michael Schull, and Rinku Sutradhar, Institute for Clinical Evaluative Sciences, Toronto, Canada
Peter Austin and J Charles Victor, University of Toronto, Toronto, Canada
Introduction Data science is a burgeoning field that offers the opportunity to extract knowledge and new insights from the explosion of health care data such as electronic medical and health records’ genomic, biomarker and imaging studies. Yet, which aspects of data science are most relevant to the field of health services and policy research remains unclear. The Institute for Clinical Evaluative Sciences (ICES) explored this question in order to develop priorities in data science for health services research at ICES.
Methods A committee of scientists and staff from our institute, led by a statistician/health services researcher, undertook a review of published and grey literature, and consulted external experts and key informants. We reviewed trends and innovations in health services research, including evolution in the kinds of data being used, novel methodologies and new approaches to distributed data analyses. The report and recommendations were presented to the institute’s international scientific advisory committee for their input and approval.
Results Approximately 62 reports and studies were reviewed and 12 external experts interviewed over 1 year. The report’s final recommendations were as follows: 1) expanding partnerships to pursue novel types of analyses rather than developing this capacity entirely in-house, such as with computer science for machine learning and text mining on unstructured data in EMR, and linking genetic or biomarker data to clinical and administrative phenotypic data for gene-association studies, 2) strengthening our data quality framework in areas such as de-identification and linkage, assessing the validity of study-specific data elements, and ensuring robust data quality tools, audit and oversight processes are fully integrated into studies, 3) creating, with computer science partners, a data safe haven infrastructure to allow external researchers to securely store and link their data to ICES data or that of other researchers, conduct advanced analytics with access to an existing high-performance computing environment, and provide efficient, privacy-preserving and secure data access, 4) focus on exploiting existing biomedical big data at ICES to extract meaning from large, messy structured and semi-structured data with deep clinical information (e.g. population level electronic laboratory results data) and unstructured (e.g. primary care EMR) and make them research ready, rather than focus on acquiring new novel biomedical big data, 5) identifying gaps and opportunities to train staff and scientists in modern data science methods and appropriate statistical software to implement them, such as machine learning and data visualization and 6) supporting expanded multi-jurisdiction research through the development of distributed data research networks and the necessary ‘build-once, use many times’ infrastructure such as common data models, harmonized algorithms and analytic protocols and associated methodologies.
Conclusion The rapidly increasing availability of health data combined with the expanding field of data science presents not only opportunities for health services researchers and institutes but also challenges to determine priorities for exploration and investment. Through a thoughtful and deliberate process, ICES identified six priority activities that will guide our institute’s approach to building data science at ICES and its integration into the more traditional health services research undertaken at ICES.
Abstract no. 200 From single cells to populations: modelling and analysing the dynamics of disease progression from cross-sectional studies using phenotypically-driven pseudotime ordering
Kieran Campbell and Christopher Yau, University of Oxford, Oxford, UK
Introduction Clinical trials are conducted over populations within a defined time period in order to illuminate certain characteristics of a health issue or disease process. These cross-sectional studies provide a ‘snapshot’ of disease heterogeneity across populations but do not provide an explicit means of examining the temporal nature of the disease. Longitudinal studies can be used to explore these properties but are expensive and time consuming to conduct. As a result, machine learning approaches have been developed to produce algorithms that can infer reliable time series models from large amounts of historical cross-sectional data.
Interestingly, in the field of single cell genomics, similar methodological ideas have also been developed. Recent advances in high-throughput genomic technologies have enabled experimentalists to capture thousands of cells and to interrogate each using molecular profiling. In temporally evolving biological systems, such as cellular differentiation processes, the data represents a cross-sectional profile of the cellular population. As a result, considerable advances have been made in extracting temporal information in order to better understand cellular heterogeneity and function over time using what are commonly referred to as ‘pseudotime ordering’ algorithms.
Method Recognising the potential synergies in both domains, we have developed a generalised pseudotime approach arising from our single cell genomics research, which we call ‘phenotime’ that can operate across a range of data modalities and applications. The algorithm uses a novel covariate-adjusted Gaussian process latent variable model (c-GPLVM) to order input objects obtained from a cross-sectional study in terms of latent pseudotemporal progression using phenotype covariates to constrain and guide the pseudotemporal assignments. The Bayesian inference for the model allows for full characterisation of statistical uncertainty. Briefly, the c-GPLVM performs nonlinear dimensionality reduction placing objects with similar high-dimensional data profiles close together in a latent one-dimensional pseudotemporal space. If there are certain phenotypic covariates of interest, these can be used to modulate the pseudotime assignment process allowing objects with distinct phenotypic traits to form alternate pseudotemporal trajectories.
Results To demonstrate the utility of ‘phenotime’, we applied the algorithm in an integrative analysis of high-dimensional molecular profiles (gene expression) and metastatic phenotypes of cancer patients from The Cancer Genome Atlas. This enabled us to perform a pseudotemporal adjusted expression quantitative trait loci analysis to identify gene expression behaviour that differed between patients with and without metastatic disease taking into account that patients may be at different stages of disease progression. Our analysis identified novel associations between progressive alterations in cancer-related lipid metabolic pathways and immunosuppressive processes driven by T-cell regulators with metastatic status that are not determined by conventional analyses, which do not account for latent disease progression.
Discussion Our studies suggest that accounting for latent disease progression in the analysis of cross-sectional disease profiling data can reveal novel insights into the disease dynamics and identify important signatures for patient stratification. The c-GPLVM is a robust and versatile statistical model for modelling disease and phenotypic progression and its implementation in ‘phenotime’ provides a general purpose tool for use by the scientific community.
Abstract no. 205 Designing the ASPREE Web Accessible Relational Database (AWARD) suite: turning clinical concepts into health data
Jessica E. Lockery, Taya A. Collyer, Suzanne G. Orchard, Robyn L. Woods, and John J. McNeil, Monash University, Department of Epidemiology and Preventive Medicine, Melbourne, Australia
Introduction In 2009, Monash University began a multi-year research and development project to create an integrated informatics platform to support the conduct of the Aspirin in Reducing Events in the Elderly (ASPREE) study, a multi-centre, randomised, double-blinded and placebo-controlled trial of daily 100-mg enteric-coated aspirin in ∼19,000 healthy community dwelling older adults in Australia and the US.1 The platform is called the ASPREE Web Accessible Relational Database (AWARD) suite.
Method Select ASPREE clinicians and researchers observed real-world workflows for in-person data collection, appointment scheduling, medical event collection and phone call follow-up conduct. Staff feedback was sought regarding user experience and barriers to accurate data collection and submission. Following consultation with clinical experts, suitable definitions were established to convert clinical concepts (e.g. ‘healthy elderly’ or hypertension) into structured, analysable data and meta-data fields. Real-world operational and clinical workflows were replicated electronically in the AWARD suite and heavily restricted for data quality control and protocol compliance.
Results The AWARD suite consists of four communicating modules: AWARD-GP, AWARD-Data, AWARD-Adjudicator and AWARD-Access Management. Users access each module through a web client application linked to a secure SQL database. Modules were produced through configuration of the following custom-built tools: Master Index, eForms, Booking, Activity Status, Communication Management, Collated Report, Data Annotation, Consent and Randomisation. Online and offline reporting was mediated through AWARD.
Throughout a 6-year period, AWARD has supported 760 users at 63 sites, more than 130,000 study visits, 180,000 phone calls, 110,000 electronic bookings and the cataloguing and storage of more than 100,000 pages of clinical documents. Following the closure of study enrolment, a baseline data set containing ∼6.5 million data values was prepared using AWARD-Data. More than 99.9% of baseline data values were entered within range or found to be accurate upon querying.
Discussion Innovation is required to overcome challenges obstructing data collection, access, analysis and discovery in the healthcare environment.2 Clinical trials provide an opportunity for advancement in healthcare data science because the requisite customization and tight definition control mimics requirements of the wider health system.3,4 The AWARD suite provides proof of principle for the efficient collection and storage of tightly controlled, structured health data. Transparent to conventional analytic tools, this form of health data allows for robust analysis of clinical concepts.
Conclusion The AWARD suite is a novel workflow methodology designed to produce structured, clinically applicable data sets for analysis. The AWARD approach offers workflow solutions for researchers, clinicians and health services.
References
ASPREE Investigator Group. Study design of ASPirin in Reducing Events in the Elderly (ASPREE): a randomized, controlled trial, Contemp Clin Trials 2013;36:555–64.
Mandl KD and Kohane IS. Escaping the EHR trap – the future of health IT The New England Journal of Medicine 2012;14366 (24):2240–2.
Oliveira AG and Salgado NC. Design aspects of a distributed clinical trials information system, Clin Trials 20063(4):385–96.
Angus DC. Fusing Randomized Trials With Big Data: The Key to Self-learning Health Care Systems? Journal of the American Medical Association 2015;25314(8):767–8.
Abstract no. 217 A realist evaluation from a Norwegian project
Mari S. Berge, Bergen University College, Bergen, Norway
Introduction People want to remain living in their own home even when they are getting old and frail. To remain at home, people need to feel safe and risk is a challenge to their desire. An increasing number of governments regard telecare to support older people to remain in their homes. However, various evaluations demonstrate disparate results from telecare, which are of little help for understanding what the users need from further policy and development. This evaluation from a Norwegian study differs as it provides a more nuanced approach to telecare evaluations.
Method Realist evaluation is used to scrutinize what it is about telecare, which works for whom, why, how and in which circumstances. Sequential interviews conducted with telecare users and relatives over a period of almost one year at pre- and post-implementation stages illuminate disparate experiences.
Results Some users experienced the intended effects from telecare, like increased feeling of safety, while others did not. Various contextual elements influenced how people reasoned about the resources provided by telecare and affected the individual outcomes.
Discussion The findings from the data are brought together with findings from the literature and discussed. Older people’s desire to remain in their own home appeared to be a major driving force in accepting telecare. The users had surprisingly high tolerance to side effects of telecare, which might indicate that much was at stake. Some users disapproved of having telecare due to contextual reasons; however, readjustments proved successful to some. Most of the older people participating in this evaluation experienced increased safety, as did the relatives. However, some users experienced the opposite result. Inadequate adjustment of telecare equipment to meet individual needs and requirements was a major reason.
Conclusion This study illuminates how and why telecare works differently in different situations and thus leads to different outcomes. When telecare is correctly adjusted to match the user’s needs, abilities and contexts it enables them to feel safe and remain in their own homes.
Abstract no. 223 Can hospital datasets be integrated to inform decision making for quality and safety?
Janet Anderson and Trevor Murrells, King’s College London, London, UK
Tom Kirby, Guy’s and St. Thomas’ NHS Foundation Trust, London, UK
Alastair Ross, University of Glasgow, Glasgow, UK
Introduction There is a large amount of data collected routinely by hospitals, but it is held in different locations, in different formats, on different timescales and by different stakeholders. There have been few attempts to integrate these data to inform the assessment and management of risk by taking proactive action to avoid or reduce the risk in situations known to be associated with adverse outcomes. Little is known about the basic determinants of organisational performance, such as the effects of increased patient numbers, or high patient acuity on outcomes such as adverse incidents, patient complaints and patient experience.
The CARE model of organisational performance in healthcare proposes that outcomes emerge from misalignments between demand and capacity and the adaptations that are required to successfully manage those misalignments. Adjustments to functioning occur often in healthcare in response to surges in demand, staffing shortfalls, equipment unavailability or novel problems that have not been encountered before. In this project, we are empirically testing the CARE model by integrating multiple hospital metrics and indicators and developing predictive models of performance. The aim is to test the feasibility of integrating hospital administrative data and to develop tools to assist organisational planning and decision-making.
Method The study site is a large University teaching hospital in London. Data were gathered from a wide range of sources across the hospital and include data on patient spells, length of stay, diagnoses, treatments, equipment availability, adverse incidents, patient complaints, patient experience, staff experience, trust bed availability, staffing levels, locum cover, staff sickness and escalations. These data presented challenges due to their differing formats and timescales and their interpretation and reliability. Exploratory workshops were held with key informants to assist in interpretation. Extensive work was required to clean and transform the data in preparation for analysis. A longitudinal time series database was built and analysed using appropriate statistical techniques.
Results Results show that outcomes cannot be fully predicted from patient numbers and/or patient acuity. Specific detailed results will be presented and discussed in terms of their implications for managing the quality and safety of care.
Discussion In this study we have shown that there is a way to harness the extensive datasets available in hospitals to provide detailed information about risks and their mitigation. The challenge will be to implement this in practice and provide practical, usable tools for managers and clinicians to use to ensure high-quality outcomes. The identification of high risk times and situations through rigorous analysis of organisational data is possible and can inform clinical planning and management and contribute to improving quality and safety.
Abstract no. 228 General Public Views on Various Uses and Users of Administrative Health Data in Ontario, Canada
P. Alison Paprica and Michael Schull, Institute for Clinical Evaluative Sciences, Toronto, Canada
Magda Nunes de Melo, University of Toronto, Toronto, Canada
Introduction High profile initiatives and reports highlight the potential benefits that could be realised by increasing linkage of, and access to, health data. The question is do members of the general public support the proposed uses of what can be considered “their” data? The objective of this study was to gain insight into the general public’s attitudes toward users and uses of linked administrative health data in Ontario, Canada.
Method From 2015 to 2017, a series of nine 2-h focus groups were held in Ontario, Canada, including sessions in downtown Toronto and Thunder Bay in northern Ontario. All sessions began with a brief overview of the process used by the Institute for Clinical Evaluative Sciences to remove or code identifying personal information prior to making linked health datasets available for research. Participants of focus groups were asked to discuss and respond to written information such as exemplar research studies, options for data access, and case studies designed to highlight potential benefits and risks from the general public’s perspective. The research team identified themes across the series of focus groups.
Results For some types of studies (e.g. a study of the safety of a prescription drug product), many members of the public assumed that research based on linked administrative data is happening more broadly than it actually is and had no expectation of being asked for their approval or consent. For other studies (e.g. use of public data to inform marketing efforts by a commercial organisation), focus group participants disagreed with use of public data and/or stated that consent should be obtained before public data were used. When presented with options for how analyses for the private sector might be performed, participants preferred models that had independent analysts performing the analyses versus providing private sector employees with access to data.
Discussion There was no blanket approval of research based on linked administrative health data. Public views depended on the purposes for which data would be used. Because of security and trust concerns, which extend beyond health data, participants preferred models that limit the number of individuals or organizations accessing data.
Conclusions Members of general public were generally supportive of research based on linked administrative health data for specific purposes, but there were limits to this support. Ensuring that research based on public administrative data is aligned with public values and preferences will require consultation and solicitation of feedback on different types of studies.
Abstract no. 229 Hospital admissions and ED presentations for dental conditions indicate access to hospital, not health inequality
Matthew Yap, Mei Ruu Kok, Alistair Vickery, and David Whyatt, University of Western Australia, Perth, Australia
Soniya Nanda-Paul, Department of Health Western Australia, Perth, Australia
Introduction Potentially preventable hospitalisations (including dental-related) are used as indicators of health inequalities and poor access to primary health care. Factors associated with such events are examined to determine if such indicators are valid.
Methods Dental-related admissions and emergency department (ED) presentations were examined within Western Australia (2002–2014) and persistently high age–sex standardised rates were mapped. Multivariate negative binomial models were used to measure the effects of age, gender, Aboriginal status, socio-economic status and nearest distance to ED upon both rates of hospital admissions and ED presentations for dental-related conditions.
Results Persistently high rates of dental-related admissions clustered within areas of metropolitan Perth that were socio-economically advantaged and near EDs. Adjusting for age, sex, socio-economics, Aboriginality and distance to ED, more dentists per capita correlated with more admissions (RR 1.07, 1.04–1.10) and fewer ED presentations (RR 0.93, 0.89–0.96). Persistently high rates of ED presentations clustered in socio-economically disadvantaged areas near metropolitan EDs. Aboriginality was associated with high rates of admissions (RR 2.41, 2.21–2.64) and ED presentations (RR 5.6, 5.3–5.92).
Discussion Dental-related admissions are positively associated with hospital access, socio-economic advantage and access to primary dental care, a pattern inconsistent with dental need. However, the converse may be true for Aboriginal populations. High rates of dental-related ED presentations are associated with poor access to primary dental services, but are influenced by access to EDs.
Conclusions Dental-related hospital admissions and ED presentations are not valid indicators of dental health inequality or access to primary dental care. Health service planners are encouraged to pursue more direct measures of primary care access and the oral health status of their communities.
Abstract no. 231 Forecasting areas with persistently high rates of potentially preventable hospitalisations: utilising high capacity parallelisation in an application of exhaustive model selection with repeated cross-validation
Matthew Tuson, Berwin Turlach, Mei Ruu Kok, Alistair Vickery, and David Whyatt, University of Western Australia, Perth, Australia
Introduction Potentially preventable hospitalisations (PPHs) have drawn increased international attention in recent years. Such hospitalisations are characterised by being potentially avoidable through the provision of appropriate non-hospital health services. It is of interest to health policy planners to be able to accurately predict areas that are expected to have persistently higher rates of PPHs than on average in future time periods. There is a scope for development of improved statistical methodology to make such predictions.
Method Using linked admissions data and census information for small geographic areas in Western Australia (WA), we developed validated prediction models to identify areas expected to have persistently high rates of PPHs throughout a three-year future time period. Potential predictors consisted of the age, sex and ethnicity distributions within each area socioeconomic indicators measures of accessibility to emergency department and general practice past trends of persistently high rates of PPHs and rurality. We developed state-wide and metropolitan area prediction models for four exemplar PPHs, namely high-risk foot COPD heart failure and Type II diabetes mellitus.
Our methods used a combination of standard logistic regression, repeated fivefold cross-validation and exhaustive model selection. Approximately, 4,500 candidate models were repeatedly cross-validated 500 times in order to identify stable optimal model structures for prediction. This process required efficient utilisation of high capacity parallel processing.
Results Up to 200 cross-validation repeats were required to stabilise the model selection process. The optimal prediction models achieved mean validation positive predicted value (PPV) of between 65% and 95% while maintaining sensitivity of at least 50%. These models identified a number of both rural and metropolitan priority areas across WA.
Discussion Health interventions require sufficient time to develop and implement. Therefore, long range forecasting of areas expected to have persistently high rates of PPHs allows for appropriate interventions to be potentially implemented within a realistic time frame. We have described the application of complex statistical techniques to make such predictions; these methods utilise high capacity parallel processing to optimise the validation sensitivity and PPV among candidate models. Consideration of PPV, together with associated intervention costs and potential savings, allows for the estimation of return on investment associated with intervention. Our models have identified some areas in WA that were predicted to have persistently high admission rates for multiple different PPHs these areas represent high priority areas for non-hospital interventions aimed at reducing health inequality.
Conclusion To our knowledge, this study is the first to focus on developing validated prediction models to identify geographic areas expected to have persistently high rates of PPHs in long-term future time periods. Our models performed well when applied to multiple exemplar PPHs. We suggest that these methods can assist in the development of appropriate non-hospital interventions targeting PPH-related health inequality.
Abstract no. 234 Predictive validity of measured obesity versus obesity ascertained from administrative health data for osteoporotic fractures
Lisa Lix, Shuman Yang, Lin Yan, Aynslie Hinds, and William Leslie, University of Manitoba, Winnipeg, Canada
Introduction Obesity is a risk factor for many chronic health conditions, but is reportedly protective for osteoporosis and most osteoporosis-related fractures. While administrative health data have been used extensively for predicting risk of chronic conditions within populations, most predictive models lack information about obesity because it is infrequently coded in administrative data. Our purpose was to compare the validity of obesity defined from administrative data with measured obesity from clinical registry data for predicting osteoporosis-related fracture risk.
Methods We identified 36,372 individuals (50+ years) in a clinical registry database for bone mineral density (BMD) from the province of Manitoba, Canada, with body mass index (BMI) measured between 2001 and 2015. Measured obesity (MOB) was defined as BMI ≥ 30 kg/m2. Linked administrative data were used to ascertain obesity and fracture diagnoses. Obesity was defined from administrative data as (a) at least one hospital or physician International Classification of Diseases (ICD) code within three years prior to the BMD test date (DOB1) or (b) at least one hospital or physician ICD code, laparoscopic surgery procedure code or appetite-supressing prescription medication within three years prior to the BMD test date (DOB2). Cox proportional hazards models were used to estimate hazard ratios (HRs) and 95% confidence intervals (CIs) for incident osteoporosis-related fractures (hip, forearm, clinical spine and humerus fracture) associated with MOB, DOB1, and DOB2 before and after adjusting for confounding covariates (e.g. age, sex, income quintile, prior fractures and comorbid conditions). Measures of discriminative performance (i.e. c-statistics) were compared for models with and without obesity variables.
Results The study cohort had an average age of 65.6 years and 87.4% were female. The prevalence of obesity was 31.3% for MOB, 4.5% for DOB1 and 5.1% for DOB2. During an average of 6.1 years of follow-up, we identified 2602 incident fractures (6.1% versus 7.6%, 4.0% versus 7.3% and 4.2% versus 7.3% for those with and without MOB, DOB1, and DOB2 p-values for differences < 0.01). MOB (adjusted HR: 0.82, 95% CI: 0.75–0.90), DOB1 (adjusted HR 0.78, 95% CI: 0.61-0.99) and DOB2 (adjusted HR: 0.78, 95% CI: 0.63-0.98) were all significantly associated with decreased fracture risk. The c-statistics for unadjusted models containing DOB1 (0.511, 95% CI: 0.507–0.514) and DOB2 (0.511, 95% CI: 0.508–0.515) were significantly lower than for MOB (0.525, 95% CI: 0.516–0.534 p-values for differences < 0.01). However, after adjusting for covariates, all models resulted in small but statistically significant improvements in the c-statistic (% change for MOB: 0.37 [95% CI: 0.07–0.68] for DOB1: 0.31 [95% CI: 0.07–0.55] and for DOB2: 0.28 [95% CI: 0.05–0.52]).
Discussion Obesity ascertained from administrative health data can be used as a proxy for measured obesity in fracture risk prediction models. Further research is warranted to test whether obesity defined from administrative data can be used to predict risk for other chronic conditions.
Conclusions Consistent with measured obesity, obesity ascertained from administrative data was associated with reduced osteoporosis-related fracture risk. However, obesity ascertained from administrative data was slightly poorer than measured obesity for discriminating between individuals with and without osteoporosis-related fractures.
Abstract no. 252 Development of a data quality taxonomy: case study with an anaesthesia database
Antoine Lamer, Centre Hospitalier Régional Universitaire de Lille, Lille, France
Samuel Degoul, University Lille Nord de France, Lille Cedex, France
Renaud Périchon and Julien Soula, Université de Lille, Lille, France
Romaric Marcilly, INSERM CIC-IT Lille, Lille, France
Introduction In healthcare structures, operational applications routinely record huge volumes of data and allow users to exploit them in the primary objective for which they were developed (i.e. medico-legal aspect and administrative purpose). As these operational applications have now been implemented for several years, they may provide significant volumes of data of interest for research for example. Initiatives have been undertaken to reuse these data, it faces various difficulties, e.g. operational databases contain errors due to input error or poor documentation from users and monitoring artefacts from monitors. Moreover, the way data are stored is not optimized to make the reuse of data easier. In order to improve the data quality, it is necessary to identify precisely the difficulties faced and provide adapted recommendations to fix them. The first step is to define an illustrated taxonomy of data quality problems. This presentation deals with the design of this taxonomy and its usefulness to assess the overall quality of data recorded within an anaesthesia database.
Method An exhaustive list of data quality problems was identified from existing published works in scientific literature or based on our experience in designing data warehouses. These items were then ordered in a taxonomy so that it was as operational as possible for easily identifying data quality issues. Finally, this taxonomy was used to assess the quality of data recorded between 2010 and 2016 in the Anaesthesia Information Management System implemented in Lille University Hospital.
Results We identified 100 items of data quality problems from eight papers. After selection of relevant items and deduplication, we added new types of issues not yet reported that we met during our previous experiences (n = 6), leading a total of 50 different data quality problems. Those items were classified in the taxonomy according to the levels of granularity of the databases they are related to single field of a single record, single field of multiple records, multiple records, etc. Based on this taxonomy, the quality of data recorded for 388 026 interventions was assessed. The main problems were ‘imprecise values’ (e.g. values outside normal ranges) and ‘missing data’ (data not documented or not linked between systems). We noticed that the quality of data evolved over the years, e.g. ‘missing data’ about patient’s weight concerned 25.8% of the interventions in 2010 and 1.0% in 2015. Data quality was also perceived as department-dependant.
Discussion Through an exhaustive and intelligible taxonomy, our work provides an operational tool to identify and describe data quality issues in a healthcare database. Its impact on improvement of data quality with the aim of data reuse has to be assessed in further works.
Abstract no. 254 Data linkage in social care: a pilot project
Alison Orrell and Catherine Robinson, Bangor University, Bangor, UK
Martin Heaven, Farr Institute, Swansea University, Swansea, UK
David Roberts and Mark Parry, Gwynedd Local Authority, Caernarfon, UK
Introduction Existing data linkage projects in Wales have primarily focused on health datasets. To build the complete picture of care service provision, there is a need to broaden the linked data available to included health, social service provision by local authorities and provision of support by third sector organisations. The aims of this pilot project are to (i) test the feasibility of linking datasets from a local authority, the NHS and third sector organisations, (ii) build a more complete picture of service provision using adults who have been referred to social services in order to avoid admission to hospital or to facilitate their discharge from hospital and (iii) assess the range and quality of data available in each of the organisations providing services to those individuals.
Method Bangor University led a research team partnered with Gwynedd Local Authority to explore the governance issues and practicalities of providing an anonymised dataset to the SAIL databank (Swansea University). Two third sector agencies were also approached. With the various required service level agreements in place, data were put through the SAIL process for analysis.
Results Details of 20,373 referrals generated by 12,228 social services clients and 21,220 service delivery records provided to 6,278 clients of Gwynedd Local Authority from the period 2008 to 2015 were transferred into the SAIL databank. The personal data relating to people known to Social Services were anonymised through the NHS Information Service from a table of 24,431 Gwynedd records. Removing duplication, 17,431 (96%) individuals were linked and 744 (4%) remain unmatched. Examination of the referral and service records related to the unmatched clients revealed no pattern or bias in the data related to these individuals. Of the 12,802 clients having a referral, service or both, we were able to link 84% to GP recorded events 94% to hospital day case or in-patient spell 71% to accident and emergency attendance and 95% to outpatient activity. A cohort of 162,831 Gwynedd county residents has been constructed from the SAIL core datasets, of which Social Services clients with referrals and/or service records form an 8% sample. Matched controls are being constructed to make health and service utilisation comparisons between clients and non-clients. We will present results from these comparisons.
Discussion This has been a slow-moving project due to its pathfinder nature, getting the right permissions in place, agreements created and signed off, staff available to prepare data and technical problems with the downloads. Attempts to bring in and link third sector data are still underway. Now that the data are linked, many of the steps developed will allow a more rapid progression for similar linkage in the future.
Conclusion It is feasible to link a large amount of health data in the SAIL databank with social services data from local authorities for research. The data provided by social services are in the form of coded and structured labels with a high level of consistency. The high matching success rate (96%) suggests that the data are of excellent quality.
Abstract no. 256 Non-attendance at outpatient appointments is associated with increased A&E and emergency inpatient admissions for children and young people with neurology diagnoses
Stuart Jarvis and Lorna Fraser, Department of Health Sciences, University of York, York, UK
John Livingston, Department of Paediatric Neurology, Leeds General Infirmary, Leeds, UK
Introduction Neurological conditions are a major cause of mortality and morbidity among children and young people (CYP), accounting for around 10% of their hospital admissions. Some conditions, for example epilepsy, can be managed through scheduled outpatient appointments. This study aimed to quantify any association between non-attendance at outpatient appointments and incidence of accident and emergency (A&E) attendance and emergency inpatient admission.
Method A cohort of CYP with neurology conditions was identified using an ICD-10 coding framework applied to inpatient admissions in England from 1 April 2003 to 30 March 2015. CYP were included in the cohort in financial years in which they had at least one inpatient admission at least one framework diagnostic code recorded in any diagnostic field. The inpatient data were linked with A&E and outpatient data. Analysis of A&E attendance was restricted to 1 April 2007 to 30 March 2015 as A&E data were only available for this period. In each year, individuals were categorised as either attending all available appointments or missing one or more appointments (appointments missed during inpatient stays were excluded). This was used as a predictor in multilevel (reflecting dependence across years for single individuals) negative binomial regression models, one with the count of A&E attendance in the year as the dependent variable and one with the count of emergency inpatient admissions in the year as the dependent variable. Other predictors were ethnic group, age group, deprivation category, Government Office Region of residence and primary diagnostic group. Time at risk was included in the models.
Results There were 524,958 individuals in the cohort overall (420,062 in the years for which A&E data were available) with a mean of 1.3 A&E attendances and 1.2 emergency inpatient admissions per person per year. Individuals who had missed one or more outpatient appointments had significantly more A&E attendances (incidence rate ratio (IRR) 1.205, 95% CI 1.197–1.214) and emergency inpatient admissions (IRR 1.187, 95% CI 1.179–1.195) than individuals who attended all appointments. When only missed neurology-related outpatient appointments and emergency inpatient admissions with a primary neurology diagnosis were considered a smaller association was observed: IRR 1.037, 95% CI 1.015–1.059. Ethnic group, age group, deprivation category, Government Office Region and primary diagnostic group were also significant predictors of A&E attendance and emergency inpatient admission.
Discussion The association between missed outpatient appointments and increased A&E attendances and emergency inpatient admissions may be indicative of missed outpatient appointments increasing the need for subsequent unplanned care, impairing management of conditions and preventing early response to deterioration through planned treatment. The lower IRR for emergency inpatient admissions with primary neurology diagnoses related to missed neurology outpatient appointments may be due to diagnostic coding issues. There are confounding factors, for example, individuals with more severe illness may miss more outpatient appointments and also have more A&E attendances and emergency inpatient admissions due to illness.
Conclusion Non-attendance at outpatient appointments is associated with higher incidence of A&E attendance and emergency inpatient admission.
Abstract no. 259 BrainLab - Towards mobile brain research
Ina B. Fink, Bernd Hankammer, Thomas Stopinski, Roann Ramos, Ekaterina Kutafina, and Jó Á. Stephan M. Jonas, Department of Medical Informatics, Uniklinik RWTH Aachen, Aachen, Germany
Bitsch Link, COMSYS, RWTH Aachen University, Aachen, Germany
Introduction Electroencephalography (EEG) is a non-invasive method for measuring electrical activity in the brain and crucial for the detection and evaluation of neurological and psychological disorders. However, it traditionally requires complex hardware and computing set-ups restricting its application to clinical environments. Therefore, classical EEG systems provide low accessibility that is particularly disadvantageous for health care in regions with limited infrastructure. Furthermore, traditional EEG restricts subjects in terms of their movement limiting research.
We present BrainLab, a mobile system for brain research consisting of a mobile Android application combined with a wireless commercial consumer EEG device. Since the chosen EEG device is primarily a headset, it is placed easily while data acquisition is enabled via Radio/Bluetooth. At the same time, visual and auditory experiments can be conducted on the mobile device, measuring the brain reaction to predefined events. Implementation of experiments is possible without previous programming knowledge using a simple structured text file. The recorded data containing brain reactions and occurrences of the stimuli can be exported using the common EDF format or, in the future, be analyzed directly on the mobile device without an Internet connection. For this purpose, we embedded a visual programming interface into BrainLab, allowing loading and plotting of records as well as basic processing. Further functions are in development. To evaluate BrainLab, several experiments regarding usability and functionality were conducted until now, including the replication of a scientific EEG experiment.
Results In the course of the evaluation, an expert confirmed brain activity recorded with BrainLab appeared valid, while known brain reaction to specific stimuli was detectable in the data. Furthermore, the average cross correlation between the signals at the electrodes and the recorded signals was calculated to be 0.9875. This shows that no significant distortion is induced through the recording process.
Usability of BrainLab was evaluated in a pilot study using the questionnaire ISONORM 9241/10. Here, we achieved good mean scores in the fields ‘suitability for the task’ (2.3 points on a −3 to 3 scale), ‘conformity with expectations’ (2 points) and ‘suitability for learning’ (1.8 points). However, improvements are possible regarding ‘suitability for individualization’ (0.8 points), ‘error tolerance’ (0.4 points), ‘controllability’ (0.5 points) and ‘self-descriptiveness’ (0.4 points).
The evaluation results show that our system already allows for fully mobile and feasible EEG based experiments in an arbitrary environment while being well suited for use by inexperienced users.
Conclusions BrainLab is a promising starting point for mobile brain research. It allows for the creation and conduction of custom experiments while recording brain reactions to specific stimuli. Enabling analysis and interpretation of the resulting data on the mobile device without additional infrastructure is currently in progress. Even though measurement quality is limited in comparison to clinical EEG systems, our research indicates a feasibility for mobile screening for neurological disorders, which could increase accessibility to neurological examination for immobile patients or resource-austere areas. Furthermore, it could enable situational neurofeedback training in rehabilitation and novel, unrestricted EEG experiments. Thus, BrainLab holds the potential to improve research and health care.
Abstract no. 262 Multidimensional characterization of mobile apps for hearing health care by using the ALFA4Hearing (At-a-glance Labelling for Features of Apps for Hearing health care) model combined with data visualization methods
Alessia Paglialonga and Gabriella Tognola, Consiglio Nazionale delle Ricerche, Istituto di Elettronica e di Ingegneria dell’Informazione e delle Telecomunicazioni, Milan, Italy
Riccardo Barbieri, Federico Malgara, Riccardo Rosati, and Francesco Pinciroli, Politecnico di Milano, Dipartimento di Elettronica, Informazione e Bioingegneria, Milan, Italy
Introduction Hearing loss is one of the most prominent health burdens, with over 360 million sufferers worldwide. Medical apps can become key drivers for pervasive, effective hearing health care (HHC) for very large populations with hearing problems; however, there is still a lack of methods for informed adoption of apps. The use of specific models for app assessment is crucial to identify the relevant attributes and to highlight the emerging needs in the HHC field. Moreover, due to the usually large set of features needed to characterize apps, it is important to devise informative methods for data analysis so to extract focused and relevant information in a given study sample.
Method We here develop a novel approach for the characterization of mobile apps for HHC that combines the ALFA4Hearing model (At-a-glance Labelling for Features of Apps for Hearing health care) with data visualization techniques. The ALFA4 Hearing model is a recently developed method for apps for HHC that characterizes apps against a core set of 29 features grouped into five components (promoters, services, implementation, users and descriptive information). The model is used here to provide descriptive pictures of a sample of 137 apps (iOS and Android) covering the whole spectrum of HHC services. Data visualization techniques were used here to analyze the relationships between the model components and features in our sample of apps as well as in specific subsets. We analyzed data by using several data visualization techniques, with different weighted graphs algorithms and network layouts, with a varying number of layers and nodes.
Results We found that among the several data visualization approaches here tested, three methods showed greater potential: (i) a two-dimensional cluster graph was helpful to describe the relevance of the different components in the model and the distribution of features within each component, (ii) a three-dimensional, three-layer layout was found to be explanatory about the relationships between the apps (layer 1), the features (layer 2) and the model components (layer 3), and made it easy to extract information about specific apps, apps subsets, or features clusters, and (iii) a two-dimensional network was able to highlight effectively the relationships among features within- and between- domains in any given app sample to explain the differences in feature patterns among samples of apps (e.g. different target groups, different services).
Discussion and Conclusions In this study, we were able to identify three graph layouts in order to effectively highlight the relationships among the app features. The relevance of these features and the role of the different model components in any sample of apps were described by a clear representation. Our combined approach provides a promising tool able to represent a large amount of information from multiple perspectives to study the current trends in the field. Moreover, this approach could be of great value to identify emerging research questions and potential opportunities for developers, stakeholders, or clinicians and drive their directions for research, professional training, clinical use of apps, as well as technical developments.
Abstract no. 263 Investigating educational attainment at age 16 years in adolescents who are looked after or in need using record linkage and a birth cohort study
Alison Teyhan, Andy Boyd, and John Macleod, University of Bristol, Bristol, UK
Introduction In the UK, ‘children in need’ (CIN) have social services involvement, and ‘children looked after’ (CLA) are in the care of their local authority. Through record linkage, we identified adolescents who were CIN or CLA in a population-based birth cohort study and examined their educational attainment at age 16 years.
Methods The Avon Longitudinal Study of Parents and Children (ALSPAC) has been linked to the National Pupil Database (NPD), a repository of educational data for pupils in England. The NPD has been linked to the Department for Education’s CLA data return (since 2006) and CIN census data (since 2009). ALSPAC participants (n ∼12,000) were coded as being CLA during school years 10 and 11 (aged approximately 14–16 years) if they had a CLA record while in Year 10 or Year 11 and as being CIN if they had a CIN record in 2009 that stated they had been registered as in need before the age of 16 years. A 3-category exposure variable was derived: ‘not CIN/CLA’, ‘CIN (not CLA)’, and ‘CLA’. GCSE exams are taken at the end of Year 11. Two measures of attainment were examined: capped GCSE percentage score (summed score of eight best subjects, converted into a percentage of maximum possible score) and attainment of five GCSEs at grades A*–C including English and Maths. Covariates included maternal characteristics (e.g. age and mental health), and measures of socio-economic position reported by the mother during pregnancy (e.g. maternal education and financial difficulties) and from the NPD (free school meals and area-based deprivation).
Results 81 adolescents were identified as being CIN (0.67%) and 81 CLA (0.67%). The main reasons for being a CIN were child disability (36%) and abuse/neglect (25%). Most CLA were living with a foster family (72%) and the main reasons for being a CLA were abuse/neglect (36%) or acute family stress (23%). Compared to their peers, CIN and CLA individuals were more likely to have a young mother and to be from a disadvantaged family. GCSE results data were available for all of the CLA, and 53 of the CIN. Their attainment was low relative to peers: for CIN, the mean GCSE percentage score was 28.0 and 7.6% passed 5+ GCSEs including English and Maths. For CLA, the results were 31.2 and 6.2%, respectively, and for ‘not CIN/CLA’, 68.7 and 51.8%. After adjustment for a range of maternal and socio-economic position covariates, relative to ‘not CIN/CLA’, CIN had mean GCSE percentage score 34.3 points lower (95% CI, −40.4 to −28.2) and CLA 30.3 lower (−35.4 to −25.2), and they remained substantially less likely to achieve 5+ GCSEs including English and Maths: CIN, OR 0.17 (0.05 to 0.52) CLA, OR 0.08 (0.02 to 0.26).
Discussion and Conclusions Although CLA and CIN statuses were strongly socially patterned, the low educational attainment of these individuals relative to their peers was not explained by the maternal and socio-economic position factors considered. Future work will also examine the influence of school-level factors on the academic achievement of adolescents who are CIN or CLA.
Abstract no. 269 Methods for analysing large routine clinical datasets, with applications to electronic health records from the clinical practice research datalink
Kirsty Rhodes and Rebecca Turner, MRC Biostatistics Unit, Cambridge, UK
Rupert Payne, University of Bristol, Bristol, UK
Ian White, MRC Clinical Trials Unit at UCL, London, UK
Introduction Routinely collected datasets including electronic health records are increasing widely used in healthcare research. Among other advantages, they allow research to be done on a much wider scale, using hundreds of thousands of patient records to answer questions about what is happening in the ‘real world’. Although routine datasets provide exciting opportunities for research, their size and variability can make them difficult to analyse and might discourage some researchers. Here we present statistical methods that facilitate the analysis of large routine datasets. We focus on the aim of investigating the association between patient characteristics and an outcome of interest, while allowing for between-practice variation.
Methods We fit mixed effects regression models to outcome data, including predictors of interest and confounding factors as covariates. To allow for variation in outcome among general practices, we include random intercepts. We implement the analysis using weighted regression or meta-analysis of estimated regression coefficients from each practice. These methods are likely to be familiar to applied healthcare researchers, though not for the purpose of analysing large datasets. Both methods reduce the size of the dataset, thus decreasing the amount of time required for statistical analysis. We compare the methods to an existing subsampling approach.
Results All methods yield similar effect estimates. Weighted regression and meta-analysis give similar precision to analysis of the entire dataset, but subsampling is substantially less precise. We compare the methods through application to two contrasting primary care datasets from the Clinical Practice Research Datalink (CPRD). For example, in a dataset comprising 2,116,948 observations recorded by 674 general practices between 1996 and 2014, we investigate the impact of financial incentives in UK primary care on the recording of elevated cholesterol in patients with severe mental illness. In conventional mixed effects logistic regression of the entire dataset, the estimated immediate effect of an incentive introduced in 2011 has odds ratio 1.80 (95% CI: 1.70 to 1.92), showing increased recording of cholesterol. Weighted regression reduces the size of the dataset by 98.5% and gives identical results. Meta-analysis and analysis of representative 10% of the dataset give similar estimates of 1.67 (95% CI: 1.54 to 1.80) and 1.63 (95% CI: 1.32 to 2.01), respectively.
Discussion Fitting mixed effects regression models that allow for multiple sources of variation have become relatively straightforward in standard statistical software. However, it is time consuming and not very practical to fit such models to data comprising hundreds of thousands of observations nested within hundreds of general practices. An existing subsampling approach allows us to extract the data required to answer the research question and has performed well in example applications, but it may be preferable to make use of all the data. Where all data are discrete, weighted regression is equivalent to fitting the model to the entire dataset. In the presence of a continuous covariate, meta-analysis is useful.
Conclusion We have identified scalable statistical methods for analysing large routine clinical datasets. These methods would be accessible to applied researchers and are easily implemented using standard statistical software.
Abstract no. 272 Profiling primary care patients on sub-domains of frailty using the clinical practice research datalink
Stephen Pye, Harm Van Marwijk, and Andrew Clegg, NIHR School for Primary Care Research, Division of Population Health, Health Services Research and Primary Care, The University of Manchester, Manchester Academic Health Science Centre, Manchester, UK
Evangelos Kontopantelis, Centre for Biostatistics, Division of Population Health, Health Services Research and Primary Care, The University of Manchester, Manchester Academic Health Science Centre, Manchester, UK
Darren Ashcroft, Farr Institute for Health Informatics Research, Division of Informatics, Imaging and Data Sciences, The University of Manchester, Manchester Academic Health Science Centre, Manchester, UK
David Reeves, Division of Pharmacy and Optometry, The University of Manchester, Manchester Academic Health Science Centre, Manchester, UK
Introduction Given an ageing population, the importance of patient frailty in clinical decision making is increasingly recognised for both treatment and care. The electronic Frailty Index (eFI) is a tool developed at the University of Leeds and implemented in GP systems that is based on a cumulative deficit model of frailty, consisting of 36 ‘deficits’ constructed using around 1,500 clinical codes from a patient’s primary care record. There is much debate on whether frailty is unidimensional or multidimensional. Unidimensional models, like the eFI, generate a single frailty score. Multidimensional models produce scores on frailty sub-domains, such as physical, cognitive and psychosocial. The aims of this study are to identify the multidimensional models of frailty that best fit actual patient data on health deficits and then use these models to generate frailty profiles for individual patients and explore subdomains. The work uses two large UK primary care databases of electronic health records, the Clinical Practice Research Datalink (CPRD) and ResearchOne, and is funded by the School for Primary Care Research.
Methods The main theoretical multidimensional models of frailty and their associated sub-domains will be identified from the literature. The deficits from the eFI will then be mapped to each sub-domain, independently by a group of GPs and a group of lay PPI contributors, disagreements being resolved through discussion. Each theoretical model will be assessed for goodness-of-fit to the deficit data using confirmatory factor analysis using samples of CPRD patients aged >=60 from 2006 and 2015 interpretation of the models will be determined by consensus among the research team and any modifications made will take into account the theoretical basis. Exploratory factor analysis will also be conducted to find the best fitting purely empirical model of deficit groupings. An expert clinician panel will make a final choice of one or more well-fitting multidimensional models. Different models may be suited to different purposes, e.g. a many-dimensional model to aid clinical decision making, and a broader model with fewer dimensions for epidemiological work. External validity will be assessed by applying the model(s) to equivalent samples of patients from the ResearchOne database. Predictive validity in relation to mortality will be assessed and compared in performance to the original eFI. Multidimensional frailty score profiles for individual patients will be generated and patients clustered according to their profiles to identify homogenous subgroups.
Results/Discussion This work has just begun and we are currently mapping deficits to theoretical models of frailty. The work will be completed in time for presentation at the conference.
Conclusion Frailty profiling could aid clinical decision making in primary care, including identifying individuals who would benefit from longer appointments, supported self-management, care and support planning, or a comprehensive geriatric assessment. Knowledge on numbers and types of frail patients at national, local and GP levels can help predict future health-care needs. It could also inform the design of trials of healthcare interventions using frailty measures to stratify patients to better target frail person care.
Abstract no. 274 Identifying anonymous residence types using administrative datasets
Karen Tingay, Administrative Data Research Centre - Wales, Swansea University, Swansea, UK
Matt Roberts and Charles Musselwhite, Centre for Aging and Dementia Research, Swansea University, Swansea, UK
Introduction The effect of the wider social environment on physical and emotional health is a longstanding area of study. The impact of the individual’s social residence type, such as living alone, or living in a care setting, adds a layer of complexity to health and social research and policy. For example, infection transmission in student accommodation could lead to improved sanitation measures. Mental and physical health outcomes of chronic disease patients living alone compared with living in a community care setting could highlight the need to additional social care support. Surveys, including the UK Census, are collecting this data. However, these surveys are expensive, time consuming and usually cover a subsection of the population. Large-scale, linked databanks, such as the Secure Anonymous Information Linkage (SAIL) Databank at Swansea University, holding administrative datasets, including health data, are broader in scope, both in terms of the nature of the data held and the population. Despite known data quality issues, a method for anonymously modelling household types on the population as a whole, using routinely collected administrative data, would be beneficial to linked data research.
SAIL contains anonymous linked data on over 3 million Welsh residents. Address data is not stored, but postcodes are anonymised by a Trusted Third Party to create the residential anonymised linkage field (RALF). RALFs can be mapped to local super output area (LSOA) codes for geographical analysis. Using anonymised demographic and addressed data, individuals can be grouped into likely households. This study aims to classify these households into types for use for further research.
Method Residences containing more than 10 individuals were extracted from administrative datasets. Age ranges and moving dates for each residence were calculated from the minimum and maximum age at which the residence members moved into that residence. K-means clustering of the residence demographics was performed. These clusters were validated against existing data from sub-populations.
Results 8259 residences containing more than 10 individuals were clustered into five distinct types of household:
One group of elderly people (mean range = 63–94 years), suggesting care homes.
Two groups contained young adults (mean ranges = 17–25 years, and 16–37 years), but one group contained much larger households. This group tended to move into the residence in September and suggests student halls of residence.
Two further groups contained varying ages (mean range = 5–48 years, and 7–74 years) and no obvious pattern of moving. These groups suggest blocks of flats.
Discussion Classification of residence type (e.g. student accommodation, flats, elderly communities) is possible using administrative data. However, household units exist within these residence types and previous work has found that it is difficult to extract individual households from, for example, blocks of flats.
Conclusion This project has created residence type classifiers using administrative data. This gives more complexity and detail to potential research projects. Further work to identify households and household types (e.g. single parent families) within the residence types is needed.
Abstract no. 276 Adversity and risk of poor birth and infant outcomes for young mothers: a population-based data linkage cohort study
Katie Harron, David Cromwell, and Jan van der Meulen, London School of Hygiene and Tropical Medicine, London, UK
Ruth Gilbert, University College London, London, UK
Sam Oddie, Bradford Royal Infirmary, Bradford, UK
Introduction Maternal health behaviours and psychosocial factors are associated with poor birth outcomes and increased hospitalisations throughout childhood. We examined birth and infant outcomes according to maternal age and adversity indicators using population-level healthcare data.
Methods We extracted linked maternity baby hospital data from Hospital Episode Statistics for births between 2009 and 2012 in England. Indicators of maternal adversity were identified using ICD10 diagnosis codes for drug/alcohol abuse, violence or self-harm from any hospital admission up to two years before delivery. Mothers were categorised as current young (<21 years at current birth), prior young (<21 at first birth but not current birth) or never young (>=21 at first birth). Multivariable regression (adjusting for additional maternal/baby risk factors including deprivation) was used to determine the association between maternal exposures and preterm birth (<37 weeks gestation), low birthweight (<2500g), and unplanned readmissions and deaths within 12 months post-discharge from the birth episode.
Results Of 1,636,019 mothers, 8.5% (n = 138,875) were current young and 8.8% (n = 144,168) were prior young mothers. Adversity indicators in the two years prior to delivery were identified for 6.6% (n = 108,131) of mothers, rising to 15.5% (n = 21,487) for current and 14.7% (n = 21,237) for prior young mothers. Adversity was the most important risk factor for immediate birth outcomes: odds ratios 1.53, 95% CI 1.46–1.60, p < 0.0001 (preterm) and 1.97, 1.89–2.06, p < 0.0001 (low birthweight). In contrast, maternal age was most important for infant outcomes: OR for readmission 1.53, 1.47–1.58, p<0.0001 (current young) and 1.40, 1.35–1.44, p < 0.0001 (prior young) compared with never young mothers. Risk of infant mortality was increased for current compared with never young mothers (OR 1.37, 1.18–1.60, p < 0.0001) and for mothers with adversity (OR 1.22, 1.05–1.42, p = 0.021).
Discussion and Conclusion Although intertwined, young maternal age and adversity influence infant outcomes in different ways. Indicators of adversity in the two years prior to birth are important exposures for immediate birth outcomes, while young maternal age at first birth (irrespective of current age) is an important risk factor for poor outcomes during infancy. A major strength of this study is the use of a national linked dataset, although under-ascertainment of adversity in HES may lead to risk being underestimated.
Abstract no. 285 My diabetes my way: user experiences of an electronic personal health record for diabetes
Scott Cunningham, Brian Allardice, and Deborah Wake, University of Dundee, Dundee, UK
Introduction My Diabetes My Way (MDMW) is the NHS Scotland interactive website for people with diabetes and their carers. It contains multimedia resources aimed at improving self-management, including traditional information leaflets, interactive educational tools and videos. MDMW also offers users access to their clinical data via its novel electronic personal health record (ePHR). The ePHR sources data from primary care, secondary care, specialist screening services and laboratory systems including diagnostic information, demographics, process outcomes, screening results, medication and correspondence. These data provide a more complete overview of diabetes than is available from any single data source. Patients can use MDMW to share information with their healthcare teams, through automatic data upload, secure messaging and online discussion forums, further enhancing communication. They can also set and record their own realistic goals and receive highly tailored advice and guidance based on the current status of their results. We aimed to evaluate and analyse user experience of the records access service.
Method In January 2015, an online evaluation survey was emailed to 3,979 active users of the MDMW ePHR to assess their experiences and perceived benefits. Survey Monkey was used to capture the results for each unique respondent, using a series of open and closed questions. The responses details the impact the system had on patient satisfaction and how it enhanced their ability to self-manage.
Results 1,095 (27.5%) active users completed the survey. Patients report that MDMW improves their knowledge of diabetes (90.3%) and their motivation to manage it better (89.3%). They believe it allows them to make better use of consultation time (89.6%) and means that they do not need to keep paper records (84.4%) or phone their doctor for results (85.2%). Users found graphs helpful to monitor changes (95.9%) and 83.5% said the system helped them meet their diabetes goals.92.1% said the system contained all expected features. 87% said it reminded users of information discussed at consultations. 85.7% said the system was up to date. 89.1% said the system was easy to use. 94.2% said that supporting information helped understanding of results. 93.7% said it helped them find information tailored to their own diabetes. 96.7% said they were confident the system was secure. 88.2% said it helped to manage their diabetes better. 89.8% said it helps them set goals. 96.4% said the system will significantly improve diabetes self-care in Scotland. Anecdotal feedback included: ‘Immensely satisfied with the system. Really amazing to see my results online.Real motivator’, ‘I don’t have to make appointments to see GP or nurse which is good as I work and don’t like taking time off work’.
Discussion and Conclusion MDMW is a highly effective intervention in the pursuit of supported self-management. Patients report enhanced knowledge and understanding of diabetes and improved motivation to make positive changes. MDMW is a key resource to engage patients in order to achieve strategic aims for the diabetes population in Scotland. We are actively pursuing opportunities to extend the service into other parts of the NHS.
Abstract no. 288 The mediweco project: a wearable sensor-assisted blended learning approach for physiotherapy education
Marko Jovanovic and Stephan M. Jonas, Department of Medical Informatics, Uniklinik RWTH Aachen, Aachen, Germany
Daniel Dohmen, Ulrike Schemmann, and Jürgen Förster, School for Physiotherapy, Uniklinik RWTH Aachen, Aachen, Germany
Christian Renardy, Martin Lemos, and Ursula Ohnesorge-Radtke, Audiovisual Mediacenter, Faculty of Medicine, RWTH Aachen University, Aachen, Germany
Introduction Learning of practical and motoric skills is essential in physiotherapy education, traditionally taught in a classroom setting through observation and repetition. It is important for teaching in general, but especially for physiotherapy students to receive immediate feedback during the learning process in order to correct mistakes and optimize competence. Thus, limited time of the teacher for demonstration and individual supervision is a challenge in the classroom setting. A preliminary study conducted in the Physiotherapy School of the RWTH Aachen University Hospital has shown that learners have a strong need for repeated demonstration, immediate feedback and means for tracking individual learning progress.
Method In this work, the wearable device Myo (Thalmic Inc) is used as an inexpensive consumer-grade human activity recognition device. It contains an eight channel surface electromyograph and a nine-axis inertial measurement unit. The signals can be evaluated with supervised machine learning techniques for different gestures.
The Media Didactics Meets Wearable Computing (MediWeCo) digital assistant based on the Myo device gives continuous individual direct feedback to the learners on the executed therapeutic techniques, enabling them to assess and self-govern their skill level outside of the traditional classroom setting. Individual learning, self-learning and individual repetition are thus intensified, independent of time and location. Furthermore, the digital assistant allows for individual and objective assessment of learners in examinations.
The estimated processing pipeline of MediWeCo includes a human-to-technology module, which establishes communication between the learning application and the Myo wearables. The module includes a gesture recorder for acquisition of movement patterns and a model generator to build gesture models. Evaluation algorithms utilizing machine learning to compare incoming signal data against defined models of movements. Here, the main challenge is the optimum feature selection, both from a learning aspect (what features should be taught, e.g. speed, timing and movement) and from a technical aspect (i.e. what characteristics of the data should be extracted).
Results In prior work, we have employed the Myo armbands to evaluate performance of clinical hand hygiene technique using Artificial Neural Networks and Hidden Markov Models. The system achieved a recognition rate of 98.30% and should thus be efficient in the analysis of physiotherapy techniques as well.
Discussion To cater for these needs, the MediWeCo project was initiated with support of the German Federal Ministry of Education and Research. During the project, a novel mobile blended learning solution for teaching and learning of physiotherapeutic skills and the examination of acquired techniques are implemented. A learning application provides theoretical training on virtual patients using various eLearning approaches. Additionally, interactive and multicam videos give an optimal view on movement as well as technique and allow decision processes to be followed during physiotherapy sessions, respectively. In addition to the didactical concept, the individual manual performance of physiotherapy techniques can be assessed with wearable sensors.
Conclusion Migration from the traditional classroom to a blended learning setting requires major changes in teaching methods, especially for training of manual skills. MediWeCo is a first step towards sensor-assisted blended learning.
Abstract no. 293 Generation Scotland: electronic health record linkage in practice
Archie Campbell, Laura Boekel, and David Porteous, University of Edinburgh, Edinburgh, UK
Introduction The Generation Scotland: Scottish Family Health Study (GS:SFHS) is a family-based genetic epidemiology study of ∼24,000 volunteers from ∼7000 families recruited across Scotland between 2006 and 2011 with the capacity for follow-up through record linkage and re-contact.
Method Participants completed a demographic, health and lifestyle questionnaire and provided biological samples including DNA, and 90% underwent detailed clinical assessment, including anthropometric, cardiovascular, respiratory, cognition and mental health. The biological samples, phenotype and genotype data collected form a resource with broad consent for academic and commercial research on the genetics of health, disease and quantitative traits of current and projected public health importance. Features include the family-based recruitment breadth and depth of phenotype information, with detailed data on cognition, personality and mental health. Genome-wide association and exome genotype data are available on most of the cohort. These features maximise the power of the resource to identify, replicate or control for genetic factors associated with a wide spectrum of illnesses and risk factors. By linkage to routine NHS hospital, maternity, laboratory tests, prescribing and dental records, this has become a longitudinal dataset, using the Scottish Community Health Index (CHI). Mortality data can be obtained from the General Register of Scotland.
Results Researchers are now able to use the linked datasets to find prevalent and incidental disease cases and healthy controls to test research hypotheses on a stratified population. They can also do targeted recruitment of participants to new studies, utilising the NHS CHI register for up to date contact details. There are six published papers on a variety of conditions and currently around 10 ongoing studies based on our record linkage capabilities. Expert working groups have been set up to further annotate data and co-ordinate research in the fields of genomics, cognition, mental health and chronic pain.
Discussion GS has now established and validated EHR linkage, overcoming technical and governance issues in the process. There are current or planned collaborations looking into heart disease, diabetes, breast and colon cancers, depression, neuropathic pain, Alzheimer’s disease and dementia. Generation Scotland is also a contributor to major international consortia, with collaborators from many institutions from the UK and worldwide, both academic and commercial. Some of the GS:SFHS study can also be linked to other studies such as the Aberdeen Children of the Nineteen Fifties and the Walker birth cohort (Tayside) to obtain further longitudinal data and use the SHARE project to obtain new biological samples.
Conclusion Generation Scotland has thoroughly tested the linkage process and plan to extend it to include primary care data (GP records) in the next year. There are plans to extend the cohort and collect more samples and data. The GS resources are available to academic and commercial researchers through a managed access process (www.generationscotland.org).
Abstract no. 295 Generation Scotland: genetic analysis of routine laboratory tests
Archie Campbell, Laura Boekel, Caroline Hayward, and David Porteous, University of Edinburgh, Edinburgh, UK
Introduction The Generation Scotland: Scottish Family Health Study (GS) is a family-based genetic epidemiology study of ∼24,000 volunteers from ∼7000 families recruited across Scotland between 2006 and 2011 with the capacity for follow-up through record linkage and re-contact. Here we present linkage to routine NHS laboratory test results.
Method Participants completed a demographic, health and lifestyle questionnaire and provided biological samples including DNA, and most underwent detailed clinical assessment, including anthropometric, cardiovascular, respiratory, cognition and mental health. They also gave written informed consent for linkage to their medical records. Using the Community Health Index, access has been obtained to routine NHS lab tests from the Tayside and Glasgow area health boards. This covers ∼90% of the GS cohort.
Results More than 20,000 GS participants were genotyped using a genome-wide SNP array. We have extracted uric acid (urate) test results from the routine biochemistry dataset and performed genome wide association (GWAS) analyses with genotype and imputed data. This showed the expected significant result for the SLC2A9 uric acid transporter gene. This provides a proof of concept that the NHS laboratory data could be used for further GWAS (and other genetic) analyses of additional biomarkers, currently under way.
Discussion The Genetic Annotation Expert Working Group of Generation Scotland has now established and validated linkage to routine laboratory data, overcoming technical and governance issues in the process. There is no national dataset, with source data being held in different locations, although it is all part of the Scottish Care Information database (SCI Store). Linked data is released into accredited safe havens, with access limited to approved researchers, and great care must be taken when dealing with individual record level data. The test results go back up to 25 years, and in some cases, the test methodology has changed or been recalibrated several times during that period.
Conclusion Most laboratory tests are requested by GPs and the results could also be linked and accessed via the primary care dataset, which presents a new set of both opportunities and limitations. We plan to explore these over the next year. The GS resources and linked data are available to academic and commercial researchers through a managed access process (www.generationscotland.org).
Abstract no. 297 Developing health data science researchers using a cohort based approach
Georgina Moulton, Farr Institute, MRC Health eResearch Centre (HeRC), Division of Informatics, Imaging and Data Sciences, School of Health Sciences, Faculty of Biology, Medicine and Health, University of Manchester, Manchester, UK
Athanasios Anastasiou, The Farr Institute, Centre for Improvement in Population Health through E-records Research (CIPHER), Swansea University, Swansea, Swansea, UK
Catharine Goddard, The Farr Institute Scotland, University of Dundee, Dundee, Dundee, UK
Paul Taylor, The Farr Institute London, Institute of Health Informatics, University College London, London, UK
Colin McCowan, The Farr Institute Scotland, Robertson Centre for Biostatistics University of Glasgow, Glasgow, UK
Introduction Data science combines skills from computer science, mathematics, statistics and business processes. One response to concern about the sustainability of current models of healthcare delivery – due to increasing complexity and costs, coupled with a drive to personalized medicine – presents a strong argument for a step change in the use of data to guide health-care delivery. The application of data science, comprehensively utilizing existing health data, will help unravel the relationship between treatments, outcomes, patients and costs. There is currently a shortage of data scientists in the UK and internationally. The Farr Institute is creating programmes to train data scientists. Each individual comes with expertise in a specific area that is developed alongside broader scientific and professional skills essential to health data science. Our initial aim was to create a PhD-led ‘community of practice’ that would value the sharing of knowledge and team working in order to encourage new collaborations and avenues of research.
Methods We developed and implemented a cohort-based, team-science focused programme to develop key scientific and professional skills. PhD students from across all participating universities in The Farr Institute were invited to attend. We delivered student symposia, summer schools and industry engagement days focused on data visualization, mobile data and geographical systems alongside professional skills including research communication, writing for the public, conducting research with public involvement, interdisciplinary thinking and working delivered through a team science agenda. All events used standardized feedback surveys with results used to improve the programme going forward.
Results Since 2013, 54 PhD students from 16 institutions across the UK have attended one or more events. The cohort has diverse backgrounds but all have a focus on data and are analysing health data directly or assessing how data is used within the healthcare system. The inter-disciplinary nature of the cohort means that each person gets an understanding for what others bring to the team science approach.
Discussion Students enjoyed a formal structured learning environment to share research knowledge combined with an informal networking opportunity allowing discussion of common issues with peers. Involvement of senior academics provided vision and encouraged collegiality. Workshops were designed to support group-problem-based learning and to highlight the need to change working behaviours and manage multiple perspectives and skills sets to achieve an outcome. Involvement by external bodies including patient representatives and industry has developed communication skills and increased awareness of other viewpoints. Sessions where the outcome was more open ended or the session was not as group focused were less satisfactory. More recently, the summer school model has adapted to grow the network and make international links using the same approach.
Conclusions The Farr Institute PhD programme is successfully developing a community of young researchers, from a variety of disciplines, with a strong team-science focus. The future development of these students as they graduate and move into careers in the field will reflect the impact of the programme. Lessons learned from this cohort team science approach have been used to develop other programmes including a Future Leaders Programme.
Abstract no. 299 The health data ingestion stack
Ali Anil Sinaci, Gökce Banu Laleci Erturkmen, and Tuncay Namli, SRDC Software Research, Development and Consultation Ltd, Ankara, Turkey
Introduction In order to address the challenges introduced by the increasing prevalence of chronic diseases with the aging society, EHRs are widely being adopted, and varieties of health-relevant parameters are captured via wearable devices and smartphone apps. There is also a growing movement called ‘Quantified Self’ to capture person’s state and daily behaviours to establish a basis for preventive medicine interventions. The amount of healthcare and wellbeing data collected becomes unmanageable through conventional IT systems. This creates a big opportunity of big data analytics applications for healthcare data, where the requirements of high volume, velocity (real-time data from medical sensors), and variety (heterogeneity) of healthcare data sources can be addressed adequately.
Method In this study, we introduce the underlying architecture of the health data analytics platform that has been designed as a highly scalable ingestion stack respecting to the principles of Big Data Lambda architecture. The stack starts with the Inbound Adaptors acting as an interface to various health data sources such as EHRs, medical/tracking devices and mobile/Web/IoT applications. Several adaptors have been implemented for standards based communication: (i) HL7 CCD based clinical documents, (ii) ISO/IEEE 11073 compliant medical devices and (iii) Bluetooth LE enabled tracking devices. For device integration, an Android application has been implemented to collect data from medical devices and trackers, which also captures the measurements from the sensors on the phone and from Google Fit.
According to the nature of the analytics services, data received through the Inbound Adaptors follow either the batch layer or the speed layer of the ingestion stack. If real-time analytics is required, the Spark streaming based speed layer processes the data. Otherwise, data is processed by the batch layer through Apache Spark using Cassandra for data extraction, mediation, medical terminology mapping, summarization and complex rule processing. The results of the ingestion processing are received by the outbound adaptors to be exploited by the consumers such as data visualization services or machine learning algorithms.
Results ISO/IEEE 11073 compliant blood pressure and blood glucose measurement devices, a wristband that provides skin temperature, heart rate and measures for movement through Bluetooth LE and an Android application collecting data from phone sensors and Google Fit have been implemented and integrated to the ingestion stack, and tested with in vivo data collection mechanisms. In the next phases, the project will focus on EHR integration.
Discussion Collected data will be used through a use case where the outbound results will be smart, adaptive and personalized interventions for diabetic patients so that the interventions resulting from the extensive analytics can lead to behavioural changes in those patients for reducing risks and improving quality of life.
Conclusion The health data ingestion stack is being developed in the scope of ITEA3 Medolution Project. With this stack, the aim is to be able to process data from various health data sources, perform predictive and prescriptive analytics for both medical professionals and patients themselves and lead to better-informed decisions and interventions with the patients.
Abstract no. 303 Multimorbidity patterns in older adults: an analysis of the UK Biobank data
Nafeesa Dhalwani and Melanie Davies, Diabetes Research Centre, University of Leicester, Leicester
Dawit Zemedikun, Laura Gray, and Kamlesh Kunti, University of Leicester, Leicester
Introduction With an ageing population, multimorbidity has become one of the main challenges in recent years for patients and the health care systems worldwide. Hence, it is crucial to characterise the problem in order to devise effective strategies to manage multimorbidity and move towards integrated healthcare rather than single-disease focus. Therefore, we aimed to identify patterns of multimorbidity and disease clusters in older adults from the UK.
Methods Using the UK Biobank, we extracted data on 36 chronic conditions in 502,643 participants. Firstly, we assessed the prevalence of multimorbidity overall and by patient characteristics. We then assessed the patterns of co-existence between these conditions using a two-step approach initially using a cluster analysis to identify chronic conditions that cluster together and then using association rule mining to look at the patterns within these clusters more closely. We estimated support, confidence and lift for each association rule, using lift as the primary measure of significance. The results were presented using visualisations and summary tables. Subgroup analyses by age, gender and ethnicity were also performed.
Results The overall prevalence of multimorbidity in the study was 19% (n=95,710) and no significant variations were found by age. However, multimorbidity was more common in in the black ethnic group compared to the others and increased with deprivation. 3 clusters were obtained with up to 30 association rules within each cluster. The first cluster resulted in two diseases that were highly associated (angina and heart attack with a lift of 13.27). The second cluster included conditions like osteoporosis, stroke, heart failure, atrial fibrillation, vascular disease, chronic kidney disease, etc. with diabetes at the epicentre of the cluster. Heart failure and atrial fibrillation had the strongest lift in this cluster (23.60). The third cluster was a medium sized, high prevalence cluster including conditions like hypertension, asthma, cancer and depression etc. with lift ranging from 1-5. Subgroup analyses showed variations of multimorbidity patterns by gender and ethnicity however, no variation was found by age groups. Generally, depression was at the centre of the disease association for the males while diabetes and osteoporosis dominated the association for the females. Similarly, diabetes was at the centre of the association for the white participants while depression and cancer dominated the associated for the non-white participants.
Discussion This study used data from a large, national well-defined population with high sensitivity to identify multimorbidity, based on a comprehensive list of chronic conditions included. We utilised a novel way of identifying patterns of multimorbidity and variations by age, gender and ethnicity and demonstrated the applicability of data mining techniques to medical data where its use has generally been very limited.
Conclusion This study found certain conditions to be at the epicentre of disease clusters and focusing on better management and secondary prevention of conditions like diabetes and hypertension may help prevent other conditions in the clusters.
Abstract no. 306 Understanding the true correlation between conditions using electronic health records and probabilistic programming
Philip Rooney, University of Sussex, Brighton
Elizabeth Ford, Brighton and Sussex Medical School, Brighton
Introduction Electronic patient records (EPRs) can be used to understand the rates of a medical disorder within the general population and provide medical practitioners with early warnings of which patients are at risk of a disease. Unfortunately, EPRs contain uncertain and incomplete data. Traditional epidemiological statistical methods do not translate well to this new environment. Current studies assume that a recorded diagnosis is correct. If a patient has a recorded diagnosis, it is assumed to be true, and likewise, if a patient does not have a diagnosis they are assumed not to have the condition.
As part of the Wellcome Trust funded ASTRODEM study, we trialled analysis methods borrowed from astrophysics which model the complexity of the data to find the rates of misdiagnosis, the probability of a condition, and probability that a patient has a condition given they have a combination of up to two other diagnoses.
Methods Real world data includes misclassifications, so we do not know the “truth”. To demonstrate this method we, therefore, generated synthetic data. The probabilities of having combinations of three condition statuses (e.g. dementia, diabetes, obesity) and the probabilities of receiving subsequent diagnoses were decided, and 100,000 patients were randomly generated.
We fitted a hierarchical Bayesian diagnostic model containing 14 variables. We used Bayesian priors to represent the probabilities of misdiagnosis. Eight variables gave the probability of each combination of conditions (note this is not the combinations of diagnosis). The final six variables are the probabilities of having a diagnosis of a condition given a patient has or doesn’t have that condition. The model fits combinations of parameters to the number of people with each combination of diagnoses. This assumes that these combinations can be combined to create a binomial parameter to explain the number of patients in a group. We compared this model to a logistic regression model.
Results Using the Bayesian model we estimated conditional probabilities which were much closer to the real value. For example, for the probability of condition 1 (e.g. dementia) given condition 2 (e.g. diabetes) and 3 (e.g. obesity), conventional analyses that conflate diagnosis with true condition status predicted a value between 0.26-0.28, the Bayesian model predicted 0.34-0.44, and the true value was 0.375. We could also estimate the probability of receiving a diagnosis for condition 1 in the case that the patient has the condition and doesn’t have the condition. Conventional analysis cannot estimate these values from our dataset.
Discussion & Conclusions This study provides evidence that where rates of misclassification or misdiagnosis are not taken into account, estimates of the association between two conditions can be wholly inaccurate. This method can recover the true association, as well as giving information about probabilities of diagnosis that are not available using conventional methods.
Three conditions were chosen to prove the principal of this technique, but this can be increased to many more conditions. This method will be expanded further to include time series information. The method will be applied to real world dementia data during the ASTRODEM project.
Abstract no. 307 Trends in socio-demographic inequalities in the risk of a cancer diagnosis through emergency presentation: evidence from population-based data, 2006-13
Annie Herbert, University College London, London
Gary Abel, University of Exeter, Exeter
Sam Johnson, Public Health England, London
Georgios Lyratzopoulos, Health Behaviours Research Centre, University College London, London
Introduction There are known large socio-demographic inequalities in the risk of being diagnosed with cancer through an emergency presentation. While there have been welcome decreases in the overall proportion of emergency presentations (24% in 2006, 20% in 2013), it is important to also consider whether inequalities by age and deprivation group are narrowing or widening over time.
Methods We analysed population-based ‘Routes to Diagnosis’ data for patients diagnosed in England between 2006 and 2013, with any of 33 cancer sites (including all common cancers and several rarer ones). Logistic regression was used to examine the association between diagnosis through emergency presentation and age (25-49, 50-59, 60-69, 70-79, 80+ years) deprivation (defined by Index of Multiple Deprivation quintiles), sex, cancer site, and year of diagnosis. Interactions between age and year, and between deprivation and year, were used to examine whether inequalities narrowed or widened over time. The regression model was also used to estimate the proportion of patients in each age group and each deprivation group diagnosed through EP in each year, adjusting for the different sex, cancer and age/deprivation make-up of the different groups.
Results In 2006, there were notable inequalities in risk of diagnosis through emergency presentation by age-group (among 50+y olds adjusted proportions ranged from 17.7% for 50-59y olds to 33.3% for 80+y olds) and deprivation (least deprived: 20.1%, most deprived: 27.2%). There was strong evidence that these inequalities changed over time (p<0.0001 for both interaction terms). Nonetheless, the magnitude of these changes was overall small. Considering associations with age, we saw a narrowing of inequalities in <80y olds, although the difference between the very old (80+y) and patients aged 70-79y increased over time. Specifically for deprivation, we observed only a small degree of narrowing of inequalities in emergency presentation over time. Predictions from the model indicated that if there were no inequalities in risk of emergency presentation by deprivation, nationwide the proportion of patients diagnosed through that route during the study period would have decreased from 21.4% to 18.7%.
Discussion Although rates of diagnosis of cancer through an emergency presentation have decreased in recent years, there has been little reduction in related inequalities, which are even widening for the oldest patients.
Conclusion There may be additional opportunities for further overall reductions in the proportion of patients diagnosed via emergency presentation, by eliminating socio-demographic gradients.
Abstract no. 312 Associations between diagnostic route and care experience for patients with colorectal cancer: evidence from linked data
Theodosia Salika, Christian Von Wagner, Cristina Renzi, Annie Herbert, and Georgios Lyratzopoulos, Health Behaviours Research Centre, University College London, London
Gary Abel, University of Exeter Medical School, Exeter
Silvia Mendonca, University of Cambridge, Cambridge
Sean McPhail, Public Health England, London
Introduction Positive experiences of care are increasingly considered important for cancer patients. Different routes (pathways) to the diagnosis of cancer may influence the experience of subsequent cancer care. If so, optimising diagnostic routes may help improve cancer patient experience among other clinical outcomes. However, formal evidence about the presence, direction and strength of associations between routes and experience is lacking.
Methods We examined associations between diagnostic routes and experience for patients with colorectal cancer using linked data from the Cancer Patient Experience Survey 2010 and the Routes to Diagnosis dataset. Routes to Diagnosis denote eight different care pathways to the diagnosis of cancer, including screening detection, emergency presentation, ‘urgent’ specialist referral for suspected cancer to secondary care (otherwise known as 2-week-wait referral) and non-urgent referral.
We selected 10 ‘report’ and 8 ‘evaluation’ questions from the survey instrument, representing all major aspects of the patient journey from diagnosis to post-treatment care. ‘Report’ questions reflect actual processes of care (e.g. whether patients were provided with access to specialist nursing), whereas ‘evaluation’ questions reflect the appraisal of how a process was experienced (e.g. whether patients felt that explanations about the treatment were adequate).
We categorised responses as binary (positive/negative) experience outcomes, consistent with public reporting conventions for CPES. For each selected survey question separately, we describe case-mix adjusted proportions and odds ratios of patients endorsing a negative experience of care. Adjustment was made for age (5 groups), sex, deprivation quintile, ethnicity (white/non-white) and major cancer type.
Results Across the 18 survey items, we observed consistent associations between diagnostic route and care experience, with evidence (p<0.05) that patients diagnosed after an emergency presentation evaluate their experience more critically than those diagnosed via a 2-week-wait referral route for 12/18 questions (adjusted odds ratio for negative experience ranging from 1.19 to 2.96). For the remaining 6/18 questions the associations were not large enough to be statistically significant. In absolute terms, across the 12 questions the proportions of patients indicating a negative experience were between 4% and 23% greater (adjusted for case-mix) compared with patients diagnosed via the 2-week-wait referral route.
In contrast, screen-detected patients reported significantly better experience for 7/18 questions (adjusted odds ratio for negative experience ranging from 0.52 to 0.83). For the remaining 11/18 questions the associations were not large enough to be statistically significant for 10. In absolute terms, screen-detected cases reported between 3% and 9% more positive experience across the 7 questions (adjusted for case-mix) compared with patients diagnosed via the 2-week-wait route. Associations between diagnostic route and experience were similar for both evaluation and report items.
Discussion Diagnostic routes influence cancer patient experience notably. The fact that this influence is seen in both report and evaluation questions suggests that the impact is reflected in actual quality of care rather than simply a perception of care (potentially reflecting prognosis).
Conclusion Expanding the pool of screen-detected cases and decreasing the proportion of emergency presenters could result in improvements not only in clinical outcomes but overall experience of cancer care.
Abstract no. 313 Co-designing eHealth for co-care of Parkinson’s disease: participants’ experiences
Carolina Wannheden, Helena Hvitfeldt-Forsberg, Emma Granström, Elena Eftimovska, and Åsa Revenäs, Karolinska Institutet, Stockholm
Introduction In Sweden, the care of people with Parkinson’s disease (PWPD) is challenged by a lack of neurologists. Care professionals would benefit if some of their patients could take more responsibility in self-care, but patients who have the motivation and ability to do so lack the necessary tools and support. The term co-care has been coined to emphasize patient-provider partnership, supported by e-health services, in order to achieve best possible health, based on patients’ individual goals.
This project explored the needs of PWPD and care professionals through co-designing an eHealth service for co-care. The specific aim of this study was to analyze the experiences of participants and researchers who were involved and gain knowledge on how co-design processes can be used more effectively.
Method A co-design process with 4 workshops was carried out May-June 2016. 7 PWPD, 3 nurses, 4 physicians, and 2 physiotherapists participated. In addition, 4 researchers were present as non-participant observers. The workshops were facilitated by a designer and an eHealth strategist and resulted in the Co-Care Companion (CCC), a new concept and prototype for an eHealth service for patients with chronic conditions and their care providers. Data on participants’ experiences were collected using written participant feedback during the workshops and a web-questionnaire (containing open-ended questions) after the workshop series. Data also included researchers’ observation notes, and written reflections between the workshops. Qualitative inductive content analysis was used to analyze participants’ and researchers’ experiences.
Preliminary results Both PWPD and care professionals had positive experiences of participating in the workshop series and were willing to contribute again in the next phase of development. However, some challenges were also identified: time consumption, scheduling of workshops, power relations between different roles, care relations between some of the participants, hesitations speaking up in a big group, challenges related to medical conditions, and understanding healthcare terminology.
The following quotes illustrate some of the experiences:
“I appreciated the participants in the group with different competences that shared their point of views” (patient)
“It was very interesting. However, I believe that separating patients and care providers would have been beneficial to balance the different roles.” (nurse)
Discussion Co-design with patients and care professionals as a process was valuable in exploring needs and opportunities, as well as creating services that meet the needs of both parts. However, the process needs to be carefully designed and continuously adapted to ensure that inherent provider-patient power relations do not influence the outcome.
Conclusion Based on this study, we will be able to generate some guidelines that could benefit other researchers who use co-design as a method. Further research is needed to provide more comprehensive recommendations.
Abstract no. 315 Implementation of a Charlson comorbidity index for the SAIL databank
Arfon Rees, Ting Wang, Daniel Thayer, and Mark Atkinson, Swansea University Medical School, Swansea
Introduction The Charlson comorbidity index is a method of measuring the burden of comorbidity in a patient. It was developed in 1987 in a single hospital in New York. A patient is scored for the presence or absence of conditions in 19 groups of comorbid conditions. Each score is multiplied by a weight and a final score is obtained by addition of these. The weights are derived according to the risk of mortality.
We have developed an implementation of the Charlson comorbidity index for use on Welsh hospital inpatient data, the Patient Episode Database for Wales (PEDW) which is a retrospectively coded summary of diagnoses which uses ICD10 coding. This exists within the SAIL databank, a collection of national datasets for Wales, which is used for research.
Method We based our version on one used within the NHS, optimized for HES (Hospital Episode Statistics inpatient admissions in England). The weights used are also optimized for estimating mortality from HES data. The only modification in our method from the above is the removal of HIV/AIDS from the groups as we do not have those data. We therefore have 16 groups acute myocardial infarction, cerebral vascular accident, congestive heart failure, connective tissue disorder, dementia, diabetes without long-term complications, mild or moderate liver disease, peptic ulcer, peripheral vascular disease, pulmonary disease, cancer, diabetes with long-term complications, paraplegia, renal disease, metastatic cancer and severe liver disease.
Results The algorithm has been implemented as an SQL stored procedure. The procedure is applied to an input dataset of cases with dates of diagnosis of a principal condition of interest. Parameters can be set to modify the analysis (a) to exclude a comorbidity group if desired, for example if the condition of interest is included in one of the groups, (b) to exclude the primary diagnosis, (c) the time period over which the comorbidities are searched for can be set (eg within a year of diagnosis of the condition of interest or on the same date.
Discussion Many competing methods of measuring comorbidity have been proposed but the Charlson index in its many modifications remains the dominant method of use. This therefore facilitates comparison across other datasets. We have modified an existing widely accepted framework for assessing comorbidity to suit our coding system and data. The Charlson Index can be mapped across to any coding system, allowing us to modify it to be used for other datasets within the SAIL databank, such as our GP data which uses Read coding. The measurement of comorbidity is important in adjusting for differences in disease burden. Many studies have been published using PEDW and this will aid in standardising our approaches.
Conclusion Implementation of this method using a stored procedure facilitates the use of a standard method which can be used on different datasets by changing only the parameters.
Abstract no. 317 POWER2DM: predictive model-based decision support for diabetes patient empowerment
Tuncay NAMLI, SRDC Software Research & Development and Consultancy Corp., Ankara
Suat Gönül, Nederlandse Organisatie voor Toegepast Natuurwetenschappelijk Onderzoek (TNO), Leiden
Albert De Graaf, Software Research, Development and Consultation Ltd, Ankara
Introduction The prevalence of diabetes has increased markedly over the last 50 years in parallel with increasing rates of physical inactivity and obesity. As of 2010, there are approximately 285 million people in the world who are diagnosed with T2DM compared to around 30 million in 1985. There is an urgent need to develop cost-effective intervention strategies for diabetes. Given the enormous scale of the problem, and the fact that such a large percentage of cases arise due to an unhealthy lifestyle, personalized care systems that include innovative self-management support strategies, well-linked to the medical care of patients, are of prime importance.
Method The main aim of POWER2DM is to develop and validate a personalized self-management support system (SMSS) for T1DM and T2DM patients that combines and integrates: (i) a decision support system (DSS) based on interlinked predictive computer models (ii) automated e-coaching and advice functionalities based on Behavioural Change Theories and (iii) real-time personal data processing and interpretation.
The DSS will be based on existing predictive models that were originally developed primarily for decision support to health-care professionals, specifically the KADIS short-term-plasma glucose prediction model, the T2D-Marvel medium/long-term prediction model for diabetes progression, and established long term diabetes-related risk scoring models for diabetes and its co-morbidities.
The SMSS will provide automated personalized care plans in terms of lifestyle changes and therapy adjustments for short-term optimal metabolic control as well as for medium/long-term prevention of deterioration and diabetes complications. The SMSS will fully integrate subject-specific health behaviour change interventions to increase adherence of the patients to their personalized care management program. The predictions will be based on real-time personal data monitoring and tracking.
The POWER2DM will be evaluated in 3 pilot studies in 3 different European countries (Germany, Netherlands, and Spain) with 280 patients in total, where half of them will receive POWER2DM support and the other half will be the control group.
Results In the first 8 months of the project, to-be scenarios have been produced by the end-users, which, following user-centred design principles, led to the identification of technical use cases and formal requirements, and then the conceptual design of the POWER2DM architecture. Work is now focused on the calibration of the predictive models, research on interventions for behaviour change and implementation of the first prototype.
Discussion Despite multiple policy reports and international declarations, action on and funding for diabetes still lags behind other chronic conditions like cancer or cardiovascular disease. Existing diabetes care and prevention services and approaches do not sufficiently target patients or have a limited focus mainly on blood glucose control, there is a gap between evidence-based findings and diabetes care, self-management interventions are not able to maintain efficacy over longer periods of time, and there is too much time delays in finding optimal therapy.
Conclusion By the 12 months of piloting in diverse settings, POWER2DM aims to strengthen the evidence base in self-management support for patients with diabetes with the usage of prediction models and Just-in-time Adaptive Interventions designed based on behavioural change theories.
Abstract no. 319 Validation and psychometric analysis of a questionnaire for measuring teleconsultation services quality from the patients’ perspective
Esmée Tensen, Leonie Thijssing, and Monique Jaspers, Academic Medical Center- University of Amsterdam, Amsterdam
Introduction Patient satisfaction with teleconsultation services has a positive effect on the acceptance and implementation of these services. However, valid and reliable instruments measuring patients’ experiences with teleconsultation services to improve these services are lacking. The aim of this research is to develop a validated and standardized questionnaire measuring teleconsultation services quality from the patients’ perspective.
Methods With permission of GPs, patients who had experienced a telecardiology, telepulmonology or teledermatology consultation in the period December 2015 till June 2016, and of whom the address was known, were invited for a validation study of a questionnaire about teleconsultation services. Two types of questionnaires were constructed: the experience and the importance questionnaire. The questionnaires contained items to measure patients’ experiences with and appreciation of quality of teleconsultation services respectively. Data collection was online but patients could also request a paper-based questionnaire. To increase the response rates, postal reminders were sent after 1, 4 (including a paper-based questionnaire) and 6 weeks. Psychometric analyses were conducted to assess the reliability and validity of the questionnaire. First, we searched for extremely skewed items, items with high missing/I do not know/not applicable values, and strongly correlated items. Second, we conducted explorative factor analyses with direct oblimin rotation on items with similar answering categories, except for the extremely skewed and high number of missing items, to find patterns and correlations between different items and to group them into one factor. Questionnaire items were assigned to the factor with the highest factor load. The internal consistency of the emerging scales was calculated using Cronbach’s alpha.
Results The data of 90 (58 online and 32 on paper) of the 402 net approached patients were eligible for analysis (response rate: 22.4%). The average age of the respondents was 59.8 years (24-95 years SD=14.4). Two items were extremely skewed, one item had >5% of missing answers, and two items were highly correlated. The psychometric analyses resulted in three reliable scales with high internal consistency (α=0.737 - α=0.839): ‘communication and information’, ‘organization of care’ and ‘cost and compensation’.
Discussion This study aimed to develop a validated and standardized questionnaire measuring quality of teleconsultation services from the patients’ perspective. Preliminary results indicate that three reliable scales can be formed (communication and information, organization of care, and cost and compensation). The strength of this study is that the questionnaire was developed based on a strict methodology. The power of the study was low for valid conclusions and should be increased to decide whether certain questions should be deleted. Furthermore, after this pilot study criterion and content validity have yet to be assessed. We expect that this will result in a validated, standardized and shortened questionnaire for measuring patients’ experiences with teleconsultation services. Conclusion: Preliminary psychometric results of the teleconsultation questionnaire are good but further research is needed on the reliability and validity of the questionnaire with a larger patient population. The questionnaire can be used to gain insight in patients’ experiences and perspectives on teleconsultation and can improve patient satisfaction with teleconsultation.
Abstract no. 327 Can we identify people with higher cancer risk who present at GP surgeries with T2D?
Ellena Badrick, Hannah Lennon, Matthew Sperrin, and Iain Buchan, Tjeerd van Staa, and Andrew Renehan, The Health eResearch Centre and The Farr Institute, Division of Informatics, Imaging and Data Sciences, School of Health Sciences, Faculty of Biology, Medicine and Health, The University of Manchester, Manchester Academic Health Science Centre, Manchester
Introduction Type 2 Diabetes (T2D) is associated with increased risks of developing several cancer types, including breast, colorectal, kidney, pancreatic and liver. We have shown that the diagnoses of T2D and incident cancer commonly co-occur. Thus, there are opportunities to develop risk models of cancer occurrence within the first 6 months after diagnosis of T2D as an early cancer diagnosis strategy. Previous studies on this topic have been limited by failure to link with cancer registries, which (i) commonly underestimates cancer incidence by 9% to 25% and (ii) may misclassification date of cancer diagnosis, when cancer is diagnosed through primary care datasets only.
Methods We accessed data from the Clinical Practice Research Datalink (1990-2011), on 330,311 individuals with T2D from 372 GPs in the UK, and linked these with the National Cancer Registration and Analysis Service, yielding 57,910 individual cancers. We developed logistic regression models to determine the cancer occurrence within 6 months of T2D diagnosis. Covariates included were sex, age (continuous and in 5 year bands), smoking status, body mass index (BMI), alcohol, government office region and Index of Multiple Deprivation (IMD). We benchmarked our results against the UK National Institute of Health and Care Excellence (NICE) of 3% Positive Predictive threshold value (PPV) in their guidance on immediate referral with symptoms suspicious for cancer. A priori, analysis was stratified on sex, smoking status (ever n=108,408, never n=108,599) and obesity at T2D diagnosis (BMI: above n=174,520 and below n=42,487, 30 kg/m2). Performance discrimination of the model was assessed using the area under the ROC (AUCROC) curve.
Results There were 117,155 men with a new diagnosis of T2D with 853 cancers and 99,852 women with 710 cancers, diagnosed within the first 6 months of T2D diagnosis. In fully adjusted models, for men AUCROC: 0.733 and for women AUCROC: 0.658. In men 1762 were classified as having a cancer risk above the 3% threshold, of these 42 were true positives, a PPV of 2.38% for women 34 were classed above the threshold of these 2 were true positives, a PPV of 5.88%. When stratified by smoking status or by obesity the AUCROC did not reach above 0.7. All models had poor sensitivity and high specificity. For women stratified by smoking status or by obesity the AUCROC did not reach above 0.7. In men the AUCROC was >0.70 for all groups. However the PPV was only >3% for those with a BMI<30 at diagnosis, where 66 people were classified above the threshold, 2 were true positives, AUCROC 0.794.
Discussion & Conclusion There are opportunities to develop a risk model of cancer occurrence within the first 6 months after diagnosis of T2D, but this was at a price of poor sensitivity and high specificity.
Future developments will include external validation approaches and testing emerging hypotheses for example, a new diagnosis of T2D without the presence of obesity may indicate a strategy of enhanced cancer investigations.
Abstract no. 328 Evaluation approach for the diabetes digital coach NHS testbed project
Tim Benson, R-Outcomes Ltd, Newbury
Tom Dawson, Rescon Technologies Ltd, Crondall
Matthew Goodman, Mapmyhealth, Nottingham
Mark Jenkins, Oviva UK Ltd, London
Elizabeth Dymond, West of England AHSN, Bristol
Adam Lester-George, LeLan Ltd, Bristol
Tommy Parker, Ki Performance Ltd, London
Phil McEwan, Sandra Tweddell, HEOR Ltd, Cardiff
Introduction The primary objective of the NHS England Testbeds programme is to “evaluate the real world impact of new technologies offering both better care and better value for taxpayers, testing them together with innovations in how NHS services are delivered”.
Diabetes is one of the largest and fastest growing conditions impacting healthcare, which is best managed by active self-care. The aim of the Diabetes Digital Coach (DDC) Testbed project, led by the West of England AHSN, is to help people with diabetes self-manage their own condition more effectively and seamlessly using remote monitoring and web-based coaching technology. The Diabetes Digital Coach is an IoT Test Bed and part of the joint Test Bed programme between NHS England, the Office for Life Science, the Department of Health and the Department for Culture, Media and Sport. It runs from May 2016 to July 2018 and will involve about 12,000 people with diabetes.
Methods The evaluation of the DDC programme involves multiple parties including 7 commissioning organisations (CCGs), 6 community health service providers, 5 diabetes-specific applications and 3 main sponsors. The diabetes, specific applications include Ki, Mapmyhealth, Oviva, Rescon and Social Diabetes, linked to robust infrastructure provided by Soupdragon, HPE and the Corsham Institute. Evaluation is a collaborative activity in which all stakeholders have a major interest in the results. A consensus-building approach has been used to identify the main strands. Organisations involved in the evaluation include R-Outcomes, HEOR and Cardiff University plus an expert Evaluation Advisory Group.
Results & Discussion The evaluation strands include:
1. Clinical outputs that measure changes in patients’ conditions and hence probability of future complications. Economic evaluation includes modelling outcomes and their financial implications over a longer period of time using the Cardiff Model. Clinical data, such as laboratory test results (HbA1c etc.) stored in GP computer systems will be extracted using MIQUEST or similar tools. The evaluation will also use self-reported data, collected by people with diabetes.
2. Health service utilisation such as Out of Hours (OOH) calls, A&E attendances and non-elective hospital stays, and hence short-term savings, as a result of changes in self-care. Before and after data on service use will be obtained from analysis of nationally collected data such as Hospital Episode Statistics (HES).
3. Patient-reported outcomes measures (PROMs) track changes in health status, personal wellbeing, health confidence to self-care, patient and user experience. In addition to using short generic measures developed by R-Outcomes Ltd, some diabetes specific measures will also be used. PROMs data will be collected at enrolment and at agreed intervals thereafter.
4. Qualitative research will seek to understand the changes at a greater level of detail. In depth interviews with key stakeholders and representative users will seek to understand how leadership, governance and technical issues have affected progress to maximise spread.
5. Application usage, based on data collected automatically from the technologies in use within the DDC.
Conclusions The multidimensional evaluation approach will feed back into the project, to inform enrolment strategies and spread to a wider population of people with diabetes and interested clinicians.
Abstract no. 333 Adoption and level of use of health information exchange in the province of Québec, Canada
Aude Motulsky, Centre de recherche, Centre Hospitalier de l’Université de Montréal, Montreal
Daniala Weir and Nadyne Girard, McGill University, Montreal
Claude Sicotte, Université de Montréal, Montreal
Marie-Pierre Gagnon, Université Laval, Montreal
David Buckeridge and Robyn Tamblyn, Department of Epidemiology, Biostatistics and Occupational Health, McGill University, Montreal, Canada
Introduction Health information exchanges (HIE) are seen as an essential technology for improving healthcare quality and efficiency by allowing patient-centred data exchange over time and across organizations. The objective of this study is to describe the adoption and the level of use of an HIE in the province of Quebec, Canada, two years after its full implementation. The Quebec population-based HIE implements a pull model where authorized healthcare providers (app. 100,000 potential users) can request data for a patient under their care.
Methods An analysis of usage data between January 1st 2016 and July 31st 2016 was performed to describe the usage of three types of clinical data (medication dispensations, laboratory results, and diagnostic imaging) available through this HIE. The number of authorized users, active users, and number of accesses per user according to their role (physician, nurse, pharmacist, other [technicians, archivists, midwives, etc.]), medical specialty, and clinical setting (acute care, long term care, primary care, pharmacy) were described. Data were obtained from the Health Ministry of Québec.
Results & Discussion At the time of the study, a total number of 48,065 individuals were authorized to access the HIE. During the study period, a total of 26,939 (56%) active users accessed the HIE: 29% physicians, 28% nurses, 25% pharmacists, 4% medical residents, and 14% other. Among physicians, 75% were GPs, 25% were specialists. 80% (6,669/8,319) of the total number of potentially authorized pharmacists in the province accessed the HIE, 66% (5,980/8,906) of GPs, while only 20% (1,949/9,748) of specialists and 10% (7,443/74,579) of nurses accessed it. Of the three types of clinical data available, medication data was the most likely to be accessed by any user. All healthcare professional users accessed medication data at least once GPs had the greatest number of mean accesses during the study period (565), followed by pharmacists (441), nurses (269) and medical residents (177). For the other data domains, more than 90% of active residents accessed the lab or imaging data (94% and 92% of residents, respectively), with a mean of 89 accesses to lab and 39 accesses to images per user. 92% of active pharmacists also used lab data (85 average accesses per user). 87 % of active medical specialists accessed lab data and were the most active users of this domain, with a mean number of 160 accesses. GPs were the highest users of imaging data, with 50 accesses per user on average. 79% of active nurses accessed lab data (average of 72 accesses) with 50% of them accessing imaging data (average of 22 accesses). The greatest number of users for all three domains came from acute care settings.
Conclusion This HIE was used by a diverse group of healthcare professionals. Most pharmacists and the majority of GPs in the province have adopted the tool. Medication data was the domain that was used the most, indicating that it has broad value across clinical settings.
Abstract no. 336 PreventIT: using smart technology to motivate older adults and prevent functional decline
Elisabeth Boulton, Helen Hawley-Hague, David French, and Chris Todd, University of Manchester, Manchester
Introduction Balance, strength and physical activity are important factors for healthy ageing and preventing age-related functional decline. In order to be effective, preventive interventions must target risk factors for functional decline, be tailored to the needs and preferences of the individual, and be designed to change behaviour to a sustained healthier lifestyle. Smartphones and smartwatches are used by an increasing number of people, with thousands of smartphone applications available to promote healthy lifestyles. However, few of these applications are evidence based, meaning that their contribution to overcoming the challenges presented by an ageing population is limited.
Method The European Project “PreventIT” (Grant Agreement No. 689238) has adapted the Lifestyle-integrated Functional Exercise (LiFE) programme, which reduced falls in people 75 years and over (BMJ 2012 345:e4547), for a younger cohort (aLiFE). The aLiFE programme was developed during expert meetings and incorporates challenging strength and balance/agility tasks, as well as specific recommendations for increasing physical activity in young-older adults, aged 60-70 years. Personalised advice is given on how to integrate strength, balance and physical activities into daily life, in a way which should not be time consuming. aLiFE has been further developed to be delivered using smartphones and smartwatches (eLiFE), providing the opportunity to send timely motivational messages and real-time feedback to the user. Both aLiFE and eLiFE are behaviour change interventions, supporting older adults to form long term physical activity habits. PreventIT has taken the original LiFE concept and further developed the behaviour change elements, explicitly relating them to Social Cognitive Theory and behaviour change techniques.
Results The motivational elements of aLiFE and eLiFE have been mapped to Social Cognitive Theory and Behaviour Change Techniques. Goal setting, planning, prompts and real-time feedback are used to deliver a person-centred experience for participants in the intervention. Findings from the aLiFE and eLiFE pilot studies highlight the feasibility and acceptability of the PreventIT motivational strategy, with the vast majority of the participants rating the programmes positively (satisfaction score median: 6 points, out of maximum 7).
Discussion Mobile technology such as smartphones and smartwatches can be used effectively to monitor behaviour and to deliver a personalised intervention. The PreventIT mHealth intervention focusses on behaviour change from initiation to long-term maintenance, addressing the different phases of adopting a healthier lifestyle. As such, it makes a strong contribution to the developing field of evidence-based mHealth.
Conclusion After attending this session, participants will understand the motivational strategy of PreventIT, together with the acceptability of sending evidence-based messages to adults aged 60-70 years using smart technology.
Abstract no. 343 Co-morbid determinants of chronic disease progression: three explorations using biomarkers and health records
Steven Kiddle and Jennifer Quint, Department of Biostatistics and Health Informatics, Institute of Psychiatry Psychology and Neuroscience, King’s College London, London
Elizabeth Baker, MRC Biostatistics Unit, Cambridge
Robert Stewart, Respiratory Epidemiology, National Heart and Lung Institute, Imperial College, London, London
Iain Buchan, Department of Psychological Medicine, King’s College London, London
Richard Dobson, NIHR Greater Manchester Primary Care Patient Safety Translational Research Centre, Institute of Population Health, The University of Manchester, Manchester
Introduction More patients worldwide are living (longer) with multiple long-term conditions. Over 90% of older adults with chronic kidney disease (CKD), chronic obstructive pulmonary disorder (COPD) or dementia(s) have co-morbidities (i.e. at least one other chronic disease), and yet clinical guidelines and most research focuses on managing single conditions1. It is plausible that individuals with a greater burden of co-morbidity will progress faster, and therefore require different treatment strategies.
Method CKD progression will be studied using creatinine measures from the Salford Integrated Record2. COPD progression will be studied using Forced Expiratory Volume in 1-second (FEV1) measures from the Clinical Practice Research Datalink3. Dementia progression will be studied using Mini Mental State Examination (MMSE) mined from the free text of EHRs using Clinical Record Interactive Search4. Patient demographics, availability of biomarker data and presence of co-morbidities will be described, along with analysis of the effective density of observations5. Co-morbidities of interest will include: hypertension, hyperlipidemia, ischemic heart disease, diabetes, arthritis, heart failure, depression, CKD, osteoporosis, dementia, COPD, atrial fibrillation, cancer, asthma and stroke.
Results We will describe the availability and longitudinal value of biomarker data for ∼150,000 patients to study co-morbid determinants of CKD, COPD and dementia progression. Density of observations will be compared to patient characteristics to quantify diagnostic ascertainment bias/informative presence. Methods to account for this, such as propensity scoring, or analyses stratified by observation density, will be considered going forward.
Discussion In future studies we will use this data to test the hypothesis that co-morbidities influence the progression of CKD, COPD and dementia. To achieve this we will investigate the challenges of longitudinal modelling of biomarker data from health records, and the relative merits of mixed models, alignment and latent class approaches in this context6. Due to the potential for residual confounding, we will not make causal statements, but generate causal hypotheses that can be investigated in future studies.
Conclusion Enormous amounts of data on the progression of typical patients are available within health records. These can be used to fill knowledge gaps about prognosis and optimal care for patients with significant co-morbidities.
References
Salive (2013) Multimorbidity in older adults. Epidemiol Rev 35
Fracacaro et al., (2016) An external validation of models to predict the onset of chronic kidney disease using population-based electronic health records from Salford, UK. BMC Medicine 14
Herret et al., (2015) Data Resource Profile: Clinical Practice Research Datalink (CPRD). Int J Epidemiol 44 (3)
Perera et al., (2016) Cohort profile of the South London and Maudsley NHS Foundation Trust Biomedical Research Centre (SLaM BRC) Case Register: current status and recent enhancement of an Electronic Mental Health. BMJ Open 6
Sperrin et al., (2011) Quantifying the longitudinal value of healthcare record collections for pharmacoepidemiology. AMIA Annu Symp Proc
Huopaniemi et al., (2014) Disease progression subtype discovery from longitudinal EMR data with a majority of missing values and unknown initial time points. AMIA Annu Symp Proc
Abstract no. 346 Trends in antipsychotic drug prescribing in a cohort of adults with intellectual disabilities between 2002-2004 and 2014 in Scotland
Angela Henderson, Deborah Kinnear, Jill Morrison, and Sally-Ann Cooper, University of Glasgow, Glasgow
Linda Allan, Scottish Government, Edinburgh
Colin McCowan and Kevin Ross, Robertson Centre for Biostatistics, University of Glasgow, Glasgow
Introduction Studies report high rates of prescribing of antipsychotic medications to people with intellectual disabilities, not correlating with reported rates of mental illness. This research analysed trends in the use of antipsychotic and other psychotropic drugs for adults with intellectual disabilities in Scotland, across 3 time points (T1:2002-2004, T2:2006-2008 and T3:2014).
Method This analysis of psychotropic prescribing trends opportunistically draws on two sources of data about adults (≥16yrs) with intellectual disabilities in the same Scottish health board area. Data for T1 and T2 are drawn from a large prospective cohort study (n=1201), including demographic information, assessed mental health status and prescribing information. T1 participants were recruited into a longitudinal cohort and underwent a detailed assessment and case-note review between 2002 and 2004 participants were invited to a follow-up assessment and review after 2 years (2006-2008). Data for T3 were drawn from electronically extracted primary care records, linked to the national Prescribing Information System (PIS). Individual data from T1, T2 and T3 were linked, using the unique Community Health Index (CHI) number, to identify a cohort of adults with ID for whom data was available across all 3 time periods. Data from comprehensive mental health assessments enabled some analysis of the association between rates of mental illness and psychotropic prescribing.
Results 368 individuals were linked across all 3 time periods. At T1 (2002-2004), 5.2% of people were diagnosed with psychosis, 18.2% were assessed as having problem behaviours and 63.3% had no mental health disorder. The antipsychotic prescribing rate appeared to fall from 21.2% at T1 to 19.8% at T2, however this was not confirmed when T3 data was available, indeed the overall trend saw an increase to 26.6% at T3 (2014). Over the same period, prescribing of antidepressants increased substantially, from 11.1% at T1, to 25.0% in T3.
Discussion This study found that rates of prescribing of antipsychotics are much higher than clinically assessed rates of psychotic illness in adults with intellectual disabilities. Over the course of the study these rates appear to have increased. The longitudinal design of the study is a key strength. This highlights that antipsychotic drugs are often prescribed in the absence of accepted clinical justification, frequently to manage problem behaviours. There is a lack of evidence of their efficacy and safety, and potential significant detrimental health impacts of these medications. The significant rise in the observed rate of prescribing of antidepressants may reflect trends in the number of antidepressants being prescribed in the general population, with studies reporting 7.5-10% year on year increases.
Conclusion There have been changes in the pattern of psychotropic drug prescribing over 10 years and this study shows that these drugs are still prescribed at higher than expected rates in the population with intellectual disabilities. The failure to reduce antipsychotic prescribing rates, and the significant increase in antidepressant prescribing reflects the need for concerted action to promote good prescribing practice in Scotland and underscores the need for large sample, longitudinal cohort studies to inform action to implement good practice guidelines.
Abstract no. 354 The safe share project, and forthcoming service for research with sensitive data
John Chapman, Jisc, Harwell Oxford, Didcot, UK
Introduction To address the need for research in the UK to use and share sensitive data securely and safely, Jisc, the UK’s National Research and Education Network, and leading UK universities are collaborating to provide higher assurance network connectivity over any network, including the UK’s Janet network for research and education provided by Jisc between research centres. The safe share project is working with two particular research communities that use sensitive data to pilot the infrastructure:
Biomedical researchers, e.g. through the Farr Institute and MRC’s Medical Bioinformatics initiative
Administrative data researchers, e.g. through the Administrative Data Research Network.
The project started in November 2014 and ends in March 2017.
Method The safe share project is piloting co-designed solutions with key stakeholders to provide a high volume, encrypted, VPN network between research centres. The architecture is illustrated in the following diagram:

The project has purchased, set-up, installed and tested high performance network routers at the pilot sites and linked them through a new pilot central infrastructure at the Jisc shared data centre at Slough. This infrastructure allows dispersed research groups to directly connect their data safe havens and environments securely e.g. without exposure to the rest of the institution’s network. The interconnectivity can be at difference levels of information governance and IT security to reflect the information governance requirements of groups of collaborating research centres. These have been called “service slices” for the project and those used for the pilot are:
“Farr Institute” at ISO 27001 with suitable scope, equivalent to NHS Digital Information Governance Toolkit compliance
Administrative Data Research Network policy at the government’s “official” security level
Public Services Network compliance for local authority involvement
Results The network element of the project was tested with Swansea/Cardiff and Manchester/Leeds until February 2017. The testing has indicated that the infrastructure will be effective. An early observation is that the pilot has been difficult to incorporate in a couple of the other proposed sites because they did not want to disrupt the accreditations of their existing data safe haven at this point.
Discussion Based on the testing and the support of those sites not involved in testing, a business case has been approved by Jisc for the network component of safe share to become a national service in Spring 2017. “Safe share connectivity” will be offered as a subscribed service to the UK research community, including government and commercial research partners.
This should for instance help the further development of the UK institute for health and biomedical informatics research. Given that the safe share service can work across any network, this opens up the possibility of secure data access for international partners.
Conclusion The safe share project has tested out and demonstrated support for a virtual infrastructure for research with sensitive data to further enhance the UK’s research capacity in areas such as medical, clinical, health and the social sciences.
Abstract no. 356 Understanding the utilisation of a novel interactive electronic medication safety dashboard by pharmacists and clinicians in general practice: a qualitative study
Mark Jeffries, Denham Phipps, Anthony Avery, and Evangelos Kontopantelis, NIHR Greater Manchester Primary Care Patient Safety Translational Research Centre, University of Manchester, Manchester Academic Health Sciences Centre (MAHSC), Manchester
Richard Keers, Richard Williams, and Sarah Rodgers, Centre for Pharmacoepidemiology and Drug Safety, School of Health Sciences, University of Manchester, Manchester
Niels Peek, Farr Institute, MRC Health eResearch Centre (HeRC), Division of Informatics, Imaging and Data Sciences, School of Health Sciences, Faculty of Biology, Medicine and Health, University of Manchester, Manchester
Darren Ashcroft, University of Nottingham Medical School, Nottingham
Introduction The increasing use of information technology in healthcare offers new opportunities to enhance the quality and safety of prescribing. The pharmacist-led information technology intervention for medication errors (PINCER) trial demonstrated how pharmacists working collaboratively with general practitioners to act upon electronic medication safety data reduced potentially hazardous prescribing in primary care. Based on this, we worked with relevant stakeholders to develop the Salford MedicAtion Safety dasHboard (SMASH), a novel, interactive audit and feedback intervention designed to identify instances of potentially hazardous prescribing thus facilitating optimal use in practice. The dashboard interrogates electronic health records using a set of 13 medication safety indicators, and presents the resulting information to healthcare professionals in both aggregated form and as lists of individual patients with potential safety hazards. We explored the ways in which the dashboard was used in general practice by clinical pharmacists, GPs and other GP staff.
Methods Eighteen semi-structured interviews were conducted with pharmacists and a range of practice staff from nine General Practices within Salford. Interviews were audio recorded and transcribed verbatim. Contemporaneous field notes from three non-participant observations undertaken with pharmacists whilst working with the dashboard in practices were included in the dataset. We adopted a template analysis approach that was iterative and concurrent with data collection. Emerging themes were developed into coding frameworks and discussed across the research team.
Results Pharmacists and clinicians did not see any negative outcomes in using the dashboard but highlighted a number of patient safety benefits including improving medicines management systems and prescriber education. Dashboard use varied across practices: in some only the pharmacist used the dashboard and reported back to GPs, while in others GPs took a lead or there was more collaborative work. Such role allocation and division of labour depended upon the needs and priorities of the practice and the relationships established between the pharmacist and GP staff. These contextual factors influenced ways of working with the dashboard. We identified two strategies. Reactive working focused primarily upon interventions for individual patients affected by the indicators, such as changing medications. Proactive working involved prioritising specific indicators, providing feedback and education to individual clinicians, and changing the ways the practice prescribed or monitored medicines use.
Discussion The ways in which electronic patient safety dashboard interventions are utilised in primary care may depend upon the perceptions of users as to the ease and value of using the tools organisational dynamics within practices and individual and local priorities. Consistent with previous literature we found that there were different ways of working in response to the dashboard. For some users of the dashboard its functions were not only about making changes to patient medication but developing systems and providing prescriber education within practice.
Conclusions A novel interactive electronic medication safety tool can have an impact upon patient safety and lead to enhancements in the safety of prescribing. The complex dynamics of primary care may lead to different strategies being employed in the use of the technology.
Abstract no. 358 Modelling incident antibiotic resistance in relation to patterns of antibiotic prescribing
Nitish Ramparsad, Andisheh Bakhshi, Alex McConnachie, and Sarah Barry, Robertson Centre for Biostatistics, Institute of Health & Wellbeing, University of Glasgow, Glasgow
Camilla Wiuff, William Malcolm, and Colin McCowan, National Services Scotland, Glasgow
Alistair Leonard, University of Glasgow, Glasgow
Introduction Antimicrobial (particularly antibiotic) resistance is an increasingly serious threat to global public health. In the UK, approximately 80% of antibiotic prescriptions are for community use, with the majority for treatment of urinary tract infection (UTI). However the relationship between antibiotic consumption and resistance is complex.
Method Using data from the Information Services Division (ISD) of NHS National Services Scotland, data from a 4 year period (2009–2012) was extracted and linked from the prescribing and laboratory data for bacteraemia systems. A retrospective cohort of patients who were prescribed at least one of five sentinel antibiotics (Amoxicillin, Ciprofloxacin, Co-Amoxiclav, Nitrofurantoin, Trimethoprim) was constructed. In addition to demographic characteristics, potential predictors of antibiotic resistance were based on patterns of antibiotic prescribing (e.g. long-term use, cumulative dose, treatment failure). For each patient, these predictor variables are time-varying covariates, i.e. they change throughout the follow-up period. The standard analysis approach for incident events is survival analysis (e.g. Cox regression). We divided the follow-up period into fixed, distinct, time intervals, to allow for a simplified analysis via logistic regression, with the outcome being the occurrence of an event during the time interval, and predictors being based on each patient’s status at the start of the interval.
Results 1,093,227 patients aged 16-100 were include in the cohort. The mean age at first antibiotic use was 51.8 (SD 20.6) years with 71.6% female. 200,759 (18.4%) patients had at least one treatment failure (defined as receiving two classes of antibiotic within 60 days) and 85,036 (7.8%) were long term users (defined as receiving at least 6 prescriptions within a 12 month period). 7,485 patients had a blood borne E. Coli test for resistance, of whom 5,327 (71.2%) tested positive for resistance. Long term users accounted for 1,632 (21.8%) of those tested for blood borne E. Coli and 1,313 (80.5%) tested resistant. 2,319 (31.0%) experienced at least one treatment failure, and 1,765 (76.1%) tested resistant to blood borne E. Coli. Multivariable analysis of incident antibiotic resistance is ongoing.
Discussion The presence of many time varying covariates requires complex data manipulation prior to analysis, with an additional data record added to the analysis dataset for each change in a covariate. For very large datasets, this could easily become computationally intractable. The use of logistic regression over fixed time periods limits the extent of data “inflation” and may allow statistical modelling of complex associations within large datasets.
Conclusion Results from this study may lead to better understanding of the implications of current prescribing practices, and may help government bodies in their policy making.
Abstract no. 359 Utilising identifier error variation in linkage of large administrative data sources
Katie Harron, London School of Hygiene and Tropical Medicine, London
Gareth Hagger-Johnson, University College London, London
Ruth Gilbert and Harvey Goldstein, University of Bristol, Bristol
Introduction Linkage of administrative data sources often relies on probabilistic methods using a set of common identifiers (e.g. sex, date of birth, postcode). Variation in data quality on an individual or organisational level (e.g. by hospital) can result in clustering of identifier errors, violating the assumption of independence between identifiers required for traditional probabilistic match weight estimation. This potentially introduces selection bias to the resulting linked dataset. We aimed to measure variation in identifier error rates in a large English administrative data source (Hospital Episode Statistics HES) and to incorporate this information into match weight calculation.
Methods We used 30,000 randomly selected HES hospital admissions records of patients aged 0-1, 5-6 and 18-19 years, for 2011/2012, linked via NHS number with data from the Personal Demographic Service (PDS our gold-standard). We calculated identifier error rates for sex, date of birth and postcode and used multi-level logistic regression to investigate associations with individual-level attributes (age, ethnicity, and gender) and organisational variation. We then derived: i) weights incorporating dependence between identifiers, ii) attribute-specific weights (varying by age, ethnicity and gender), and iii) organisationspecific weights (blocking by hospital). Estimated readmission rates using each set of weights were compared with traditional match weights, using a simulation study.
Results Identifier errors (where values disagreed in linked HES-PDS records) or missing values were found in 0.11% of records for sex and date of birth and in 53% of records for postcode. Identifier error rates differed significantly by age, ethnicity and sex (p<0.0005). Errors were less frequent in males, in 5-6 year olds and 18-19 year olds compared with infants, and were lowest for Asian ethnic groups. A simulation study demonstrated that bias was highest when errors in identifiers were non-random: readmission rates were overestimated by 21% using traditional weights. Attribute- and organisational-specific weights reduced this bias compared with weights estimated using traditional probabilistic matching algorithms (3% bias using attribute-specific weights, 0.1% using organisational-specific weights).
Discussion We provide empirical evidence on variation in rates of identifier error in a widely-used administrative data source and propose a new method for deriving match weights that incorporates additional data attributes.
Conclusion Our results demonstrate that incorporating information on variation by individual-characteristics can help to reduce bias due to linkage error.
Abstract no. 368 Results from a linkage consent campaign: do respondents differ from non-respondents and do consenters differ from non-consenters?
Leigh Johnson, Andy Boyd, Rosie Cornish, and John Macleod, University of Bristol, Bristol
Introduction Prospective observational studies are an important source of information on possible causal influences on health and targets for interventions. However, such studies typically face problems of attrition and non-response, which can result in bias. This issue can be partly addressed by obtaining information through linkage to routine data sources.
Unless exemption from an appropriate governing body has been granted, current legislation requires that researchers obtain explicit consent in order to access sensitive identifiable records on an individual. Seeking such consent can be problematic and further bias may be introduced if there is a high level of non-response to consent requests or high levels of dissent to linkage. Previous research has shown that those who consent are more likely to be white, female and socio-economically advantaged, although these findings have not been universal.
Methods The Avon Longitudinal Study of Parents and Children (ALSPAC) is a prospective study of children born in the early 1990s to ∼15,000 pregnant women living in and around the city of Bristol, UK. Parental consent was mandatory until the children were aged 16. When the children reached legal adulthood (age 18), ALSPAC conducted a postal consent campaign to formally re-enrol the children into the study and to ask for consent to link to their health and administrative records. An information pack was sent, summarising ALSPAC’s research aims, data collection and sharing methods, and the risks and benefits of linkage to routine records. The consent request was structured on an opt-out basis, although we stated that our preference – on the basis of maximising clarity - was for an explicit consent decision to be provided via an included consent form.
Results In total, a consent pack (information materials and consent form) was mailed to 13,735 participants 4,689 (34%) returned a completed consent form. Of these, 255 (2%) did not want to continue taking part in ALSPAC thus, the remaining 4,434 (32% of the original 13,735) provided a consent response to the various linkages (health, school, police, further education, higher education, earnings, employment and benefits data). Those who returned a consent form were more likely to be female (41% of females responded compared to 27% of males), white (38% compared to 30% of non-whites), and come from more socio-economically advantaged backgrounds (56% among those whose mothers were educated to degree level or higher compared to 23% among those with CSE or lower; p<0.001 for all comparisons). Consent rates for linkage to external datasets ranged from 87% for earnings and employment data to over 97% for school records. Predictors of consent varied. Detailed results for both response and consent rates will be presented.
Discussion & Conclusion Although consent to data linkage was high among those who responded, almost two-thirds of those contacted did not respond. Our results indicate that linkages relying on explicit consent will not overcome issues of bias due to non-response since individuals who respond to consent campaigns typically share the same socio-demographic characteristics of those participating in the study itself.
Abstract no. 369 Patient activation is associated with fewer visits to both general practice and emergency departments: a cross-sectional study of patients with long-term conditions
Isaac Barker, Adam Steventon, and Sarah Deeny, The Health Foundation, London
Introduction Patient activation refers to the knowledge, skills and confidence that a person has to manage their health. This can be assessed with a 13 question patient activation measure (PAM) questionnaire and the resulting score entered on a patient medical record. Previous research (primarily in the United States) has shown an association between PAM score and increase usage of emergency departments and secondary care but decreased use of primary care and prevention. We assessed the association between patient activation and the utilisation of primary and secondary care, for patients with long-term health conditions (LTC) registered in Islington CCG, a cosmopolitan inner London area.
Methods The PAM questionnaire was sent by post (in October 2015 and 2016) from 36 practices to 40,325 patients who had a long-term condition. Long-term conditions were those recorded during a patient’s current registration at their practice and listed as ‘active’ at the date of data extraction namely angina, asthma, cancer, chronic heart disease, chronic kidney disease, chronic obstructive pulmonary disease, dementia, diabetes, myocardial infarction, peripheral arterial disease, stroke, venous thromboembolism, hypertension, chronic and acute mental health. This was then returned by post, by each patient to their GP. We analysed the patient record of those patients with a PAM score recorded on their medical record. For each patient we summarised their numbers of general practice contacts, Accident & Emergency visits, emergency admissions, elective admissions, total inpatient admissions, and outpatient appointments between January 2013 and April 2016. For each category of health care utilisation, we fitted hierarchal regression models to estimate its association with the PAM score (ranging from 1 to 99). Models controlled for demographic (age, deprivation and sex) and clinical (type and number of co-morbidities) patient characteristics and allowed for between practice variation.
Results We obtained linked records for 10,427 patients from 34 general practices. When modelled, controlling for other factors, a 20-point increase in PAM was associated with 9.05% fewer GP contacts (95% CI, 0.89, 0.93), 20.90% fewer A&E attendances (95% CI, 0.75, 0.83) and 23.26% fewer emergency admissions (95% CI, 0.71, 0.83), per person. PAM was not significantly associated with the number of outpatient attendances, elective inpatient admissions, or total inpatient admissions.
Conclusions We found that less activated patients had higher utilisation of primary and emergency care. While we accounted for the type of LTC and number of co-morbidities, further research is needed to determine the interaction between the severity of LTC, PAM and access to care. By tailoring health care management strategies to the activation level of the patient, physicians may be able to ‘meet patients where they are’ and reduce reliance on emergency care.
Abstract no. 372 Mining and classification of a large collection of in vivo bioassay descriptions
Magdalena Zwierzyna, BenevolentAI BIO, London
John Overington, University College London, London
Introduction Testing potential drug treatments in animal models is a crucial part of preclinical drug discovery however, subsequent clinical failures of drugs show that animal studies do not always reliably inform clinical research. Many reports have drawn attention to the need for more systematic, rigorous, and objective review of preclinical data prior to exposure of a potential drug to human populations. Currently, such reviews are performed manually and involve analysis of large quantities of published articles and internal proprietary reports. Text mining methods could offer substantial aid in this time-consuming task.
Methods In this study, we use text mining to extract information from the descriptions of over 100,000 drug screening experiments (bioassays) in rats and mice. We retrieve our dataset from ChEMBL – a literature-based bioactivity database focused on preclinical drug discovery. Our novel analysis of these data uses natural language processing techniques to parse the assay descriptions and mine them for information about animal experiments: genetic strains, experimental treatments, and phenotypic readouts used in the assays. To this end, we use a text mining approach that leverages existing vocabularies and manually crafted extraction rules. To automatically organize the extracted information, we construct a semantic space of assay descriptions using a neural network language model, Word2Vec, and train several assay classifiers based on the generated semantic vector representations.
Results Using dictionary- and rule-based entity recognition methods, we identify 1,300 distinct strain names and experimental animal models in the text of assay descriptions. We then train a Word2Vec neural network with pre-processed descriptions and show that related animal models and phenotypic terms tend to cluster together in the constructed semantic space. Random forest classifiers trained with features generated by Word2Vec predict the class of drugs tested in different assays with accuracy of 0.89. In addition, we combine information mined from text with structured annotations stored in ChEMBL to investigate the patterns of usage of different animal models across a range of experiments, drug classes, and disease areas.
Discussion Due to their relatively complex and unstructured free-text format, the descriptions of in vivo assays in ChEMBL are currently understudied. We show that these short summaries can be automatically mined for relevant information including experimental factors that might influence the outcome and reproducibility of animal research. The extracted information can be further systematized using unsupervised algorithms, which identify semantic similarities between terms and phrases, allowing identification of related animal models and classification of entire assay descriptions.
Conclusion We present the first systematic analysis of in vivo drug-related bioassay descriptions in ChEMBL and the first attempt to extract and systematize mentions of spontaneous and experimental animal models from free text.
Abstract no. 375 Assessing the robustness of an electronic phenotyping algorithm using EHR data to identify episodes of acute kidney injury across health care settings
Simon Sawhney and Corri Black, Institute of Applied Health Sciences, University of Aberdeen, Aberdeen
Heather Robinson and Niels Peek, The University of Manchester, Manchester
James Chess, Institute of Nephrology, Cardiff University School of Medicine, Cardiff
Simon Fraser and Hilda Hounkpatin, Academic Unit of Primary Care and Population Sciences, Faculty of Medicine, University of Southampton, Southampton
Tim Scale, Wales Kidney Research Unit, Cardiff
Sabine van der Veer, Centre for Health Informatics, Division of Imaging, Informatics and Data Science, The University of Manchester, Manchester Academic Health Science Centre, Manchester
Introduction Phenotyping algorithms using electronic health record (EHR) data can progress service delivery and research. However, many factors may affect whether an algorithm developed in one setting can be used reliably in another, such as: variations in how datasets were produced (e.g. coding systems, measurement procedures) differences in case mix of the underlying populations the complexity of algorithm implementation. To assess the robustness of phenotyping algorithms against such factors, replicating them across data sources and healthcare regions is essential. We replicated an established electronic phenotyping algorithm for identifying and characterising episodes of acute kidney disease (AKI) in EHR data from different healthcare regions. In clinical practice, individuals who experience AKI episodes require timely and tailored follow-up. Detailed characterisation of these episodes using severity, duration, recovery and recurrence could enhance comparison and risk stratification of patients, and improve our understanding of variation in AKI epidemiology.
Methods We replicated an algorithm (Sawhney et al. Am J Kidney Dis 2016) developed in Grampian (482K adult population), using datasets from two other UK regions: Hampshire (643K) and Swansea (415.5K). We determined how the three datasets, which all consisted of linked EHR data across primary and secondary care, were produced. In our analysis, we only included people with a creatinine test. With the algorithm, we determined the incidence of AKI episodes in a certain index year, and compared results between regions. Index years were 2007 (Swansea), 2012 (Grampian) and 2014 (Hampshire).
Results Although we noted some consistencies between datasets and contexts, we also found differences in how the sets had been produced. For example, whereas Grampian had a single biochemistry department controlling lab data for the entire region, the Hampshire dataset only included creatinine values from part of the regional laboratories. The proportion of the adult population with a creatinine test was 34.9% in Hampshire, 37.8% in Grampian, and 43.9% in Swansea. Whilst the percentage of females was similar (range, 53.9 to 54.7%), the age distribution was significantly different between regions. For example, the proportion of people aged 70 years or older was 40.2% in Hampshire, 58.4% in Grampian and 63.9% in Swansea. Crude AKI incidences were significantly different between regions: 1,335 (Grampian) 1,603 (Swansea) and 1,888 (Hampshire) per year per 100K population.
Discussion We successfully replicated an existing AKI phenotyping algorithm in datasets from different regions across the UK. We found significant differences in AKI incidence across regions, potentially caused by variations in population characteristics and how the datasets were produced. As a next step, we will systematically investigate these variations as well as revisit the local implementations of the algorithm in relation to the differences in incidence we found. We will use this to increase the algorithm’s robustness, and develop guidance for its implementation in other datasets.
Conclusion Our study showed that an established electronic phenotyping algorithm to identify AKI episodes in EHR data may not be robust when replicated across data sources from different healthcare regions. Further research into reasons for the suboptimal robustness is warranted.
Abstract no. 378 An algorithm to identify end stage renal disease in the UK biobank cohort
John Nolan, Qiuli Zhang, and Cathie Sudlow, University of Edinburgh, Edinburgh
William Herrington, University of Oxford, Oxford
Introduction We aim to assess the performance of an algorithm for identifying end-stage renal disease (ESRD) cases which uses linked data from inpatient hospital admissions and death registers, and to assess the impact of including primary care data in the algorithm. UK Biobank is a prospective study of 500,000 participants, aged 40-69 years when recruited in 2006-2010 from centres across England, Scotland and Wales. Participants provided extensive questionnaire data on lifestyle, environment and medical history (with confirmation of self-reported medical conditions during a brief interview with a trained research nurse), had physical measures, and provided biological samples. Follow-up is principally through linkages to national health-related datasets, integrated from different data providers for each country and including cohort-wide data for diagnostic (ICD10) and procedural (OPCS4) coded hospital admissions and registered deaths, with follow-up to March 2014. Primary care data with Read (Version 2) coding is also currently available for a subset of the cohort in Scotland and Wales (∼48,000 participants).
Method A clinical algorithm for identifying people with ESRD in receipt of renal replacement therapy (RRT, dialysis or transplantation) using selected diagnostic and procedural codes was developed. Those who were in receipt of a kidney transplant were considered to have ESRD. To distinguish short-term dialysis for acute kidney injury from long-term dialysis for ESRD, those recorded as receiving dialysis were accepted as ESRD only if there was another diagnostic or procedural ‘indicator’ of advanced chronic kidney disease (CKD) before, or within one year of the record of dialysis. Agreement between prevalent cases of ESRD identified by the algorithm (i.e. treated ESRD recorded prior to UK Biobank recruitment) was compared to UK Biobank’s baseline questionnaire using kappa statistics.
Results The ESRD algorithm identified 787 cases of ESRD in the UK Biobank cohort, of which 451 were prevalent cases at baseline, and 336 were new cases identified during follow-up. Of the 451 prevalent cases, 384 also had one of the selected UK Biobank baseline self-reported disease codes for a history of renal disease requiring dialysis or a kidney transplant, indicating good levels of agreement (kappa statistic: 0.78, 95% confidence interval 0.75-0.80). For the subset of the UK Biobank population with primary care data, the algorithm identified 59 cases of ESRD, increasing to 63 cases with the inclusion of GP Read coding into the algorithm.
Discussion Future work is planned to extend the algorithm to include pre-RRT CKD stages. This algorithm will be validated using results from the baseline UK Biobank blood samples.
Conclusion Secondary care data provides an opportunity to identify treated ESRD, with only a small additional benefit of adding primary care data.
Abstract no. 380 Dementia case ascertainment in population-based cohort studies: lessons from the Whitehall II study
Amanda Ly, Tim Wilkinson, Christian Schnier, Cathie Sudlow, and & DPUK, Centre for Clinical Brain Sciences, University of Edinburgh, Edinburgh
Archana Singh-Manoux, Mika Kivimaki, Eric Brunner, and Aida Sanchez, UCL Research Department Of Epidemiology And Public Health, University College London, London
Background To study the causes of dementia, prospective population-based studies need to ascertain large numbers of dementia cases without substantial loss to follow-up. ‘Active follow-up’, requiring participant re-engagement for repeat assessment, is prone to loss to follow-up. ‘Passive follow-up’ through linkage to health-related datasets should avoid this, provided data are available for the entire cohort from a universal coverage healthcare system and that potential cases present for healthcare assessment. We aimed to establish: (1) the yield of dementia cases from national hospital and death data and from cognitive testing for dementia in the Whitehall II cohort (around 10,000 London-based civil servants, recruited in 1985-1987 aged 35-55 years) and (2) whether risk of dementia diagnosis in linked health-related data was higher among those who did not attend and complete cognitive testing.
Methods We analyzed Whitehall II data from waves 7 (2002-2004) and 9 (2007-2009) assessments, including surviving participants without prior recorded dementia diagnosis followed for five years after each assessment. Both waves included the Mini Mental State Examination (MMSE). Linked hospital admissions and death data were available for all participants. MMSE score <24 or a dementia diagnosis code in linked data indicated a dementia case. For each wave, we assessed numbers of dementia cases identified from linked data, MMSE or both, and compared the five year risk of dementia in linked data in those without versus with a completed MMSE.
Results In wave 7, 6269/9711 eligible participants (median age 60 years) attended and completed MMSE. 61/6269 were identified as dementia cases, 26 (42.6%) from low MMSE scores alone, 31 (50.8%) from linked data alone and 4 (6.6%) from both. 32/3442 participants without MMSE had dementia in linked data. In wave 9, 6013/9321 eligible participants (median age 65 years) completed MMSE. 92/6013 were dementia cases, 34 (37.0%) from low MMSE alone, 44 (47.8%) from linked data alone and 14 (15.2%) from both. 95/3308 without MMSE had dementia in linked data. Participants without versus those with a MMSE had a higher five year risk of dementia in linked data (wave 7: 32/3442 [0.93%] versus 35/6269 [0.56%] wave 9: 95/3308 [2.9%] versus 58/6013 [0.96%]). Using logistic regression to adjust for potential confounders, excess risk of dementia for those without a MMSE remained, although only statistically significant at wave 9 (wave 7: OR 1.41, 95% CI 0.85-2.33 wave 9: OR 2.49, 95% CI 1.76-3.53).
Discussion MMSE and linked health-related data identified largely non-overlapping dementia. MMSE assessment may have detected cases not subsequently admitted to hospital or recorded on death certificates, while linked data sources detected new cases. False positive cases may have been identified by either source. Participants without MMSE had a two to three-fold higher risk of subsequent hospitalized or fatal dementia.
Conclusion Cognitive assessments may detect dementia not identified in linked hospital and death data but participants not completing such assessments are at higher risk of dementia. In the UK, linkage to primary care data should identify dementia cases not detected in hospital and death data without requiring active follow-up.
Abstract no. 394 Using food purchase data to identify areas where people cannot afford healthy food
Deepa Jahagirdar, McGill University, Montreal
Amelie Quesnel-Vallee and David L. Buckeridge, McGill Clinical & Health Informatics, Department of Epidemiology and Biostatistics, McGill University, Montreal
Introduction People often cite high cost as a barrier to eating more fruits and vegetables, despite this food group’s association with lower levels of obesity and chronic illness. Grocery store scanner-data can help public health authorities to identify environments where healthy food is unaffordable. In an innovative use of this transaction data, we describe spatial and temporal variation in the price and affordability of fruits and vegetables.
Methods Over two million records of geo-coded grocery store transaction data were available over six years in Quebec (2008-2013) on a weekly basis from Nielsen Company. A standard basket of 25 types of fruits and 31 types of vegetables was created based on products with the highest volume and dollars sold. A smoothed monthly time series of the price per serving of each basket was constructed across 56 regions in Quebec by taking the monthly mean of prices across the years. Time series were also constructed on a yearly basis. For both the overall and yearly time series, monthly residuals for mean price (the difference between the overall mean and the regional mean) were determined for each region.
Results The overall median price per serving for the standard vegetable and fruit basket was $0.40 (range $0.29, $0.51) and $0.44 (range $0.34, $0.55), respectively. For the vegetable basket, the most expensive regions’ prices varied from $0.21 to $0.26 above the mean depending on the month. This difference from the mean was largest from November to January. For the fruit basket, the corresponding estimates varied from $0.08 to $0.15 above the mean, with the maximum difference observed in November. The yearly time series suggested that the largest spike in price relative to the mean occurred in 2010, and the range was lowest in 2013.
Discussion & Conclusion Our study demonstrates the use of high density grocery store transaction data to assess local variability in the price and affordability of fruits and vegetables. The prices for a standard basket varied across regions, with vegetables being more variable than fruits. People may be (un)able to afford eating fruits and vegetables depending on their neighbourhood, and affordability may be particularly problematic during the winter. We plan to extend this work to model mean prices and affordability within appropriate shopping distances around households, incorporating individual-level socioeconomic and consumption data, and their associations with health behaviours.
Abstract no. 406 Improving the accessibility and interpretation of advanced analytics when monitoring the quality and safety of patient outcomes
Heather Dawe, University of Leeds, Leeds
Introduction Monitoring clinical pathways and outcomes to measure and assure quality in patient care is a process that has numerous stakeholders within a healthcare economy. Multiple statistical methods have been developed to monitor clinical outcomes from different sources of healthcare data.1, 2 These methods require knowledge of statistical and data visualisation techniques to develop reports and charts for interpretation. However, the interpretation of such material is often carried out by business users without such knowledge. The objective of this research was to design and develop a prototype application that will enable technically advanced users to declare and import datasets, apply risk-adjustment methods and generate indicators. Business users will be able to interpret the results through data visualisations, thereby assisting the monitoring of the quality of clinical processes with the intention of improving patient outcomes.
Methods The user requirements of the software prototype were initially established through carrying out a series (N=8) of users and a review of relevant software products on the market. By appealing to the concepts described by Wilkinson,3 the design of data visualisations such as funnel plots4 and Variable Life Adjusted Displays (VLADs)5 were abstracted and generalized. Similar concepts were employed to facilitate the declaration of risk-adjustment methods. The established user requirements and abstraction of chart declaration and risk-adjustment methods were combined and used to design a logical model that formed the basis for the prototype.
Results A prototype was developed that enables the user to define and import datasets, to declare the risk-adjustment models used to generate indicators from the imported datasets, and to generate the charts used to present these indicators. The prototype has been tested for accuracy and consistency. Using an established evaluation framework,6 a representative user base (N=7) reviewed the software and evaluated it against similar commercially available software packages.
Discussion While the evaluations showed that the prototype proves the concept of the research and advances the technology in the applied area, they also showed that significantly more development is required to construct an application that can be used across healthcare economies.
Conclusion It is possible to produce analytics software that produces intelligence that is entirely configured by the analyst and/or pre-configured for wider business use, bridging the gap between the analyst and business user, facilitating the wider use of advanced analytics in health.
References
Iezzoni, L.I. ed., 1997. Risk adjustment for measuring healthcare outcomes. Health Administration Press.
Mohammed, M.A. et al., 2001. Bristol, shipman, and clinical governance: Shewhartʼs forgotten lessons. Lancet, 357(9254), p.463-467.
Wilkinson, L., 2006. The grammar of graphics. Springer Science & Business Media.
Spiegelhalter, D.J., 2005. Funnel plots for comparing institutional performance. Statistics in medicine, 24(8), pp.1185-1202.
Sherlaw-Johnson, C., 2005. A method for detecting runs of good and bad clinical outcomes on variable life-adjusted display (VLAD) charts. Health care management science, 8(1), pp.61-65.
ISO 9241-10:2006, Ergonomics of human-system interaction – Part 110: Dialogue Principles.
Abstract no. 415 Exploring the gap between mHealth app design practices and knowledge derived from scientific research
Victor Panteleev, Linda Peute, and Gaby Anne Wildenbos, Academic Medical Center, University of Amsterdam, Amsterdam, The Netherlands
Introduction The mobile health (mHealth) market is expanding; there were over 165.000 mHealth apps available on the market in 2015, and iOS apps increased by 106% compared to 2013. Safety, usability, and user acceptance of mHealth apps advance if clinical design guidelines are adhered to during their design. Yet, it is unclear whether mHealth app designers use and adhere to design guidelines that have a clinical focus on usability (e.g. Health Care Information and Systems Society (HIMSS) mHealth guidelines). The objective of this study is therefore to explore the usage and willingness of use of clinical design guidelines in mHealth app developers, to assess how they take safety and usability aspects into account during mHealth app design.
Methods In a pilot study, Dutch mHealth app designers (n=4) were asked to complete a semi-structured questionnaire with six open-ended questions. The questionnaire contained questions regarding guideline usage and acceptance of clinical design guidelines.
Results Two app designers were instructed by their employers to use design guidelines. Three respondents were free to use any guidelines. One respondent had to use guidelines provided to them. Guidelines used were: Apple iOS (n=4) and Android (n=2) Human Interface Guidelines, and UI Guidelines for Windows Mobile (n=1). No respondents used HIMSS (or other) design guidelines. Three respondents surmised there exists a need for clinical design guidelines for specific patient populations.
Discussion During mHealth app design, designers used standard design guidelines (iOS, Android, Windows Mobile); clinical design guidelines were not used. Possible reasons for non-usage of such guidelines are that they are too abstract to apply, too extensive to use due to time limitations, or due to a lack of knowledge on their existence by designers or employers. Considering that three designers were free to choose any guideline, it is likely that they were unaware of the existence of clinical design guidelines. This could be explained by the tendency of these types of guidelines to be published in sources generally unexplored by designers (e.g. scientific journals).
This pilot study was designed to explore if there is a gap between the practice of mHealth app design, and knowledge derived from scientific literature regarding optimal mHealth app design, and to determine the feasibility of further research. This gap exists in this study, and to bridge it, more extensive research on the practical usage of clinical design guidelines will be necessary, especially because, to our knowledge, there are few to no publications on this topic. Usage of recently developed guidelines for mHealth app designers by the Federal Trade Commission and the European Commission should be researched also.
Conclusion Adherence to clinical design guidelines is important for the safety and usability of mHealth apps. mHealth app designers seem unacquainted with clinical design guidelines, but often show a willingness and need to use them. To bridge the gap in knowledge on safety and usability of mHealth app design gained by scientific research and the actual practice of designing mHealth apps, designers should be provided with simple to use, yet effective clinical design guidelines.
Abstract no. 424 National therapeutic indicators for Scotland - a retrospective analysis (NTIS – RA)
Sean MacBride-Stewart and Bruce Guthrie, University of Dundee, Dundee
Charis Marwick, University of Dundee, Dundee
Simon Hurding, The Scottish Government, Edinburgh
Introduction National Therapeutic Indicators (NTIs) are primary care prescribing measures for the General Practitioner (GP) practices across all of Scotland. They were first published in 2012 covering 10 therapeutic topics to support medicines management and quality improvement to enhance work already embedded within Scotland Health Boards (HBs). NTIs are built using a national administrative database of prescriptions dispensed in community pharmacies creating comparative feedback at various organisational levels (for example GP practices within HBs and HBs within Scotland). In the first year, the Scottish Quality Prescribing Initiative (SQPI) provided additional funding to GP practices (approximately £800 for an average sized practice) to achieve specific targeted prescribing changes in two of the 12 NTIs.
Method Six of the 12 original NTIs were purposively selected for in-depth evaluation based on the perceived clinical:cost benefits of each (low:high n=1, medium:high n=2, high:medium n=1, high:low n=1, medium:medium n=1). Initial analysis used segmented regression analysis of interrupted time series data to examine the hypothesis that NTI and NTI plus SQPI introduction and cessation (if applicable) would be associated with a change in prescribing other known interventions such as regulatory risk communications were also modelled. Subsequent analysis used Join Point Analysis (JPA) to identify any changes in prescribing trend in the data (as opposed to pre-specifying the intervention time). Variation in impact by Health Board was explored.
Results Interrupted time series analysis (ITSA) of the quinine NTI (medium clinical and cost benefits) for all Scotland (figure 1) identified significant decreases in prescribing following a national drug safety warning in June 2010. A greater decrease was seen following the introduction of the NTI but this waned once the NTI finished. The estimated relative decrease in prescribing following NTI introduction was 27.2% (95% CI 18.8% to 35.5%) at 12 months and 22.7% (95% CI 14.0% to 31.5%) at 24 months. The reduction was larger among GP practices who chose quinine as an SQPI and so were financially incentivised to respond (figure 2) 57.2% (95% CI 46.5% to 68.0%) at 12 months and 50.5% (42.1% to 58.8%) at 24 months. JPA identified that quinine prescribing trends decreased in all health boards following the national drug safety warning and prior to the NTI start, but with considerable variation in the timing and size of this decrease. In 9 of the 14 Health Boards additional decreases were seen after the NTI introduction. Summary results for the other five NTIs will also be presented.

Quinine ITSA Scotland

Quinine ITSA for SQPI and nonSQPI GP practices
Discussion At Scotland-level, there was evidence that NTI introduction led to a reduction in the targeted prescribing, which was greater in those GP practice incentivised to act on this. JPA shows that there is considerable variation in impact at Board level depending on whether and when they responded to the regulatory risk communication. We conclude that ‘national initiatives’, such as risk communications and NTIs are effective but are mediated by local action, and we need to understand better how to influence this.
Abstract no. 427 Distributed ledgers and smart contracts for controlling data sharing in healthcare: a proof of concept implementation
John Ainsworth and James Cunningham, The Farr Institute, Division of Informatics, Imaging and Data Sciences, University of Manchester, UK
Introduction There is a gap between the ideal needs of the research community and the ethico-legal restrictions on the use of personal healthcare data. On the one hand the research community would want unfettered access to data, on the other it is the legal responsibility of data owners to guarantee the privacy and confidentiality of the patients. The best way of achieving and maintaining a balance between trust, security and relative openness is an open question the common approach is to use a Trusted Third Party, but suffers from the problem of establishing mutual trust, does not scale and its operations can be opaque. The technologies underlying cryptocurrencies - the blockchain - tackles the exact same problems that are faced in the world of medical data, namely the decentralisation of trust, the use encryption technologies and the integrity of series of transactions1. Newer blockchain implementations also bring with them the ability to execute arbitrary code across such decentralised platforms.
Method A proof-of-concept implementation was to be developed using distributed ledger technology to demonstrate four key concepts. The first was to allow patients to grant access by research organisations to their medical records for research. The second was to allow research organisations to notarise research proposals and push proposal to patients asking for granting of rights to data. The third was to allow existing data controllers to act on behalf of patients in terms of granting access, thus simplify key management. Finally, to allow auditing of access requests and outcomes via transaction recorded in the distributed ledger, including allowing patients to verify when their data has been accessed and for what purpose.
Results A private instantiation of an Ethereum2 based blockchain was deployed and smart contracts were used to implement personal data sharing preferences. The smart contracts were written in the Solidity3 language and deployed to the blockchain. A web-based user interface was developed that enabled the participating actors to read and write from the underlying blockchain.
Discussion This solution demonstrates that we can eliminate the requirement for trusted third parties to enforce and manage data sharing in healthcare using a distributed ledger. Key management is always complex and remains an issue for widespread deployment, though delegation may help here. The integration of a distributed ledger solution with the “real-world” of electronic health record systems or the role that the blockchain could play in data linkage or federation of systems remains to be explored. Future work must also investigate the addition of rudimentary ‘payment’ infrastructure such as ‘proof of hosting’ or as community oriented payment for data use system.
Conclusion Whilst this prototype demonstrates the feasibility of creating, matching and enforcing data sharing agreements using smart contracts deployed on to a blockchain, there remains much further research to do before a production system could be deployed at scale.
References
Gretton, C. Honeyman, M. “The digital revolution: eight technologies that will change health and care”. (https://www.kingsfund.org.uk/publications/articles/eight-technologies-will-change-health-and-care)
Ethereum (https://ethereum.org/)
Solidity (https://solidity.readthedocs.io/en/develop/index.html)
Abstract no. 436 Community reports to capture older people’s views on health data
Joanne Taylor, Kate Holmes, and Sabine van der Veer, Farr Institute for Health Informatics Research, University of Manchester
Tricia Tay, Central Manchester University Hospitals NS Foundation Trust, Manchester
Lamiece Hassan, School of Medicine, University of Manchester, Manchester
Introduction Using technology to monitor health in the community has the potential to support older people with staying well and independent. Developing solutions that serve this population requires insight into older people’s views on health data, and how it could help them be in control of their wellbeing and care. Therefore, we undertook a citizen engagement project that aimed to capture older people’s view on health data through community reports.
Methods We trained a total of eighteen older people (aged ≥55 years) in two Greater-Manchester areas to become Community Reporters. Community reporting is a citizen engagement method that enables people to share personal stories –either their own or by interviewing others– on a topic by creating and sharing video recordings. We designed a community reporter training around the topic of ‘Health Data’ in collaboration with community workers and older citizens. Over a 6-week period, participants learned how to create, edit and upload their community reports. We helped them to become familiar with the Health Data topic by briefing them during the first session, allowing them to test an activity tracker themselves, and organising interviews with others who tested an activity tracker (i.e. participants in local senior exercise classes). All community reports resulting from the training were uploaded onto the international Community Reporters website (https://communityreporter.net tagged as #datasaveslives). Two members of our team independently viewed each report and assigned labels to characterise its content. Through discussion of the labels, they then identified the most prominent themes arising from the reports. Project updates were posted on a dedicated webpage (www.herc.ac.uk/research_project/community-reporters).
Results All participants created a community report, despite some of them having no or limited experience with technology at the start of the training. From the analysis, the following motivators emerged for using health data: an intrinsic interest in personal health data inform communication with healthcare professionals perceiving devices, such as an activity tracker, to reflect a positive attitude towards personal health. Trepidation related to technology was also a common theme, with many participants highlighting the need for dedicated support for using health data in the future. Setting targets for physical activity was controversial, triggering lively discussion around issues such as: unrealistic expectations, unwanted interference in daily life, and effect on health behaviour. There was a clear enthusiasm to engage with health data research, for which the main motivator seemed to be altruism.
Discussion We used community reporting as a novel method to explore older people’s view on health data. It not only allowed our participants to express their views, but also equipped them with the skills to use technology and create videos to tell their stories. Additionally, we created a strong community network, which will facilitate engagement of older people in future research.
Conclusion Although some may need support, older people are motivated and able to use health data for their own benefit, and are willing to engage in health data research.
Abstract no. 439 The effect of improved identifiers on linkage of electronic health data for neonatal bloodstream infection surveillance
Caroline Fraser and Ruth Gilbert, University College London, London
Berit Muller-Pebody, Public Health England, London
Katie Harron, London School of Hygiene and Tropical Medicine, London
Introduction Linkage between data from bloodstream infection (BSI) surveillance by Public Health England to admissions to neonatal units (NNU) enables risk-adjusted analyses of rates of BSI. Linkage is deterministic when it relies on exact matches and probabilistic when probabilities are used to determine links. As completeness and quality of patient identifiers used for linkage improve, probabilistic linkage methods may have limited benefit. We aimed to determine whether more links could be identified with the use of probabilistic linkage in the presence of improved identifiers, or whether deterministic linkage alone was sufficient to achieve a high rate of linkage.
Methods Data was extracted from Public Health England’s Second Generation Surveillance System (SGSS) of positive isolates of bacteria or fungi from blood and cerebral spinal fluid in babies aged 0-12 months in 2010 to 2015. Data on admissions to NNUs for singleton births was extracted from the Neonatal Research Database (NNRD) and linked to infection episodes in SGSS. We used deterministic linkage to classify records with the same NHS number in each dataset as links. Probabilistic linkage compared records in NNRD and SGSS, and assigned each pair of records a probability that they belonged to the same baby based on agreement on the identifiers: postcode prefix, postcode suffix, date of birth, sex and hospital. To reduce the number of comparison pairs, blocking on prefix, suffix and date of birth was used so only pairs that agreed on at least one of these were included. Classification as links required the specimen date to be between the admission date and two days after NNU discharge.
Results Completeness of NHS number was 94% in NNRD across all years but in SGSS data improved from 69% (3,554/5,121) in 2010 to 85% (4,139/4,861) in 2015. The proportion of babies in NNU with at least one infection episode was 1.9% (8,040/430,383) using deterministic linkage but 2.8% (12,043/430,383) using probabilistic linkage. The proportion of links (probabilistic plus deterministic) found using deterministic linkage increased from 52% (971/1,875) in 2010 to 73% (1,580/2,173) in 2015.
Discussion Over a quarter of links identified were not found by deterministic linkage using NHS number alone, resulting in underestimation of the rate of infection. Probabilistic linkage substantially increased linkage, even as the completeness of identifiers improved. Reliance on deterministic linkage can result in biased effects and when non-linkage is assumed to indicate the absence of an event, underestimation of prevalence rates due to missed matches.
Conclusion Although identifier completeness and quality is increasing, probabilistic linkage still has a role to play in achieving high linkage and therefore reducing bias in analyses of the linked data. Evaluation of linkage quality is needed to quantify linkage error and inform analyses of the linked dataset.
Abstract no. 443 A translational research infrastructure to support clinical audit and research utilising clinical and omics data
Anastassia Spiridou, Bolaji Coker, and Paramit Chowdhury, NIHR Biomedical Research Centre at Guy’s and St Thomas’ NHS Foundation Trust and King’s College London, London
Jonathan C. Smith, Stevo Durbaba, and Sadiq Gearay, Guy’s and St Thomas’ NHS Foundation Trust, London
Syed Hasan, Primary Care & Public Health Sciences, King’s College London, London
NIHR Health Informatics Collaborative, Department of Medical & Molecular Genetics, King’s College London, London
Tim Hubbard and Graham Lord Maria Hernandez-Fuentes, King’s College London, London
Introduction Harnessing the widespread patient data collected across the UK National Health System (NHS) would provide a wealth of information to improve patient care beyond that possible from analysis of national registry data alone. This requires suitable technical and governance infrastructure for efficient data extraction, integration and analysis. The challenge is ensuring high coverage, granularity and quality of data, automation and clinical involvement to create valuable datasets for audits and research. We developed a local infrastructure as part of the NIHR Heath Informatics Collaborative (NIHR-HIC) and other programmes.
Methods We extract clinical data from a number of systems composing the electronic patient records. We collect national registry datasets, patient level primary care data and air pollution data. We obtain omics data from existing studies. The core infrastructure is based on SQL Server Integration Services. We developed software components for accurate patient matching, interpretation of unstructured information and data cleansing before import into a data warehouse, using master data services, data quality services and natural language processing (NLP). Anonymised data are loaded as studies into an enhanced tranSMART. We use metrics to track data completeness for exemplar studies and engage with clinicians to review data quality.
Results To date, we have collected high granularity and quality data across clinical areas. Data completeness ranges between 60% and 97%. The renal transplantation theme defined 250 attributes and collected data currently totalling 7,546 transplants. Genotyping, gene expression and other omics data were obtained from the GRAFT, WTCCC3 and KALIBRE studies that total ∼3,000 donor recipients pairs, and the overlap with HIC patients was assessed. NLP of 4,398 renal biopsy text reports extracted diagnosis of recurrent disease subtypes, which will be evaluated against a subset of manually assessed biopsies. Other clinical areas include Acute Coronary Syndromes (52,693 GSTFT patients, 150 attributes), Critical Care (8,573 GSTFT patients, 260 attributes), five Cancer types and Hepatitis. Pseudonymised primary care data for ∼360,000 Lambeth patients are hosted at GSTFT. Data have been used to inform patient care planning, health needs and in research. We linked air pollution and stroke data from south London and investigated associations between particulate matter and risk of stroke subtypes.
Discussion The developed infrastructure allows data from local and national sources to be linked, cleansed and pseudonymised before being loaded to a datastore. NLP of biopsy reports extracted information on patient outcomes that would not have been possible to do manually. Metrics helped improve data quality. Anonymization before data sharing and analysis ensured good information governance. Transplantation data were analysed for audits informing clinicians on graft function, survival, rejection rates, and cardiovascular outcomes. We are carrying out an exemplar study looking at recurrent disease incidence in transplanted kidneys and the clinical and genetic factors that influence its development.
Conclusion The use of the infrastructure in clinical audits demonstrates the value of re-using NHS patient data to enable service and data quality improvements, enhance our understanding, and perform potentially novel research in the UK, as planned in the exemplar studies, to ultimately benefit patients.
Abstract no. 457 Real-time research and surveillance in companion animals integrating electronic health records to provide One Health Informatics messaging and feedback loops to practice
Alan Radford, Phillip Jones, and Fernando Vizcaino, Institute of Infection and Global Health, University of Liverpool, Liverpool
PJ Noble, Institute of Veterinary Science, University of Liverpool, Liverpool
Introduction According to estimates, there are 11.6 million dogs and 10.1 million cats kept as pets in the UK, with 30% and 23% of households owning a dog and cat respectively. These animals suffer a wide range of important diseases that impact not just on their own welfare but that of their owners. Despite the size of these populations, they have historically developed in the absence of coordinated surveillance, likely reflecting, at least in part, a relative absence of notifiable / reportable diseases in these populations, leading to a similar lack of momentum at government level to instigate national surveillance programmes as exist more typically for farmed species. We will describe a globally unique health informatics network in small companion animals that provides new opportunities for Health informatics research.
Methods The Small Animal Veterinary Surveillance NETwork (SAVSNET) has assembled a strong coalition of collaborators and data providers allowing the collection of real-time electronic health data from veterinary diagnostic laboratories (∼80,000 test results/day) and a sentinel network of over 450 veterinary clinics (∼5000 EHRs/day) across the UK. From veterinary practice, each electronic health record (EHR) contains the owner’s postcode and a range of animal data including age, species, breed, gender, treatments and the clinical free text. At the end of each consultation, a compulsory syndrome code is added by the attending practitioner. In addition, a more detailed questionnaire is randomly applied to approximately 10% of animals. From laboratories, each test result is accompanied by the practitioner postcode as a surrogate of the owner / animal location.
Results In total, EHRs are now available for almost 2,000,000 consultations (approximately 70% from dogs, 26% cats, 1% rabbits, 2% other species). Compared to their carnivore cousins, cats are generally older, more likely to be non-pedigree and more likely to be neutered. Key areas of current research include antimicrobial resistance mapping, description of antibacterial prescription, as well as real-time outbreak monitoring in both animal-only and “one health” settings, notably gastroenteritis. Using text mining approaches, we are unlocking the research value previously hidden in the clinical narrative of each EHR, and pointing to a future that is less reliant on practitioner coding. For example, by using often incidental reference in clinical narratives to ticks observed on animals, retrieved by text mining, we can now generate temporal and spatial maps of tick activity across the UK. Such data could be used to inform both animal and human health. Through the owner postcode, we are linking EHRs to other data sources and understanding the impact of climate and owner predicted deprivation on disease and treatment.
Discussion & Conclusions Linking equivalent animal and human health data together represents a new opportunity to promote a truly One Health Informatics paradigm. As well as research and surveillance outputs, SAVSNET has created innovative and novel feedback loops that provide bespoke results to data providers, increasingly in real-time. This allows for the first time practitioners to benchmark their own data to other anonymous practices in the network, with key features including antibacterial prescription and syndrome mapping.
Abstract no. 459 An automated technique for assessing inpatient administrative health data quality – development and validation
Mingkai Peng, Hude Quan, and Tyler Williamson, University of Calgary, Calgary
Introduction Data quality assessment is one of the most challenging problems for any researches using administrative health data and electronic medical records. We explored whether association rules can be used to assess data quality in coded inpatient administrative health data.
Methods We extracted 26378 and 26665 records at the age group of 55 to 65 in 2013 and 2014 respectively, from five hospitals of hospital discharge abstract database (DAD), Alberta, Canada. We applied the association rule mining on the 2013 DAD to extract the rules with support ≥ 0.0019 and confidence ≥ 0.5. We applied the association rules on six versions of 2014 DAD with different percentages of code deletion for data quality assessment.
Results Association rules capture various associations of diagnosis codes in the data. Association rules can correctly rank the DAD records with different levels of completeness across hospitals. For datasets with similar size but poorer data quality, more data quality rules are violated and a larger discrepancy is observed between calculated and expected confidence in data quality rules.
Conclusion The association rule mining offers a flexible, systematic, scalable, and cost-effective way to check data quality, especially for the assessment of consistency and completeness of the data.
Abstract no. 464 A study investigating the use of routinely collected health data to identify current treatment pathways among people with age-related hearing loss
H E R Evans, evidENT, The Ear Institute, UCL and Farr Institute UCL, London
Sergi Costafreda Gonzalez, and Gill Livingston, UCL Division of Psychiatry, London
Spiros Denaxas, Farr Institute of Health Informatics Research, Institute of Health Informatics, University College London, London
Andrew Hayward, University College London, London
Anne Schilder, evidENT, The Ear Insitute, UCL, London
Hearing is key to our ability to communicate and function in the society. Hearing loss therefore affects people socially, emotionally and physically. Studies have estimated that over 10 million people UK suffer from hearing loss costing the UK economy £30 billion a year. The most common form of hearing loss is age related hearing loss and this has been linked to dementia. With a population ageing the impact of hearing loss is set to increase.
The economic costs estimated for the NHS are based on the British Household Panel Survey is small, cross-sectional and only includes cost to primary care and not secondary care costs. We will use longitudinal, linked big data from GPs and hospital records to investigate the existing care pathways, by exploring how, within the NHS, hearing loss is diagnosed and managed how often hearing tests are performed, hearing loss diagnoses made, and hearing aid(s) provided and their associated cost and patient benefit.
This research is vital for future research into understanding current outcomes for people with hearing loss and subsequently, inform strategies to treat, manage and prevent hearing loss to enhance healthy ageing.
This study has been approved by the Independent Scientific Advisory Board (ISAC) protocol number 16_185 and has been funded by Action on Hearing Loss. Our findings will be forthcoming.
Section 2: Poster Abstracts
Abstract no. 7 How to teach health IT evaluation: recommendations for health IT evaluation courses
Elske Ammenwerth, UMIT - Private Universität für Gesundheitswissenschaften, Med. Informatik und Technik Tirol, Hall in Tirol
Nicolette de Keizer, Academic Medical Center, Amsterdam
Jytte Brender, Aalborg University, Aalborg
Catherine Craven, University of Missouri, Columbia
Eric Eisenstein, Duke University Medical Center, Durham
Andrew Georgiou, Macquarie University, Sydney
Saif Khairat, University of North Carolina-Chapel Hill, Chapel Hill
Farah Magrabi, Australian Institute for Health Innovation, Macquarie University, Sydney
Pirkko Nykänen, University of Tampere, School of Information Sciences, Tampere
Paula Otero, Hospital Italiano de Buenos Aires, Buenos Aires
Michael Rigby, Keele University, United Kingdom
Philip Scott, University of Portsmouth, Portsmouth
Charlene Weir, University of Utah, Salt Lake City
High-quality and efficient health care seems not possible nowadays without the support of information technology (IT). To verify that appropriate benefits are forthcoming and unintended side effects of health IT are avoided, systematic evaluation studies are needed to ensure system quality and safety, as part of an evidence-based health informatics approach. To guarantee that health IT evaluation studies are conducted in accordance with appropriate scientific and professional standards, well-trained health informatics specialists are needed. The objective of this contribution is to provide recommendations for the structure, scope and content of health IT evaluation courses. The overall approach consisted of an iterative process, coordinated by the working groups on health IT evaluation of EFMI (European Federation for Health Informatics), IMIA (International Medical Informatics Association) and AMIA (American Medical Informatics Association). In a consensus-based approach with over 80 experts in health IT evaluation, the recommendations for health IT evaluation courses on the master or postgraduate level have been developed. The objectives of an evaluation course are as follows: Students should be able to plan their own (smaller) evaluation study, select and apply selected evaluation methods perform a study and report its results and be able to appraise the quality and the results of published studies. The mandatory core topics can be taught in a course of 6 ECTS (European Credit Transfer and Accumulation System) which is equivalent to 4 U.S. credit hours. The recommendations suggest that practical evaluation training is included. The recommendations then describe 15 mandatory topics and 15 optional topics for a health IT evaluation course. Follow-on activities which are desirable as part of this continuous educational development program are now: consulting a wider stakeholder group on the recommendations, validating the contents though use and review in academic practice, considering the distillation of a subset to form a module on appreciation of health IT evidence, and evaluation in generic health management programs. We invite all teachers of health IT evaluation courses to use these recommendations when designing an evaluation course, to add their course description to, and to report on their experiences. We also invite feedback on the use of the principles of this module as a means of instilling an evidence-based approach to health informatics application in wider health policy and health care delivery contexts. For further information, see https://iig.umit.at/efmi/.
Abstract no. 15 Data-driven pathogen surveillance: linking bacterial genomes with electronic-health data.
Sinead Brophy, FARR Institute (CIPHER - Swansea)Swansea University, Swansea
Guillaume Meric and Samuel Sheppard, Bath University, Bath
Muhammad Rahman, FARR Institute CIPHER (Swansea), Swansea
Introduction Infectious disease remains a major threat to global public health, exacerbated by the rapid development of bacterial resistance to antibiotics. The recent review on antimicrobial resistance calls for the development of surveillance systems to ensure health systems, doctors and researchers can make the most of ‘big data’. This work set out to pilot the development of a pathogen surveillance system through the linking of bacterial genome data with the electronic health record of the individual affected.
Methods 1,000 Campylobacter isolates from 800 people were collected through the Public Health Wales microbiology laboratories over 12 months and labelled with a sample ID number. The identifiers of the infected person (NHS number, name, DOB, address) and sample ID number were held in the Public Health laboratory. The isolates were sent to Bath University for genome sequencing. The identifiable data was sent to a trusted third part within the NHS to assign an anonymised linking field alongside the sample ID. This information was then transferred to the Secure Anonymised Information Linkage dataset to enable linkage to general practitioner and hospital records. This system then allows bacterial genome data linked to an encrypted sample ID to be linked to the patient medical records. This pilot study selected those patients who had cancer (using GP/hospital data) matched for age, gender and socio-economic status with those who had benign tumours. Their encrypted study IDs were unencrypted by the trusted third party to inform the genome sequencing laboratory which samples to genotype. This formed a nested matched case control study.
Results The pilot study identified some issues that would need resolving for the development of a larger surveillance system. For example, infection is common in new-born infants, but these infants often do not have an NHS number, correct baby name and are not registered with a GP. Thus, work is needed to track these samples through the mother if they are to be included in a surveillance system. In this pilot a larger than expected number of patients had a diagnosis of cancer. However, without the source of the sample it is not clear if the majority of samples come from cancer clinics or if this is evidence of infective trigger in the development of cancer. Thus, future work should collect the source (GP, hospital, specialist clinic) of the sample. The results of the case control analysis can be presented in the conference.
Discussion Understanding how bacteria are evolving at the genome-level and how this affects the patient can help understanding of how virulence and antibiotic resistance evolve and how they are being transmitted, help inform public health responses, such as vaccination and infection control programmes and improve the prediction of which drug treatments are most likely to be effective in managing a patient’s infection.
Conclusion This work represents the first step in developing a surveillance system which can examine prescription patterns, characteristics and disease history of the patient and observe and predict their effect on the genetic evolution of human bacterial pathogens.
Abstract no. 22 Supporting utility coefficient elicitation in a shared-decision making context
Elisa Salvi, Enea Parimbelli, Silvana Quaglini, and Lucia Sacchi, Department of Electrical, Computer and Biomedical Engineering, University of Pavia, Pavia
Introduction In shared decision making (SDM), physicians and patients cooperate to refine medical decisions considering both the available clinical evidence and the patient’s personal preferences. Patients’ preferences may be quantified as utility coefficients (UCs), indicators measuring the quality of life perceived by the subject in relation to the health conditions he/she might experience in response to the considered clinical options. To elicit UCs, we developed UceWeb,1 a web-application implementing five elicitation methods: time trade-off, daily time trade-off, standard gamble, willingness to pay, and rating scale. These elicitation methods may suffer from some bias due to specific characteristics of either the patient or the considered health condition. For example, the time trade-off (TTO) method may be inappropriate when the considered condition lasts less than one year.2 The literature suggests that these situations may lead to elicit unreliable UCs, ultimately leading to sub-optimal decisions.
Methods In this work, we propose a rule-based decision support system for targeting the choice of the elicitation method to the considered patient and health state. We formalized twelve rules on the basis of the collected literature evidence. Each rule suggests (or advises against) the use of a specific method when a defined condition is verified. Rule conditions address the patient’s characteristics (e.g. he/she is unemployed) or the health state nature (e.g. it is a short-term disease). For example, one rule advises against the TTO if the considered health state is short-term. We assigned a reliability score to each rule according to the relevance of the supporting evidence. We then implemented an engine that triggers the rules by matching the rule conditions with actual patient and health state data, evaluates the triggered rules, and provides a recommendation for each method.
Results We integrated the proposed system into the UceWeb application. To support elicitation procedures, the recommendation for each method is presented as a traffic light, whose colour summarizes whether the method is suggested or not for the current elicitation. The recommendation also provides the list of the triggered rules, complemented with its supporting evidence.
Discussion For testing purposes, we asked 50 healthy volunteers to elicit UCs for specific health states that are supposed to trigger four of the formalised rules. We are currently analysing the resulting UCs in light of the collected literature evidence. In particular, we are considering whether known unwanted effects on elicited UCs (e.g. saturation of TTO coefficients for short-term diseases) can be observed in our data.
Conclusion To our knowledge, UceWeb is the only elicitation tool providing decision support for targeting the choice of the method to the specific elicitation, facilitating SDM in clinical practice.
References
Parimbelli E, Sacchi L, Rubrichi S, Mazzanti A, Quaglini S. UceWeb: a Web-based Collaborative Tool for Collecting and Sharing Quality of Life Data. Methods Inf Med. 2014 Nov 353(6).
Boye KS, Matza LS, Feeny DH, Johnston JA, Bowman L, Jordan JB. Challenges to time trade-off utility assessment methods: when should you consider alternative approaches? Expert Review of Pharmacoeconomics & Outcomes Research. 2014 May1514(3):437–50.
Abstract no. 24 Electromagnetic interference with medical devices by high-speed power line communication
Eisuke Hanada, Saga Univerity, Graduate School of Science and Engineering, Saga
Kai Ishida, National Institute of Information and Communications Technology, Koganei
Minoru Hirose, Graduate School of Medical Science, Kitasato University, Sagamihara
Takashi Kano, Faculty of Health and Medical care, Saitama Medical University, Hidaka
Introduction High-speed power line communication (PLC) is a communication method that superimposes a signal on the alternating current that flows through a power line. HD-PLC with transmission signals translated in the range from 2 MHz to 30 MHz is mainly used in Japan. Japanese hospitals are resistant to the use of PLC because of government notification of the possibility of interference with medical devices. However, this notification is not based on experimental results or theoretical verification.
Methods The study was done to investigate if PLC would interfere with 20 medical devices in tests of conductive noise and radiated electromagnetic fields, after confirming that the electric power supply was clean. The subjects were five pieces of ultrasonic diagnostic equipment, three electrocardiographs (ECG), two patient monitors, two pulse oximeters, two respirators, and one each of the following: defibrillator, manual defibrillator, electroencephalograph (EEG), medical telemeter, infusion pump, and syringe pump.
Results We found malfunctions of only two pieces of older ultrasonic diagnosis equipment, caused by conductive noise. Superimposed noise was found on one EEG, however, it was only seen when the power line of the PLC modem was intentionally placed in contact with an electrode or terminal box. No noise would be superposed on this type of EEG when in normal use. We did not observe malfunction related to the use of PLC by any of the other tested devices.
Discussion All malfunctions were found on equipment purchased in 2005 or earlier. Equipment manufactured under IEC60601-1-2:2005 or later standards should not be affected. Over 70% of Japanese hospitals use wireless LAN systems for data communication, especially IEEE802.11 series wireless LAN or Bluetooth. The reasons include the difficulty of cable installation and the necessity of accessing the server while moving around the hospital. Additional problems we are concerned about include the possibility of lowered transmission rates and the stoppage of wireless LAN communication by signals invading from outside clinics or hospitals located in heavily populated areas, where the use of wireless LAN has widely spread to homes and businesses. In addition, many APs have been placed throughout cities for public wireless LAN. Wi-Fi routers brought into the hospital by patients are also sources of noise. This is problematic because some hospitals, for financial reasons, use outdated devices.
Conclusion Our results indicate that hospitals should carefully monitor older devices to prevent malfunction. Older devices may be problematic because many hospitals use them because of limited finances. It is also important that hospitals improve the electromagnetic environment of the rooms in which devices with weak biomedical signals are used, whether or not PLC is used.
Abstract no. 28 Motor vehicle crashes and dementia: a population-based study
Lynn Meuleners and Michelle Hobday, Curtin University, Perth
Introduction Demographic changes in the Australian population are leading to an increase in the number of older drivers. Driving is a complex task and requires numerous skills. Some cognitive aspects that are essential for driving such as memory, visual perception, attention, and judgment ability may be affected by dementia. In the early stages of dementia, the risks associated with driving with dementia may go unnoticed due to an average three-year lag between symptoms and diagnosis. This study examined the crash risk among older drivers aged 50+ in the three years prior to an index hospital admission with a diagnosis of dementia, compared to a group of older drivers without dementia.
Method A retrospective whole-population cohort study was undertaken using de-identified data from the Western Australian Data Linkage System (WADLS) from 2001 to 2013. The outcome of interest was involvement in a crash as the driver in the three years prior to a diagnosis of dementia. Logistic regression analysis was undertaken.
Results There were 1,666 (31%) individuals with an index hospital admission for dementia and 3,636 (69%) individuals without dementia who had been involved in at least one motor vehicle crash from 2001 to 2013. The results of the logistic regression analysis found the odds of a crash increased by 77% (odds ratio (OR)=1.77, 95% Confidence Interval (CI)=1.57-1.99) in the three years prior to a hospital admission for older drivers with a diagnosis of dementia, compared to a group without dementia, after adjusting for relevant confounders. Female gender was associated with reduced risk of crash (OR=0.89, 95% CI=0.83-0.95), while having at least one comorbid condition was associated with increased risk of crash (OR=1.09, 95% CI=1.02-1.18).
Discussion Hospitalisation with dementia may represent at pivotal event leading to driving cessation. This may lead to reduced driving exposure especially in risky or new situations. Driving cessation may occur earlier among women, leading to reduced crash risk.
Conclusion Based on the study results and given the increasing number of people who will be diagnosed with dementia, it is important that licensing authorities and clinicians continue to balance safety considerations with mobility needs for older drivers particularly when the early signs of dementia may manifest.
Abstract no. 37 Validation of the recording of asthma diagnosis in UK electronic health records
Francis Nissen, Ian Douglas, and Liam Smeeth, LSHTM, London
Daniel Morales, University of Dundee, Dundee
Hana Muellerova, GlaxoSmithKline, London
Jennifer Quint, Imperial College, London
Introduction The aim of this study is to validate strategies to identify asthma patients in UK electronic primary care records by determining the positive predictive value (PPV) of 8 unique pre-defined algorithms within the Clinical Practice Research Datalink (CPRD).
Methods The PPV is calculated as the number of true positives over the number of positive calls. The positive calls can be found in the database, while the true positives were determined using questionnaires sent to the general practitioners of 880 randomly selected possible asthma patients identified using 8 pre-defined algorithms. The questionnaires were reviewed by two independent experts, one respiratory physician and one general practitioner (GP), to construct a gold standard. The algorithms consist of a combination of one or more of the following: definite or possible asthma Read codes (labels assigned by experts), evidence of reversibility testing and recording of two or more prescriptions of inhaled maintenance asthma therapy, and core asthma symptoms (wheeze, breathlessness, chest tightness and cough).
Results Out of 880 questionnaires distributed, 463 were returned at the time of abstract submission. Of these, 457 were deemed usable and reviewed by two experts. The mean PPV across all of the algorithms was 72 using the study chest physician’s opinion, 71% according to the study team’s GP and 71% in the judgement of the patient’s own GP. The PPVs of the particular algorithms are calculated separately. Based on this preliminary stage of analysis, it appears that a record of definite asthma codes gives a high PPV (81%-85%). Additional conditions of reversibility testing, repeated inhaled asthma therapy, or a combination of all of these three requirements does not improve the PPV. The best PPV (86%-88%) was reached by the combination of possible asthma codes with evidence of reversibility testing and more than one prescription of inhaled maintenance asthma therapy. Algorithms based on asthma symptoms with or without evidence of reversibility testing and inhaled asthma therapy, showed lower PPVs (all less than 60%).
Conclusion This validation study aims to find strategies or algorithms to identify patients with asthma in CPRD. At this preliminary stage, using only definite asthma codes appears the most efficient approach.
Abstract no. 38 Design, construction, acquisition and targeting of resources in the domain of cognitive impairment
Dimitrios Kokkinakis, Kristina Lundholm Fors, Eva Björkner, and Arto Nordlund, University of Gothenburg, Göteborg
Introduction Cognitive and mental deterioration, such as difficulties with memory and language, are typical phenotypes for most neurodegenerative diseases including Alzheimer’s and other dementias. This paper describes the first phase of a project that aims at collecting various types of cognitive data, acquired from human subjects, both with and without cognitive impairments, in order to study relationships among linguistic and extra-linguistic observations. The project’s aim is to identify, extract, process, correlate, evaluate, and disseminate various linguistic phenotypes and measurements and thus contribute with complementary knowledge in early diagnosis, monitor progression, or predict individuals at risk.
Methods Automatic analysis of the acquired data will be used to extract various types of features for training, testing and evaluating automatic machine learning classifiers that could be used to differentiate individuals with mild symptoms of cognitive impairment from healthy, age-matched controls and identify possible indicators for the early detection of mild forms of cognitive impairment. Features will be extracted from audio recordings, the verbatim transcription of the audio signal and from eye-tracking measurements.
Results Currently we do not report concrete results since this is work in progress. Nevertheless, features will be extracted from (i) audio recordings: we use the Cookie-theft picture from the “Boston Diagnostic Aphasia Examination” which is often used to elicit speech from people with cognitive impairments and also reading aloud a short text from the “International Reading Speed Texts” collection, (ii) the manually produced verbatim transcription of the audio: during speech transcription, attention is paid to non-speech acoustic events including speech dysfluencies, filled pauses, false-starts, repetitions as well as other non-verbal vocalizations such as laughing, and (iii) from an eye-tracker: while reading, the eye movements of the participants are recorded while interest areas around each word in the text are defined by taking advantage of the fact that there are spaces between each word. The eye-tracking measurements are used for the calculation of fixations, saccades and backtracks.
Discussion We believe that combining data from three modalities could be useful, but at this point we do not provide any clinical evidence underlying these assumption since the analysis and experimentation studies are planned for year 2 of the project (2017). Therefore, at this stage, we only report a snapshot of the current stage of the work. We also intend to repeat the experiments two years after the current acquisition of data in order to assess possible changes at each level of analysis.
Conclusion We present work in progress towards the design and development of multi-modal data resources and measures (features) to be used both for evaluation of classification algorithms to be used for differentiating between people with mild cognitive problems and healthy adults, and also as benchmark data for future research in the area. Evaluation practice is a crucial step towards the development of resources and useful for enhancing progress in the field, therefore we intend to evaluate both the relevance of features, compare various machine learning algorithms and perform correlation analysis with the results of established neuropsychological, memory and cognitive tests.
Abstract no. 39 Misdiagnosis of COPD in asthma patients in the UK using the clinical practice research datalink
Francis Nissen, Ian Douglas, and Liam Smeeth, London School of Hygiene & Tropical Medicine, London
Hana Muellerova, GlaxoSmithKline, London
Daniel Morales, University of Dundee, Dundee
Jennifer Quint, Imperial College, London
Introduction This study aims to quantify the misdiagnosis of chronic obstructive pulmonary disease (COPD) in asthma patients in the UK using electronic health record databases. The specific objectives of this study are to calculate the PPV, NPV, sensitivity and specificity of a COPD diagnosis recorded by a general practitioner in patients with a confirmed asthma diagnosis. Asthma is difficult to assess in health-care database epidemiological studies as the diagnostic criteria are based on non-specific respiratory symptoms and variable expiratory airflow limitation which are often not recorded in electronic medical records. Specifically asthma in older patients can be confused with COPD.
Methods The 880 asthma patients were identified at random in the Clinical Practice Research Datalink (CPRD) using 8 different algorithms. Questionnaires (110 questionnaires per algorithm) were sent to the general practitioners with a request for asthma diagnosis confirmation to be supported by any evidence available including information on reversibility testing, other factors considered for making an asthma diagnosis, the Quality Outcomes Framework indicators, smoking status, concurrent respiratory diseases and other sources like consultant and hospital discharge letters, lung function tests and radiography results. A review of this information by a respiratory consultant aims to identify the actual cases of COPD in confirmed asthma patients. This review is used as the gold standard to calculate the PPV, NPV, sensitivity and specificity of recorded GP diagnoses of COPD in the primary care records of asthma patients.
Results 463 questionnaires have been returned at the time of abstract submission. Of these, 457 were deemed usable, and 323 asthma diagnoses were confirmed. A co-morbid COPD diagnosis made by a general practitioner in confirmed asthma patients has a sensitivity of 63.6% (28/44), a specificity of 93.9% (262/279), a PPV of 62.2% (28/45) and a NPV of 94.2% (262/278).
Conclusion In this population-based sample of asthma patients, the proportion of patients with COPD that was correctly diagnosed by a GP was 63.6%. The proportion of asthma patients correctly identified as COPD-free by their GP was 93.9%.
Abstract no. 40 Identifying key variables for inclusion in a smartphone app to support clinical care and research in patients with rheumatoid arthritis
Lynn Austin, University of Manchester, Manchester
Caroline Sanders, The University of Manchester, Manchester
Will Dixon, Arthritis Research UK Centre for Epidemiology, The University of Manchester, Manchester Academic Health Science Centre, Manchester
Introduction Treatment for patients with rheumatoid arthritis (RA) is shaped by monitoring changes in disease severity. At present, clinicians have few objective measurements of disease activity between clinic visits, even though a number of patient-reported outcomes measures (PROMs) exist. Smartphones provide a possible solution by allowing regular monitoring of disease severity between clinic visits and integration into electronic medical records. Potential benefits include better information for consultations, triaging of outpatient appointments and aiding patient self-management. Such data could also support novel research by providing temporally-rich data. The REMORA (REmote MOnitoring of Rheumatoid Arthritis) study is designing, implementing and evaluating a system of remote data collection for people with RA for health and research purposes. The project asks whether electronic collection of patient reported outcomes (ePROS) between visits can enhance care and provide a source of research data. This paper describes the process of determining ePROS of importance, and presents the dataset included in the beta-app piloted.
Methods Interviews were held with a range of stakeholders (10 RA practitioners, 12 RA researchers, 21 RA patients). Interviews determined ePROSs for inclusion, recording frequency, and the value of a free text diary. Initially, interviews were conducted with practitioners and researchers regarding their preferences. Key ePROS identified were tabulated and discussed with the PPI (patient and public involvement) group, working alongside the research team, and the table refined. Subsequently, patients were interviewed regarding their preferences and also asked to feedback on tabulated suggestions. Ultimately, components which had widespread consensus across the stakeholder groups were incorporated into the app. Components without consensus, or beyond the scope of the study, were documented with a view to incorporating them in later versions. PPI group members reviewed and commented on the suitability of the final components prior to their incorporation into the beta app.
Results All stakeholder groups wanted to capture information on changes in disease activity and impact of the disease (physically and emotionally). Practitioners and researchers wanted routine data that had been recorded consistently using existing validated tools, but saw the value of a diary for recording triggers and alleviators of disease activity. Patients mainly suggested recording notable events (such as flares) as they occurred, but could see the benefits of recording data routinely. The final dataset comprised the following:
Daily question set: Pain, difficulty with physical activities, fatigue, sleep difficulties, physical and emotional wellbeing, coping (10 point visual analogue scale), morning stiffness (7 categories)
Weekly question set: Number of tender and swollen joints (numeric value 0-28), global assessment of wellbeing (10 point visual analogue scale), employment status (yes/no response - radio button), description of flare (free text box)
Monthly question set: Health Assessment Questionnaire (HAQ) impact of disease on daily activities, including function and mobility (fixed point scales - radio button) plus free text entry box.
Conclusion Consensus on the key components of the smartphone app was achieved. These components have been incorporated into the ‘beta app’ in readiness for piloting within clinical practice.
Abstract no. 46 The multimorbidity model for care coordination by general practitioners
Anna Beukenhorst, University of Manchester, Manchester
Danielle Sent, Academic Medical Center, Universiteit van Amsterdam, Amsterdam
Georgio Mosis, RGA, Hong Kong
Introduction Multimorbid patients, suffering from two or more chronic diseases, often receive multiple disease-specific treatment plans that are likely to contain conflicting recommendations, since medical guidelines typically do not optimally account for complex multimorbid patients. General practitioners (GPs), given their role as care coordinator, are in a good position to identify and reconcile these conflicts.
Method We conducted a literature study and expert interviews to identify practical challenges of guideline-based multimorbidity management in primary and secondary care and existing solutions. Based upon the literature study and interviews, we developed a workflow model providing decision-support for GPs when treating or coordinating care for multimorbid patients.
Results Challenges of multimorbidity care mentioned in literature, were echoed by experts. For example, medical guidelines usually do not account for added complexity (cognitive decline, fall risk, malnutrition and decline in social relations) or conflicting patient preferences.
Competing demands and shifting priorities over time require prioritisation of conditions, revision of treatment plans and ensuring adequate self-management. The conventional workflow of GPs is problem-oriented, hampering a holistic approach. Existing tools for reconciliation of treatment conflicts often focus on specific subpopulations and lack applicability to the generic multimorbid patient population. Models for multimorbidity management, such as the Chronic Care Model and Ariadne principles, only provide abstract advice from an organisational perspective and are not directly applicable in clinical practice.
We therefore propose the MultiMorbidity Model (3M), a framework for CDSSs that supports GPs in delivering multimorbidity care for the comprehensive multimorbid population. It is a workflow model of five steps facilitating identification and reconciliation of various conflicts. It enables a holistic approach and provides opportunities for application of existing computerised decision support tools and shared-decision making tools. GPs take inventory of all applicable treatment recommendations (I – Select), prioritise these based on size of health effect and number of conditions affected (II – Prioritise), and personalise (III) the prioritisation by balancing burden of treatment, personal preferences and expected therapy adherence. The treatment plan is then simplified (IV) by identifying and reconciling conflicting recommendations. Finally, the treatment plan is formulated (V) in a concrete, specific and actionable way, adapted to the patient’s lifestyle and health literacy. Output of the model is an individualized treatment plan for the patient, fitting the patient’s health status, preferences and combination of diseases.
Discussion As a workflow model for multimorbidity management, the 3M provides decision-support to GPs, striking a balance between standardisation of care and personalisation of treatments. A preliminary evaluation indicated that usage of the 3M results in treatment plans with prioritised and concrete recommendations, making it a useful substitute for the usual workflow of GPs during follow-up visits for multimorbid patients. Complemented with shared-decision making tools and computerised decision support tools, 3M enables optimisation multimorbidity care.
Conclusion This is a first step towards CDSSs that facilitate care coordination for multimorbid patients. Future research should focus on further validation of the model, as well as and integration with computerised tools to fit the workflow in the limited time of GP consults.
Abstract no. 48 Capturing provenance of visual analytics in social care needs
Shen Xu, King’s College London, London
Toby Rogers, FACE Recording and Measurement System, Nottingham
Vasa Curcin, King’s College London, London
Introduction The care commissioning (assessment and planning) system currently in operation in England is configured to reduce ‘need’, where need is determined by assessment of the person’s level of impairment, degree of risk/safety, informal care/family support and so on. In order to make cost-effective decisions in social care needs, there are two ultimate questions that need to be answered: what are the classes of individuals with common care needs, and what characteristics determine those classes. Atmolytics is a visualization layer of a data warehouse for social care needs assessment that provides flexible analytic functions to support data analysis. Atmolytics provides the functionality of defining a group of service users by their characteristics as well as their assessment questions and answers. Recorded service user information will be generated lively from shared databases based on the group definition; furthermore the group definition can be further used in the report function. The report function includes 15 types of report that create visual result of group definition. While the analytics required draws on complex real-world data, it is of prime importance to assure that the decisions are transparent and made with correct assumptions. In order to provide transparency and auditability of the tool findings, we have designed a data provenance module within Atmolytics to capture the full audit trail of the data transformations, leading to better understanding of the context of data production.
Method The extended auditing/logging capacity was realized by employing PROV-DM together with provenance template, specifying the structure of data provenance to be captured. The storage solution is designed based on graph database.
Results Initial analysis confirms that capturing provenance in visual analytics should not only describe automated processes but also human actions relevant to the data and models in the system – interactive steps etc. – that are more commonly associated with usability studies. Additionally, current auditing/logging capacity in a typical visual analytics system is insufficient for tracing or representing human actions and supporting a meaningful process mining, more specific it lacks a connectivity of recorded messages. The prototype resulted graph now connects the activities of analytic process within the system. The history of a group definition can be shown as a path from graph database.
Discussion Capturing provenance in a visual analytics system such as Atmolytics is not a trivial task. Each of its subsystems relies on a separate data store, which communicates with others exclusively via a service bus architecture. Furthermore, disconnected auditing/logging functions expose different levels of events. In order to overcome these issues, we are employing provenance templates as higher-level abstractions over provenance graph data, implemented through a dedicated module that communicates with all other parts of the system. Future research plan is provenance data visualization by clustering and RDF database comparison on provenance use cases.
Conclusion We find provenance template approach to be a realistic and promising solution to improving auditing/logging capability in enterprise visual analytics software, and we are currently in the process of developing the provenance visualization tool.
Abstract no. 52 Developing a genetic analysis system for clinical purposes
Espen Skorve, Aalborg University, Department of Computer Science, Aalborg
Morten C. Eike, Tony Håndstad and Thomas Grünfeld, Oslo University Hospital, Oslo
The significance of genetic testing for clinical purposes is increasing, and with the introduction of high-throughput sequencing (HTS) techniques and tools, this development is escalating. However, utilizing the output of sequencing – regardless of techniques and tools – requires a complex, multi-stage analysis process. The genetic variants in a patient must be identified and compared to variants that have been previously encountered in other individuals and current knowledge about their clinical significance. For variants that have not been previously described or for which there is limited clinical evidence, several predictive algorithms may be deployed, depending on the particular sequence context. Hence, the advancement in sequencing techniques must be complemented by technologies that can support end users in exploiting and producing information. This paper presents a user-driven innovation project at Oslo University Hospital, Norway, aimed at developing such technologies.
User-driven innovation has been described as a pull away from the traditional technology-centered innovation strategies, towards strategies that aim at achieving a co-evolution of the technical and the social, where users play a crucial role. This development has also been characterised as a democratisation of innovation, and it is interesting to note how both European Actions and priorities (e.g. in H2020) and various national priorities around Europe (and also in other parts of the world) actively seek to stimulate user-driven innovation through financial resources. The project we report from is a result of such an initiative in Norway the Norwegian clinical genetic Analysis Platform (genAP) project was funded by the Norwegian Research Council as a user-driven innovation project in collaboration between the Department of Medical Genetics (DMG) at the Oslo University Hospital and the Department of Informatics at the University of Oslo. It ran from 2011 to 2015, as a multidisciplinary collaboration between experts of multiple domains (medical genetics, molecular biology, bio-informatics, information systems, etc.) including users and the University’s IT-department as supplier of a secure environment in which the system could run. The target system’s character as a decision support tool, embedding highly specialized knowledge from all these domains, made this composition of project participants and associates pivotal for achieving the overall aims of the project.
Being publicly funded through the National Research Council and carried out as a collaboration between researchers and users, the genAP project constitutes a particular kind of user-driven innovation. As such, it also illustrates how this configuration can meet some of the challenges associated with user-driven innovation. First, both the public funding and the contribution from researchers of competencies and skills that would otherwise be bought on the open market entails a significant cost reduction for the user organisation. This makes it more likely that innovation will actually be realised. Secondly, the diffusion of innovation is enhanced through the reporting of research results and future research based on these results. When the user network is supplemented by a research network, the number of channels for diffusion is significantly increased, increasing the potential for creating public value beyond the specific innovation context.
Abstract no. 55 Towards a clearer vocabulary for clinical knowledge representations: being more precise than “ontology”
Alan Rector, University of Manchester, Manchester
Jean Marie Rodrigues, INSERM U 1142 Paris France, Saint Priest en Jarez
Christopher Chute, Johns Hopkins University, Baltimore, MD
Introduction We suggest an alternative vocabulary for describing different types of knowledge and knowledge representation that maps conveniently onto current technologies and avoids arguments about “what is ontological.” This paper contends that the term “ontology” is being used in so many different ways that it has lost most meaning except for indicating a knowledge representation involving a hierarchy. We take as our starting point an analogy with existing paper resources. We can divide paper knowledge resources into at least four groups: dictionaries, encyclopedias, catalogue/indexes/thesauri, manuals and records.
Results We suggest avoiding the words “ontology” and “ontological” except as broad headings and instead distinguishing: 1. Axiom-Base/open world component – rather than “ontology” or “ontological”, for first-order axiomatic knowledge. 2. Generalization base/closed world component – for other kinds of knowledge that admits exceptions. 3. Knowledge organization base – for other more loosely specified information and human navigation including thesauri. 4. (Statistical) Classification – for mono-hierarchical organizations for specific purposes, usually statistical reporting, following the jointly-exhaustive-mutuallyexclusive rule. 5. Representation knowledge base – for whatever queries or other knowledge about the representation is required for the system to function. 6. Higher order knowledge base – for whatever higher order generalizations and axiomatic knowledge is relevant & feasible to represent. 7. Rule base or decision support systems. 8. Record repository – for records of individual patients for care or research.
Abstract no. 59 Comparative effectiveness of non-vitamin K antagonist oral anticoagulants and warfarin in the Scottish atrial fibrillation population: the value of real world evidence
Giorgio Ciminata, Claudia Claudia Geue, Olivia Wu, and Peter Langhorne, University of Glasgow, Glasgow
Introduction Clinical data from randomised control trials (RCTs), providing evidence on efficacy, have been used to inform economic evaluations of non-vitamin K antagonist oral anticoagulants (NOACs) in atrial fibrillation (AF). In contrast, real world data offer the advantage of providing evidence on the effectiveness of NOACs in clinical practice. However, the absence of randomisation in a real world scenario does not allow for an unbiased comparison between the treatment and the comparator. The difference in observed health outcomes between the two groups may be due to patient case mix rather than treatment effect. The aim of this study is to explore, within the comparative effectiveness framework, different methods for estimating average treatment effect (ATE), and assess whether the findings reported in RCTs are generalizable to Scottish clinical practice.
Methods Based on the review of propensity score methods and the nature of administrative data available, the matching by propensity score approach will be explored. With this method, the difference in ATE is given by the difference in outcomes between groups matched according to their propensity score. The matching will create a subsample of individuals on NOACs or Warfarin who share a similar propensity score value. The ATE for the subsample will be estimated for a cohort of patients 50 years and older, hospitalised with a known diagnosis of AF or atrial flutter. Event rates, for ischaemic stroke (IS), clinical relevant bleeding (CRB), intracranial haemorrhage (ICH) and myocardial infarction (MI), for the NOACs and Warfarin cohorts, will be compared the relative effectiveness taking into account potential confounders such as geographical differences in comorbidities and prescribing preferences will be assessed.
Results The comparative effectiveness analysis is currently underway and results will be presented at the conference.
Conclusions This work will form part of a wider economic evaluation of NOACs for the management of AF. The estimated ATE and clinical event rates will be compared against results from RCTs, and in conjunction with AF related costs will inform a cost-effectiveness model.
Abstract no. 60 Literature review of potential use errors of adrenaline auto-injection pens
Thomas Weinhold, Marzia Del Zotto, Jessica Rochat, and Christian Lovis, Geneva University Hospitals (HUG), Division of Medical Information Sciences (SIMED), Geneva
Jessica Schiro, Sylvia PELAYO, and Romaric Marcilly, University of Lille, INSERM CIC-IT 1403, CHU Lille, EA 2694, Lille
Introduction The project Useval-DM aims to establish scientific evidence of critical methodological choices for usability validations. Different variables and their influence on evaluation results are analyzed (e.g. number of participants, fidelity of the testing environment, cultural differences). In this context, three different medical devices are evaluated. One is an innovative needle-free self-injection device. To get an overview of usability-induced use errors of such devices a literature review was conducted.
Method Since there is no literature about needleless systems, due to the novelty of this technology, needle-based auto-injectors had to be considered for the review. The analysis was based on PubMed and Scopus and encompassed original studies reporting on the usability of auto-injection pens that were published in English or French from 2000 to 2016. For the research we used a building blocks approach. Three sets of different key terms (type of technology usability safety/errors) and synonyms were defined and combined with Boolean operators.
Results 1282 papers were identified, from which 310 were duplicates. The remaining 972 papers were screened for their relevance based on three iterations with an increasing degree of accuracy. First, one expert screened the titles and excluded those papers not matching the eligibility criteria. Then two reviewers checked the abstracts of the remaining documents. Finally, the remaining papers were analyzed by three experts. As a result, 24 documents, as well as 9 additional papers identified by searching references, were considered for a qualitative analysis. Each paper was examined by one expert and results from the extraction were cross-checked by the other experts. Extracted descriptions of use errors were categorized to obtain a list of known use errors for such devices. Overall, 22 categories of use errors could be identified. Examples are errors related to the storage and checking the integrity of the device before an injection (Schiff M et al. (2016) Adv Ther), problems with safety caps and in orienting the pen during an injection (Schmid M et al. (2013) Open Allergy J), as well as issues with the injection itself (e.g. injection site, duration) (Guerlain et al. (2010), Ann Allergy Asthma Immunol).
Discussion The aim of this study was to identify and classify potential use errors related to the use of a needleless auto-injection device. Since there is no literature about such devices yet, we had to widen our research to common auto-injection pens. Therefore, the results could not be transferred directly to the needleless system. Rather a triangulation with other methods and sources (e.g. incident reports databases, interviews, observations) must be made.
Conclusion Literature reviews are an indispensable source for the design and usability validation of medical devices. But for innovative products they can only deliver a brief overview of potential problems. For such devices it is essential to take into account their specific characteristics. However, even if the devices in the literature differed from our product, the reports were helpful, since it was easier to make an abstraction than to consider all possible risks independently.
Abstract no. 65 Prescriptions dispensed in the community pre- and post-cancer diagnosis in England
Katherine Henson, Victoria Coupland, and Rachael Brock, National Cancer Registration and Analysis Service, Public Health England, London
Brian Shand and Kelvin Hunter, National Cancer Registration and Analysis Service, Public Health England, Cambridge
Philip Godfrey, NHS Business Services Authority, Newcastle
Background The National Cancer Registration and Analysis Service (NCRAS) in Public Health England has, for the first time, received pseudonymised national record-level data on prescriptions dispensed in the community, as part of a partnership project with the NHS Business Services Authority (NHSBSA). This partnership will allow us to answer clinical questions that have not been possible previously. For a pilot study of this partnership, the authors aim to describe the symptom profiles of cancer patients in the time surrounding a cancer diagnosis, and the variation by cancer stage.
Method NCRAS registers all cancers that occur in people diagnosed throughout England. Prescription data is extracted from the NHS prescription payment processes managed by NHSBSA. A pseudonymisation procedure, which uses standard third-party encryption and hashing modules, was applied to the national cancer registration data and the prescription data to allow secure linkage. All malignancies, excluding non-melanoma skin cancer (NMSC) (ICD10 C00-C97 excluding C44) with a diagnosis date between January and October 2015 were included in the analysis. The prescription data sample covers the period April to July 2015. Patients were only counted for the months in which they had a prescription. The prescription date was compared to the cancer diagnosis date recorded by NCRAS to create a peri-diagnosis timeline.
Results Investigation of the most common medication groups highlighted a marked variation by cancer stage for all malignancies combined. For patients with stage 1 and 2 cancers, the most commonly prescribed medication group was lipid-regulating drugs, followed by proton pump inhibitors (PPIs). There were no marked trends over the six-month period.
Among patients with stage 3 and 4 cancers, there was a substantial upward trend over the time period surrounding the diagnosis date for opioid analgesics and enteral nutrition.
Discussion The most commonly prescribed medication groups for patients with stage 1 and 2 cancers are consistent with those frequently prescribed to older patients. The medication groups with the most marked trends for patients with stage 3 and 4 cancers appear to be associated with the effects of cancer and its treatment. The prescribing patterns are consistent with increased pain. Similarly, enteral feeding prescriptions may reflect weight loss, nausea or difficulty swallowing. Further work will extend this descriptive analysis with statistical adjustment of case mix and investigation by cancer type.
Conclusion Prescriptions data is a hugely rich source of information, and provides us with many potential new areas of research. The investigation of quality of life endpoints using symptom profiles presented here are important to patients.
Abstract no. 71 Integrating an mHealth application into the EHR ecosystem of Andalusian health public system
Alicia Martínez-García, Technological Innovation Group. Virgen del Rocío University Hospital, Seville
Rafael Ordoñez-Benavente, Group of Research and Innovation in Biomedical informatics, Institute of Biomedicine of Seville, IBiS/Virgen del Rocío University Hospital /CSIC/University of Seville, Seville
Santiago Rodríguez-Suarez, Juan Antonio Grande-Navarro, and Carlos Parra, everis Spain S.L., Seville
Sergio Barrera-Benitez, Integral Healthcare Unit, Virgen del Rocío University Hospital, Seville
Introduction The HEARTEN project aims to develop and validate a collaborative mHealth application that engages all actors related to the management of Heart Failure disease, enables the patients to achieve sustainable behaviour change regarding their adherence, and improve patients’ quality of life. As part of this project, a specific task covers the integration of this mHealth application with the Electronic Health Record Ecosystem (named Diraya) of Andalusian Health Public System (AHPS).
Method To perform this integration, three high-level integration needs have been identified: (i) Accessing HEARTEN platform from Diraya, (ii) Drug prescription in Diraya will be communicated to HEARTEN platform, (iii) Reports of information stored in HEARTEN will be retrievable in Diraya as an external report making use of the API provided by HEARTEN.
Results So far the architecture design and the functional requirements of the integration solution have been defined. This architecture is prepared to integrate HEARTEN within Diraya by making use of different mechanisms: (i) HL7 to communicate to Diraya new reports. HL7 is also used with Andalusian ePrescription (primary healthcare electronic prescription) to get information from prescribed drugs of patients that are being monitored in HEARTEN. (ii) REST API to communicate with HEARTEN platform in order to retrieve data for new reports and to include information concerning the drug prescription collected from Diraya. (iii) Web Services to extract data from the AHPS hospital healthcare electronic prescription concerning patients monitored in HEARTEN. Also, to allow the access from Diraya to HEARTEN doctor’s user interface (UI), a HTTPS gateway will be deployed to allow the connection for these systems. Finally, in order to monitor the integrations and ease and support the management of AHPS staff involved in the project, a specific multi-language dashboard application is being developed to provide reports and alerts concerning the state of the integrations. In order to orchestrate those heterogeneous communications, an integration layer will be deployed. The architecture relies on an Oracle database to store the exchanged information and customization parameters. A JEE application deployed under Apache Tomcat will support the dashboard application, where PrimeFaces provides the UI, Spring is used for business and Hibernate gives the tools for persistence. At this moment, the technical team is working to implement the solution.
Discussion The participation of clinical teams in research and innovation projects causes the use of several different informatics systems by the healthcare professionals, including the obligation of recording the same information in different systems, and a tedious management of usernames and passwords. The integration of the specific application developed in the project with the local EHR corporative services solves this problem.
Conclusion The implementation of an integration framework between HEARTEN mHealth application and Diraya achieve a more useful final solution for the doctors, avoiding spending unnecessary time by using several informatics systems, caused by duplicate information in different systems. This project has received funding from the European Union’s Horizon 2020 research and innovation programme under grant agreement No 643694, and FEDER funds.
Abstract no. 90 The eLab platform: realising reproducible collaborative analyses of harmonised data
Chris Munro, Philip Couch, Andrew Broadbent, Paul Stephenson, Stephen Lloyd, Ruth Norris, Clare Mills, John Ainsworth, and Iain Buchan, University of Manchester, Manchester
Danielle Belgrave and Adnan Custovic, Imperial College London, London
Introduction Scientific journal publications seldom capture scholarly work so that an external researcher could reproduce reported results. The growing number of platforms for sharing scholarly assets (e.g. Figshare, ReShare, and EPrints for research data) reflects this, presenting science a sizeable opportunity to reuse resources of previously funded projects to make new discoveries, especially across disciplines/ domains.
Despite the plethora of platforms and standards, barriers remain to the reuse of scholarly assets due to missing information about datasets and their analyses. Poorly curated data leads to unnecessarily duplicated efforts in reusing scholarly assets and data harmonization and analysis are often manually repeated when reusing data. We discuss a methodology for combining and harmonizing research data, supporting the capture and sharing of rich contextual information essential for correct interpretation and data re-use.
Methods Minimum Information Checklists have been applied to develop Variable Reports and Variable Report Models: the mechanism through which we incorporate data context and achieve semantic harmonization across different sources of comparable data, e.g. different birth-cohort studies. eLab communities use Variable Report Models to specify reporting requirements for variable summaries which are used when reporting data.
Research Objects have been applied alongside new distributed computing technologies in the Job Manager Module to support the reproducibility of analyses, which might be reported in publications. This includes moving code and input files to a remote resource through HTCondor, providing process statuses and moving outputs back into the eLab.
Results The HeRC eLab builds on the Alfresco Enterprise Content Management System, which provides core support for day-to-day project activities such as document management, audit history, and collaboration. We developed the Variable Bank Module which facilitates the import and export of data. Research questions can be asked across multiple datasets created by different communities. The Job Manager module works with data and computational code through Execution Research Objects which capture the process of executing analysis code on data. The eLab has been further developed and successfully used by the STELAR (Study Team for Early Life Asthma Research) consortium to harmonise data from five UK birth cohorts and the iFAAM (integrated approaches to food allergy and allergen management) EU project to harmonise data from food allergy studies.
Conclusion We have presented Variable Reports and Execution Research Objects as approaches to capturing context and provenance of data and methods and their application within the HeRC eLab. Our work distinguishes itself from existing approaches, providing:
a way to combine and pool datasets from any domain
data search, combine and export capability from multiple studies automatically, with fewer manual processes to query and deliver data extracts.
Often, data warehouses and other approaches, also extract, transform and load data, without capturing the relationships between variables–the essence of any research claim. Variable Report Models advance semantic harmonization-with no further cost for reuse after the initial investment. The use of Minimum Information Checklists with Variable Reports means that software does much of the metadata quality checking.
Abstract no. 91 Intelligent assistance services and personalized learning environments for support of knowledge and performance in interdisciplinary emergency care
Sabine Blaschke, Bjoern Sellemann, Stefanie Wache, and Stefan Roede, University Medical Center Goettingen, Interdisciplinary Emergency Care Unit, Göttingen
Michael Schmucker, Heilbronn University, GECKO Institute, Heilbronn
Carsten Ullrich, Michael Dietrich and Christoph IGEL, German Research Center for Artificial Intelligence, Educational Technology Lab, Berlin
Markus Roessler, University Medical Center Goettingen, Dept. of Anaesthesiology, Göttingen
Sabine Rey, University Medical Center Goettingen, Inst. of Medical Informatics, Göttingen
Martin Haag, Heilbronn University, GECKO-Institute, Heilbronn
Felix Walcher, University of Magdeburg, Dept. of Trauma Surgery, Magdeburg
Introduction During the past decade emergency medicine evolved to an increasing challenge for clinics of all stages of patient care due to a substantial and continuous change of medical knowledge, limits of time and health care economics as well as an enormous rise of patient cases. Thus, continuous medical education for all employees involved in the preclinical or clinical phase of emergency care represents an essential prerequisite for high quality patient-centred care to overcome these problems. However, in this special setting of rush, stress and highly intense workload, conventional learning techniques do not allow for continuous training on the job. To address this problem we developed novel learning and teaching strategies based on digital technologies for both academic and non-academic staff members within interdisciplinary emergency care departments (ED).
Methods For medical students and trainees we created a podcast and an emergency care software for simulation of emergency cases in order to prepare for the work within the ED in comparison to control groups without access to these learning tools. Acceptance, frequency of usage and effects of these techniques were assessed prior to and after the occupation within the ED by standardized questionnaires and tests. For nurses and paramedics we first assessed the information demands during all processes of emergency patient care in the preclinical and clinical phase. Based on these needs intelligent assistance services were established in cooperation with two technological partners to support daily workflow via web-based services.
Results Introduction of the podcast and the emergency care software prior to the start within the ED resulted in a significant improvement of skills and expert knowledge for both medical students and trainees in comparison to the control groups (p< 0.002). Both innovative tools were widely accepted and frequently used. Analysis of processes within the preclinical and clinical phase of emergency care revealed information demands for paramedics and nurses especially with respect to invasive/non-invasive techniques, first aid standard operating procedures for leading symptoms, medications and medical devices. Assistant information, process, simulation, documentation as well as collaboration services were then developed for web-based usage via mobile devices (tablets) within defined use cases including cardiopulmonary resuscitation. Assistant services and personalized learning environments will now be evaluated by analysis of utility, usability, acceptance and learning efficiency in a pilot study starting in March 2017 within two different EDs.
Conclusions Introduction of novel learning and teaching strategies within the ED allows for a continuous medical education and training on the job in the special setting characteristics of emergency care. Results of our studies revealed a significant improvement of technical skills and medical expertise thus leading to a better performance of the academic staff within the ED. Further studies with non-academic employees now have to evaluate the effects of these innovative strategies within the preclinical and clinical phase of emergency care.
Abstract no. 102 A literature review to define concepts and dimensions of ecological validity/fidelity for usability validation
Jessica Rochat, Thomas Weinhold, and Christian Lovis, University Hospitals of Geneva and University of Geneva, Geneva
Jessica Schiro, Romaric Marcilly, and Sylvia Pelayo, CIC IT Lille / EVALAB, Lille
Introduction While quantitative evaluations, such as clinical trials, are well known and formalized, the situation is different for qualitative evaluations such as usability validation: they are insufficiently defined despite the imposition of the EU Medical Device (MD) Directive. The challenge for usability validation of MD is to make sure that risks of use errors identified during simulation-based usability testing are effectively representative of risks of use errors when the device is used in real settings.
In order to establish scientific evidence of critical methodological choices for usability validations environments, we addressed the question of the cost-effectiveness ratio of varying the level of realism of simulation-based usability validation. This study presents the first part of the research, which consists in a literature review to identify relevant dimensions of the environment that can be varied to assess their ability to identify use errors along with their costs.
Method Two databases were searched: Pubmed and Scopus. Three sets of key terms were defined to specify keywords for (i) evaluation, (ii) usability and (iii) ecological validity/fidelity. One reviewer performed the query and screened titles and abstracts. The identified papers were cross-checked by a second reviewer (K=0.9). The read-through of selected full-text papers was performed independently by two reviewers. In case of disagreements, the inclusion eligibility was discussed with a third reviewer.
Results Only 12 papers specifically discussed dimensions of ecological validity, which may influence the results of simulation-based usability testing. Ecological validity refers to what extent the test environment mirrors the environment in which a product would be used in ”real life”, i.e. to the extent to which experimental findings can be generalized to everyday life. It implies the possibility for participants to be able to apply their expertise during the experiment and to use the product as they would have done in ‘real life’. The fidelity of a simulation-based usability testing environment is a measure of its ecological validity. The dimensions of ecological validity are roughly different depending on the authors. But all the authors agree on three critical dimensions: task, prototype and environment fidelity. Three other dimensions are also highlighted: scenario, behaviour and users fidelity. Only two dimensions can be retained to test their impact on simulation-based usability validation: the environment and behaviour fidelities. The dimensions related to users, task (scenario) and prototype fidelity could not be tested due to the regulation constraints of the experimental design: final versions of the MDs must be evaluated, real users need to be included, and the task fidelity must be defined according to potential use errors to test.
Discussion & conclusions The literature review allowed to identify two dimensions of ecological validity which should be considered during our simulations. By varying them, their influence on the cost-effectiveness ratio of usability validations will be analyzed. For the environment fidelity, this includes simulating the environment’s stimuli (e.g. noise, odours), equipment (e.g. artefacts, medical equipment) and the room (e.g. home, lab, meeting room). With regard to the behaviour, verbalizations of actions (low-fidelity) will be compared to actually performed actions (high-fidelity).
Abstract no. 107 Methods for enhancing biomedical research data discoverability
Christiana McMahon and Spiros Denaxas, University College London, London
Arofan Gregory, Open Data Foundation, Tucson
Tito Castillo, University College Hospital, London
Introduction Diverse and disparate datasets are increasingly being linked and used in research both at scale and at higher clinical resolution. In biomedical research, a growing ‘open’ research culture has emphasised the significance of publicly-accessible metadata the availability of which is critical since researchers use clinical datasets containing personally identifiable information, and are not always able to readily share these data.
However, the inability to characterise and evaluate datasets due to insufficient metadata limits the extent to which data may be utilised for research. These challenges are compounded by inconsistencies in the way researchers record and share discovered datasets. This study aimed to identify and evaluate methods to enhance biomedical research data discoverability.
Methods We used a combination of analytical techniques: a systematic literature review to characterise existing data discoverability practices and identify current challenges an online international stakeholder survey and feasibility analyses (technical, economic and organisational factors) of methods to enhance biomedical research data discoverability.
Results We identified 49 studies and organisations 13 were randomly selected for review. PDF was the most commonly used format for research protocols whereas research data were mostly disseminated using SAS, STATA and SPSS files. A total of 253 individuals completed the survey. The most popular aspect of a research study that should be easily searchable was the ‘research study question’ (15%). Survey results showed that variable standards of data management and research data negatively impacted the handling of metadata. Challenges associated with data publications included, limited perceived significance and the need for changes in research culture for data to be, “considered and acknowledged as a valuable scholarly output alongside publications”. However, formal academic recognition of their significance is limited and the publishing of these articles could have an associated open access fee. Semantic web technologies, e.g. the Resource Description Framework, use uniform resource identifiers to differentiate between disparate data sources which may be integrated. However, limited familiarity with these technologies could result in a significant demand for training. Public health portals: online catalogues of metadata records describing studies for which research data may be available for reuse. Researchers are already using online portals yet, integrating use of this portal into work routines may be challenging additional resources are required to develop and sustain the portal.
Discussion We identified inconsistencies in how research data were documented (e.g. the provision of online data dictionaries) and the creation/usage of metadata. Most of the survey respondents were data users and given that awareness of the significance of having high-quality metadata is still increasing amongst researchers, these results could be attributed to limited awareness of the discoverability issue and inadequate routine metadata administration.
Conclusion Our findings suggest that more emphasis is needed on the importance of metadata through training/support the advantages of data publications and increased recognition of these outputs within the academic community. The three methods identified and evaluated can support these recommendations.
Abstract no. 114 Determining the accuracy of routinely-collected health datasets for identifying neurodegenerative disease cases: UK biobank approach
Tim Wilkinson, Amanda Ly, Zoe Harding, Christian Schnier, and Cathie Sudlow, University of Edinburgh, Edinburgh
Introduction Neurodegenerative diseases such as dementia and Parkinson’s disease (PD) are major causes of mortality and morbidity. Prospective cohort studies can provide important insights into the determinants of these disorders. UK Biobank (UKB) is a large, population-based, prospective cohort study of over 500,000 participants aged 40-69 years when recruited between 2006 and 2010. Participant follow-up is largely via linkage to routinely-collected health datasets such as hospital admissions, death registrations and, increasingly, primary care data. Here, we discuss the approach we have developed to estimate the accuracy of these sources for the identification of dementia and PD outcomes.
Methods We conducted systematic reviews of studies that assessed the accuracy of ascertaining dementia or PD cases from codes in routinely-collected datasets versus a clinical expert diagnostic reference standard. We summarised results for positive predictive value (PPV) and sensitivity. Informed by these results, we performed our own validation study of dementia coding using data from UKB participants and have commenced a similar study for PD. Using published and online resources and clinical judgement we generated a list of ICD-10 and primary care (Read version 2) dementia codes. We identified Edinburgh-based UKB participants with a dementia code in hospital admissions, death or primary care data. We extracted relevant letters and investigation results from the electronic medical record (EMR). A neurologist adjudicated on whether dementia was present based on the extracted notes, providing the reference standard to which the coded data were compared. We calculated the PPV for each data source individually and combined.
Results The systematic reviews revealed a wide variation in methodologies and results across existing studies in the literature. For PD, PPVs ranged from 71-88% in hospital and death datasets, while in a primary care dataset the PPV was 81%, increasing to 90% in patients who also received >1 prescriptions for antiparkinsonian drugs. Sensitivities for PD coding in hospital and death datasets ranged from 53-83%. PPV estimates for dementia coding in hospital and death datasets ranged from 4-100%, with PPVs of 83-92% for primary care data. The use of specific subtype codes or selection of codes in the primary position only resulted in higher PPVs; however, there was a corresponding reduction in case ascertainment. For our UKB validation study of dementia coding, there were 17,000 Edinburgh-based participants of which 44 participants had a dementia code in at least one data source and available EMR data. PPVs for dementia were 41/44 (93%, 95% CI 81-99) overall, 13/15 (87%, 95% CI 60-98) for hospital admissions, 2/2 (100%, 95% CI 16-100) for deaths and 33/34 (97%, 95% CI 85-100) for primary care data.
Discussion Results to date suggest that, with appropriate choices of codes, the diagnostic accuracy of these datasets is likely to be sufficient for identifying dementia and PD cases in large-scale, prospective epidemiological studies. Primary care datasets are potentially valuable data sources warranting further investigation.
Conclusion By systematically reviewing the literature and performing our own validation study, we have developed a method of estimating the accuracy of using routine datasets to identify neurodegenerative cases.
Abstract no. 122 Presentation of laboratory test results in patient portals: effect on risk interpretation and patient interaction.
Paolo Fraccaro, Lamiece Hassan, Grahame Wood, and Iain Buchan, Health eResearch Centre, Farr Institute for Health Informatics Research, The University of Manchester, Manchester
Panos Balatsoukas, NIHR Greater Manchester Primary Care Patient Safety Translational Research Centre, The University of Manchester, Manchester
Sabine van der Veer, Richard Williams, Smeeta Sinha, and Niels Peek, Centre for Health Informatics, NIHR Manchester Biomedical Research Centre, The University of Manchester, Manchester
Introduction Patient portals are considered valuable conduits for supporting patients’ self-management. However, there are safety concerns over how patients might interpret and act on the information from these portals, especially laboratory test results. Contemporary information visualisation research has produced methods that improve human perception and cognition in different information seeking and decision-making tasks. However, these methods have not been evaluated for presenting clinical test results via patient portals. Our objective was to investigate the effect of different visual presentations of laboratory results on risk interpretation and user interaction.
Methods We conducted a controlled study with 20 patients with a kidney transplant, who had quarterly blood tests. Participants visited our human computer interaction laboratory and interacted with different clinical scenarios, designed by nephrologists, to reflect high, medium and low health risks. These were composed of results for 28 different laboratory tests and shown using three different web-based presentations. Each presentation was tile-based, with a baseline presentation (based on Patient View, a system currently available to patients) and two more advanced presentations providing different visual cues, colours and tools to show normal and abnormal values. After viewing each clinical scenario, patients were asked how they would have acted in real life: 1) call their doctor immediately (high perceived risk) 2) ask for an appointment within four weeks (medium perceived risk) or 3) wait for their next scheduled appointment (low perceived risk). We tested each presentation in terms of accuracy of risk interpretation, perceived usefulness, level of understanding, information processing, and visual search behaviour.
Results We found no statistically significant differences between the three presentations in terms of the accuracy of risk interpretation. Misinterpretation of risk information was high, with 65% of patients underestimating the severity of risk across all presentations at least once. Particularly, patients decided to wait for their next appointment in 50% of the medium and high-risk cases. Patients found it particularly difficult to identify medium risk. The two advanced presentations were perceived as more useful (P=0.023). Differences in information usage and level of information processing were associated with personal characteristics, such as previous experience with PatientView, frequency of internet usage, education and graph literacy. Overall, patients followed similar visual search behaviours across the three presentations. The comparison of longitudinal information for two laboratory tests was rarely used. Patients who interpreted information correctly adopted more targeted visual behaviours than those who did not, focusing on relevant test results for their condition.
Discussion Although limited by a small sample size, our study is the first to investigate the effect of information visualisation design on patients’ interpretation of risk when accessing realistic panels of laboratory results online. Our study provides also unique data on how patients interact with and make sense of laboratory results in patient portals.
Conclusions This study confirms patients’ difficulties in interpreting laboratory results, with many patients underestimating risk across different presentations, even when abnormal values were highlighted or grouped.
Abstract no. 132 Potential use errors of ANI monitor to evaluate patient pain and discomfort
Marzia Del Zotto, Thomas Weinhold, Jessica Rochat, Christian Lovis, Division of Medical Information Sciences (SIMED), Geneva University Hospitals (HUG), Geneva
Pierre-François Gautier, Jessica Schiro, Sylvia PELAYO and Romaric Marcilly, Univ. Lille, INSERM CIC-IT 1403, CHU Lille, EA 2694, Lille
Introduction The correct identification and classification of use errors is crucial in evaluating the usability and the safety of a medical device. This identification proceeds through a detailed analysis of scientific literature of similar devices, context of use, feedbacks from manufacturers, and incident report databases. The main goal of this study was to identify and classify potential use errors related to the use of innovative pain monitor (ANI Monitor). The calculations have been designed in order to objectively rate the level of the patients’ pain and their own comfort/discomfort by means of an electrophysiological signal (Analgesia Nociception Index - ANI).
Method Several sources of information have been inspected in agreement with European and International guidelines. We collected data coming from: i) similar devices via journals and conference proceedings as well as safety reports [e.g. Marcilly R. et al. (2014) in Stud Health Technology Inform Lieblich SE (2004) in Journal of Oral and Maxillofacial Surgery] ii) previous Human Factors (HF) analyses iii) interviews with end users having high expertise in monitoring pain with conscious and unconscious patients iv) observations at the intense care unit of two different hospitals, respectively in France and in Switzerland. Results were gathered and synthesized through a Failure and Effect Mode Analysis (FMEA) to identify the potential use errors.
Results A total of 11 potential use errors were identified and classified by means of a level of severity based on their own safety-related consequences. They deal mainly with misinterpretation of the Index, with misunderstanding between two Indexes (ANI mean and ANI instantaneous), and with unawareness of the poor quality of the ECG signal. Consequently, their effects on patients include an unsuitable treatment leading to an over- or under-dosage of analgesic drugs.
Discussion In our study, the identification of use errors arises from the integration of different sources (e.g. context of use, observations of the real environment, interviews with experts as well as incident report databases from manufactories), since no literature is available yet, due to the novel nature of this technology. Consequently, by means of FMEA, we systematically classified and prioritized potential failures and their effects on patients to design possible scenarios of user tests.
Conclusion The integration of different sources, as well as literature review, context of use, manufacturers’ feedback and incident report databases, is essential in the user-centred design for the usability validation of medical devices. It allows identifying risks and use errors of the device itself. However, in our case, we could identify some explicit failures taking in account the specific context of use and the functional characteristics of the pain monitor, given that no literature of similar devices was available. The most common use errors will be tested during the summative evaluation of diverse scenarios having different levels of fidelity.
Abstract no. 134 Developing analytical capability in health care in the UK
Martin Bardsley, The Health Foundation, London
Introduction The impact of advances in data science is often dependent on the capacity and capability of analysts working in the health care systems who have to implement new approaches. In this presentation, I will discuss work undertaken at The Health Foundation to outline the challenges facing the analytical workforce in the health services in the UK.
Methods Qualitative analysis of 70 interviews with analysts, academics, clinicians and managers working for health services and public health in the UK during 2016.
Results Though there are examples of good analysis and variations between organisations, the interviews identified a series of common problems including:
- Decision makers in health care often cannot access the right type of analytical skills.
- In some cases there are too few analysts, in others they are too busy working on mundane data manipulation “shifting and lifting”.
- Where we do have analysts, their skills can be limited and they work in small units with little chance to develop professionally.
- The increasing amounts we rightly spend on information are not being matched by our investment in people to analyses the data we have.
Analysts do not form a homogenous occupational group but span many different disciplines and skills. The interviews suggested that the critical attributes are for people who are able to: (a) understand and structure the problems of managers/ clinicians (b) access evidence and information that was relevant to a problem (c) apply appropriate and robust methods to manipulate information and data and (d) communicate the findings accurately and clearly.
The reasons behind the shortfall in analytical capabilities encompassed issues covering the supply of analysis and training and support as well as the demand for their skills
Discussion In a situation where the problems are multifaceted, the solutions seem to be long term strategies that encompass: (a) Promoting ways that analyst can use networks to share and learn (b) Working at scale to overcome the problems of fragmented communities of analysts and the need to an array of different boundaries. (c) Supporting professional development and vocational training. (d) Supporting tools for analysis (e) Creating environments for innovation and (f) Develop new relationship with the experts. There are also important elements of cultivating demand for high quality analysis and to reinforce the value of analytics at a local level. The might include (a) ways to help roving business benefit (b) developing tools for auditing analytical development (c) Awareness raising and training with existing management development initiatives (d) often innovation in analytical methods could be driven by requirements from the centre.
Conclusions One of the most effective ways to improve the use of information to support healthcare is to invest in the capabilities of those analysts working directly in the service. This has implications for training and development programmes as well as the wider supporting structures than enable the development and implementation of new analytical methods.
Abstract no. 140 Obesity and cancer together impact upon survival (OCTOPUS) consortium ‘cancer e-lab’: a federation meta-analysis of trial data
Andrew Renehan, Farr Institute@HeRC, University of Manchester, Manchester
Emma Crosbie, Division of Molecular & Clinical Cancer Sciences, School of Medical Sciences, Faculty of Biology, Medicine and Health, University of Manchester, Manchester
Matthew Sperrin, Ruth Norris, Georgina Moulton, and Iain Buchan, Farr Institute, MRC Health eResearch Centre (HeRC), Division of Informatics, Imaging and Data Sciences, School of Health Sciences, Faculty of Biology, Medicine and Health, University of Manchester, Manchester
Richard Riley, Research Institute for Primary Care and Health Sciences, Keele University, Staffordshire
Richard Wilson, Centre for Cancer Research and Cell Biology, Queen’s University Belfast, Belfast
Introduction We seek to establish a ‘Cancer e-lab’ to address a complex clinical question regarding excess body weight (commonly expressed as elevated body mass index, BMI) and survival after cancer treatment. We will test this hypothesis in two federation meta-analyses, undertaking secondary analyses of trial data in patients in the non-metastatic disease settings of colorectal (CRC) and endometrial (EC) cancers. This project is funded by the World Cancer Research Fund (2016 to 2018). Elevated BMI is an established risk factor for several cancers. By extension, elevated BMI at or after cancer diagnosis might be associated with a poor prognosis, and indeed, many studies show such associations. This is a key rationale for weight management strategies in cancer survivorship. However, interpretation of analyses in the cancer post-diagnosis setting is susceptible to biases, including: treatment allocation, stage misclassification, reverse causality, and dose-capping chemotherapy in obese patients.
We argue that the optimum setting to test these associations is a secondary analyses of trial data, where stage, treatment and cancer endpoints are governed by protocol. Here, in a novel way, we extend this idem to meta-analyse data across many trials, thus increasing estimate precision, and allowing sufficient numbers to test for specificity of association.
Methods We will establish a Cancer e-Lab similar to the already established STELAR Asthma e-lab.1 This serves as “a data repository populated with a unified dataset from well-defined cohorts, which also provides the computational resources and a scientific social network to support timely, collaborative research across the consortium”. For OCTOPUS, the primary endpoint will be cancer-specific survival. We have identified 30 eligible RCTs for CRC and 6 RCTs for EC. Trial leads have been identified, contacted and pledged willingness to partake in the consortium. The federated meta-analysis approach means that data can stay at source and analysis comes to the data.
Results The e-lab will serve as a ‘data safe-haven’: “a repository in which useful but potentially sensitive data may be kept securely under governance and informatics systems that are fit-for-purpose and appropriately tailored to the nature of the data being maintained, and may be accessed and utilized by legitimate users”.2 Statistical methods for meta-analysis that preserve the clustering of patients within studies will be preferred. One-step hierarchical models with random effects will be explored as these have the advantage that one can implement non-linear trends and non-parametric flexible models. This approach can be computationally intensive.
Discussion & Conclusions The findings from this robust analytical platform will offer a clear direction whether or not there is an adverse effect of elevated BMI (compared with normal weight) on cancer-specific survival in CRC and EC, and inform weight management studies in survivors of these two common cancers.
References
Custovic A, Ainsworth J, Arshad H, Bishop C, Buchan I, et al. (2015). Thorax 70: 799-801.
Burton PR, Murtagh MJ, Boyd A, Williams JB, Dove ES, et al. (2015). Bioinformatics (Oxford, England) 31: 3241-3248.
Abstract no. 142 Towards quality health data: defining the health data pyramid
Jessica E. Lockery, Taya A. Collyer, and John J. McNeil, Monash University, Department of Epidemiology and Preventive Medicine, Melbourne
Introduction Health data is information about the physical, mental and social condition of a person stored in a form compatible with computer input, storage and processing for output as usable information. This definition is broad and includes data of varying structures and provenance. Evidence-based medicine is driven by a hierarchy of evidence represented in the seminal Evidence Pyramid1. As the prominence of ‘big data’ in health increases, it is becoming apparent that a similar hierarchy exists for health data. Developing a framework for assessing the quality of health data is crucial as the digital capability of medicine continues to evolve. To assist health professionals and researchers consider and discuss the quality of their health data, the development of a Health Data Pyramid is proposed.
Methods Key areas of concern were identified in the literature. Risk of bias, clinical accuracy, and burden of unstructured data cleaning were recognised as major causes of lower quality patient data.2,3 Classes of health data were assessed and ranked according to their likely clinical accuracy and the utility of the data structure for analysis.
Results Six major classes of health data were identified, ranked and assembled into a pyramid: Validated point-of-care (POC) data, POC data, Retrospective Clinical Data, Administrative Clinical Data, Administrative Non-Clinical data, and Unstructured Health Information. The top tier represents the highest quality patient health data. Assessment of the quality of population health data requires further consideration of data collection method (i.e. systematic vs opportunistic data collection) and data completeness. Consequently, population health data should be viewed through this lens.
Discussion Data science has the potential to aid the evolution of more adaptable, responsive health care and improve delays in translation. However, it is crucial that interpretation of health data is informed by data quality. Predictions of a bright future where each patient’s prognosis and optimal treatment are determined via machine learning strategies may be thwarted by the scarcity of high quality data,4 and the risks of relying on poor quality data are currently unknown. The proposed six-tiered Health Data Pyramid and lens for population data assessment offers a framework for health data quality bench-marking and serves as the basis for discussion about the fitness of certain types of health data for informing clinical practice, policy and planning.
Conclusion Development of the Health Data Pyramid is an important innovation for data quality assurance in medical care and research.
References
Murad MH, Asi N, Alsawas M, Alahdab F. New evidence pyramid. Evid Based Med. 2016 Aug21(4):125-7.
Goldman LE, Chu PW, Osmond D, Bindman A. Accuracy of do not resuscitate (DNR) in administrative data. Med Care Res Rev. 2013 Feb70(1):98-112
Hong Y, Sebastianski M, Makowsky M, Tsuyuki R, McMurtry MS. Administrative data are not sensitive for the detection of peripheral artery disease in the community. Vasc Med. 2016 Aug21(4):331-6.
Angus DC. Fusing Randomized Trials With Big Data: The Key to Self-learning Health Care Systems? JAMA. 2015 Aug 25314(8):767-8. doi: 10.1001/jama.2015.7762.
Abstract no. 143 A secured architecture enabling to link clinical information system with consumer health mobile applications
Frederic Ehrler, Cyrille Duret, Thibaud Collin, and Christian Lovis, University Hospitals of Geneva, Geneva
Introduction Mobile applications create new opportunities to deliver patient centred services. In order to provide services integrated with the hospital ecosystem, connection between smartphone applications and clinical information system (CIS) must be set up. The link with smartphone applications opens new doors that can be exploited for malicious purposes such as unauthorised access, use, disclosure, disruption, modification or destruction. In this poster, we propose a new architecture that can be implemented in order to minimise the risk of linking mobile application services to a CIS.
Challenges We present below the most severe attacks when connecting personal device to a healthcare information infrastructure. Denial of Service (DoS): The risk of denied access to a service due to bombardment by useless traffic is emphasised by the large number of connections.
Injection Allow the execution of malicious data and gives control to the whole system to hacker. Identity theft: If an unauthorised access to app services is damageable, the theft of the CIS identity would be a much more serious issue.
Proposed architecture In our architecture the mobile application communicates with the CIS through a server isolated in a specific area of the hospital infrastructure. The communications from the outside go through a reverse proxy controlling that requests are not obvious attacks. The isolated server cannot communicate directly to the server inside the secured zone to prevent the spread of an attack. The communications between the secured server and the isolated one rely on a polling technique. At a chosen frequency, the secured server sends a request to the isolated server to know whether the latter has a pending request (figure 3). In case a valid request is done, it is transferred into the secured zone. There, the identity of the emitter is consolidated with the internal identity using a mapping table. Then the request is escalated to the relevant service of the CIS. Finally, the response goes back up till the isolated server. Resistance to DoS: As the exposed server is physically isolated of the rest of the infrastructure, a DoS attack will be restrained to spread on other services. Resistance to injection: If the injection is not stopped by the reverse proxy, the unidirectional communication between the intra-server and the isolated server ensures that injections won’t be carried further into the system. Protection against CIS identity steal: Although app password is vulnerable to techniques such as phishing, the exposed information remains limited since the password accessing medical information is uniquely accessible inside the secured zone of our architecture.
Discussion We propose a novel architecture designed to reduce the risk of external attacks and little constraining for users. This is a first step toward a robust architecture connecting mobile applications and CIS. A formal validation through penetration testing and scalability validation will be required before using it in real settings.
Abstract no. 148 Automatic detection of nursing activities in home care with portable and ambient sensors
Dominik Wolff, Stefan Franz, Marianne Behrends, Jörn Krückeberg, and Thomas Kupka, Peter L. Reichertz Institute for Medical Informatics, University of Braunschweig - Institute of Technology and Hannover Medical School, Hannover
Jonas Schwartze, Peter L. Reichertz Institute for Medical Informatics, University of Braunschweig - Institute of Technology and Hannover Medical School, Braunschweig
Michael Marschollek, Medizinische Hochschule Hannover, Hannover
Introduction Demographic change leads to an increase of people in need of care. Most are elders cared by relatives at home. These informal caregivers often face this situation surprisingly and without any prior care know-how. The aim of the project “Mobile Care Backup” is to support informal caregivers managing their everyday tasks by applying technology. In particular, the aim is proactive provision of necessary knowledge and information for informal caregivers. Furthermore, the information provided should be adapted to the caregiver’s specific situation. The majority of knowledge units will address nursing activities, giving the informal caregivers a better understanding of their tasks. To provide this information, the automatic detection of nursing activities is necessary. Thereby an automatic care diary can be realised, too. This paper describes a concept for automatic detection of nursing activities in home care.
Methods Typically, specific nursing activities are connected to different fixed places inside the cared person’s home. Therefore the position of the caregiver is an important predictor of the activity performed. Thus, indoor positioning is a necessary application. Since position measurement alone is not sufficient for the detection of nursing activities, an abstraction of accelerometer and gyroscope data could be used additionally. Furthermore, many nursing activities, like the administration of pharmaceuticals, are executed at a specific moment or time frame of the day. Thus, dates of execution could predict activities, too. Data points from indoor positioning could be validated by logical rules. If the caregiver remains in front of the tub in the bathroom he is probably bathing his relative. Accelerometer and gyroscope data could be interpreted by a soft computing method, like an artificial neural network or support vector machine. The mentioned date of execution of a nursing activity could be aligned with previously entered daily routines. In a second step, a pattern classification approach will be applied, using the results of these three evaluations as feature vector, putting out one final nursing activity.
Result For the indoor positioning, GPS or beacon technology could be used. Accelerometer and gyroscope data could be retrieved from a smartphone or smartwatch, which could measure the date of execution, too. As different studies have shown, it is possible to abstract accelerometer data to activities of daily living. For this task, neural networks seem to suit better than support vector machines and other techniques.1
Discussion Indoor positioning using beacons should be more precise than GPS. The smartwatch’s accelerometer data is more significant than the smartphone’s. By merging these two approaches with the execution dates, we should reach a high classification rate. Camera-based approaches could produce good results as well, but will not be used due to acceptance issues. Information could be displayed on the smartwatch, so the caregiver is empty-handed to perform the activity.
Conclusion A suitable setup was found. The proposed system should produce good results. The next step is the system’s implementation and evaluation.
Reference
Preece SJ, et al. Activity identification using body-mounted sensors--a review of classification techniques. Physiological Measurement. 200930:R1-33.
Abstract no. 158 Exploring the extent to which prescribing and dispensing dose instructions differ
Clifford Nangle, Jackie Caldwell, and Marion Bennie, NHS National Services Scotland, Edinburgh
Stuart McTaggart, University of Dundee, Dundee
Introduction The Prescribing Information System (PIS) data mart, hosted by NHS National Service Scotland receives around 90 million electronic prescription messages per year from GP practices and around 75 million electronic dispensing messages per year from pharmacies across Scotland. Prescription messages contain information held in the GP10 prescription form (e.g. drug name, quantity and strength) stored as coded, machine readable, data while the prescription dose instruction consists of unstructured free text and is difficult to interpret and analyse in volume. Dispensing messages contain information imported from the prescription message and may be modified by the pharmacist during the dispensing process due to switching of pharmaceutical product to a generic equivalent and rephrasing of the dose instruction text for the patient. The aim is to perform a comparison of prescription dose instructions with dispensing dose instructions by extracting drug dose, unit and frequency information using Natural Language Processing (NLP) methods and to apply this comparison to drugs used in the treatment of depression and type 2 diabetes, namely antidepressants and antidiabetic drugs found in sections 4.3 and 6.1.2 respectively, of the British National Formulary (BNF).
Methods An NLP algorithm has been developed to extract drug dose amount, unit and timing frequency information from prescription dose instructions (This algorithm has a read rate of 97.5% and an error rate of 2.6% when processing dose instructions for drugs found in chapters 1 to 10 of the BNF). Prescription and dispensing messages will be linked using information present in both. The NLP algorithm will parse the dose instruction text and convert drug dosage information into a structured machine-readable form to perform the comparison. Accuracy estimates will be obtained by randomly sampling source records and performing a manual comparison.
Results The results of this study will be presented in the poster and will include a breakdown of how the prescription dose instructions have been altered during the dispensing process taking into account switching of pharmaceutical product.
Conclusions The analysis will be used to determine whether, or the extent to which, information held in the electronic dispensing messages is consistent with information held in the electronic prescribing messages that are stored in the PIS data mart.
Abstract no. 174 Screening women in Glasgow: comparing uptake across breast, cervical and bowel cancer screening at an individual patient level
Paula McSkimming, Richard Papworth, Alex McConnachie, and Colin McCowan, Robertson Centre for Biostatistics, Institute of Health & Wellbeing, University of Glasgow, Glasgow
Katie Robb and Marie Kotzur, Institute of Health & Wellbeing, University of Glasgow, Glasgow
Introduction Screening can reduce deaths from cervical, bowel and breast cancer if the people invited participate, however screening uptake among Scottish women is 73% for breast, 69% for cervical but only 61% for bowel. Little research has examined why bowel screening fails to achieve the uptake rates of breast and cervical. The availability of Glasgow-wide data for the complete population within a socioeconomically diverse region with comparatively low screening uptake provides a unique context for this research. To determine why women who are eligible for all three types of screening choose to do none, some or all tests and to shed new light on barriers unique to bowel screening we will investigate demographic and medical factors associated with the lower participation in bowel screening relative to breast and cervical screening.
Methods Data on screening invitations and attendances for women aged 20-74 in the NHS Greater Glasgow and Clyde Health Board who were sent an invitation or attended at least one of the three programmes during 2009-2013 were linked to demographic data, hospital discharge records, GP Local Enhanced Service (LES) data and death certification records. The number of attendances for breast and cervical screening and the number of bowel screening tests returned were recorded. It was not possible from the data provided to identify the number of invites to cervical screening or the relationship between a cycle of invites and attendances for all three programmes. Co-morbidity was assessed using a Charlson Index based on hospital records and GP LES data and socio-economic status was categorised by Scottish Index of Multiple Deprivation (SIMD) quintile based on home postcode. Logistic regression for each screening programme assessed the association of age, SIMD, Charlson Score and other factors on screening participation. Women who were invited to participate in all three programmes were also identified with similar analysis performed.
Results There were 430,591 women invited to take part in at least one of the screening programmes over 2009-2013. 116,212 (72.6%) women attended for breast screening out of 159,993 invited over the period, 250,056 (80.7%) women from 309,899 attended cervical screening and 111,235 (61.7%) women completed bowel screening from 180,408 invited. There were 68,324 women who were invited to participate in all three screening programmes during the study period with 35,595 (52.1%) participating in all 3 programmes.
Discussion Despite having rich data from the individual screening programmes, allowing unique insight into cancer screening uptake, recording of patient invitations and attendances differed significantly between the programmes. This provided limitations to the analyses such as identifying the number of invitations prior to uptake and screening cycle adherence. Women have lower participation in bowel screening than for breast or cervical, although the same demographic factors are associated with participation. Only half of women eligible for all three screening programmes participate in them all.
Conclusion Older women and those living in more affluent areas were more likely to attend for breast, cervical and bowel screening. Women with multi-morbid illness were less likely to participate in all screening programmes.
Abstract no. 176 Big data platform for comparing data-driven pathways for warning potential complications in patients with diabetes
Jose Ramón Pardo-Mas, and Carlos Sáez, Instituto de Investigación Sanitaria La Fe IISLAFE, Valencia
Salvador Tortajada and Juan M Garcia-Gomez, Instituto Universitario de Tecnologías de la Información y Comunicaciones (ITACA), Universitat Politècninca de València, Valencia
Bernardo Valdivieso, Universitat Politècnica de València, Valencia
The use of Big Data platforms in health care is in an uprising trend. Big Data technologies allow easier and faster analysis of vast amounts of data such as patient pathways, which may lead to better decision-making. We present a Big Data methodology approach for warning potential complications in patients with diabetes by finding local similarities among their patient pathways. Specifically we present a Storm based platform that implements our extended version of the Smith-Waterman algorithm to detect clinical complications in diabetic patients by comparing them to a whole set of Electronic Health Records (EHR). A demo of the system is available at www.lppaalgorithms.com.
The extended version of Smith-Waterman compares the patients based on a tuple form of clinical records, known as Patient Pathway (PP). Data processing was made to obtain the PP dataset from the EHRs, where each one is composed by the clinical observations ordered in time. We define five different types of clinical observations: hospitalisation, outpatient consultations, emergency room visits and laboratory tests for glucose and creatinine. The episodes of a patient are codified and put together in the PP following the timeline of each episode. Then, using the SW-based algorithm a comparison between each pair of PPs is carried out. The comparison has a possible output: cardiopathy complications. In case the PP pair is not ranked, it is not shown.
The logic for comparing PP is developed using a Big Data framework called Apache Storm. Different components are defined: a Spout that gathers the tuples from a web queue and passes the data to the logic, and a set of Bolts, each Bolt has a unique function inside the topology, and the Bolts can be largely replicated. These Bolts work together to join the pathways from the web queue with each one on the database, creating a set of 2 tuples for each database entry: the query patient, and the database patient. After finding local similarities, it is possible to rank the 10 best PP alignments. These are sent as possible outcomes for the query patient.
The LPPA system is based on different technologies. The web interface is primarily programmed using HTML and JavaScript, having WordPress as a design tool. The server is programmed in JavaScript, using node.JS to run the system, and various libraries, mainly Socket.io, and RedisIO.js. The database is implemented using Redis, a non-SQL on memory database that allows the PUB-SUB queues. These are used as channels, and the Storm framework subscribes to an input channel and publishes to the patient output channel. The client can subscribe this channel to retrieve the information in Real-Time.
This approach showed a precision of 0.26, a recall of 0.95 and a 0.42 F-score. This development is a first approach of PP predictive use in health. Despite having good recall results there is still improvement merging for other measures. There is still much work to be done.
Abstract no. 178 A systematic root cause analysis into the increase in escherichia coli bacteraemia in Wales over the last 10 years
Jiao Song and Ronan Lyons, Farr institute, Swansea university, Swansea
Angharad Walters, Ashley Akbari, Martin Heaven, and Damon Berridge, Farr institute, Swansea University, Swansea
Margaret Heginbothom and Julie Arnott, Public Health Wales, Cardiff
Introduction Bacteraemia is of public health importance due to the high morbidity and mortality associated with this condition. Numbers and rates of E. coli bacteraemia in Wales have risen substantially over the last 10 years and it is clear that interventions aimed at preventing the spread of E. coli and the development of bacteraemia need to be introduced to interrupt this upward trend. Public Health Wales have been requested to undertake an investigation into the rise of E. coli bacteraemia by the Chief Medical Officer for Wales. Anonymised, routinely collected administrative data stored in the Secure Anonymised Information Linkage (SAIL) databank will be used to provide descriptive and risk factor analysis.
Methods Anonymised blood microbiology culture data reported between 2005 and 2011 are included in the SAIL databank. E. coli bacteraemia cases have been linked with Welsh demographic service (WDS) data to obtain address information, week of birth and gender. All potential controls are randomly selected from WDS. Three different methods were used to identify controls: 1) the cases and controls had a Welsh address on the date the E. coli blood sample of the case was received (reference date), and both cases and controls lived in Wales during the 91 days before the reference date and controls did not have an E. coli blood culture sample during the 91 days prior 2) Method one was extended to also match on age and sex 3) method 2 was extended by additionally matching on GP practice. All cases and controls in these three groups have been linked with the patient episode database for Wales (PEDW), Welsh general practice data, emergency department dataset, outpatient data and Welsh index of multiple deprivation (WIMD) to flag the relative risk factors.
Results Logistic regression and conditional logistic regression modelling techniques have been used to identify risk factors for developing E. coli bacteraemia. All three models show that kidney infection, urine infection, likely hospital antibiotics prescription and high comorbidity score are the risk factors with the highest odds ratios. For group 1, the odds of a patient with a high comorbidity score are 16 times the odds of a patient with a low comorbidity score. The odds of a patient who had likely antibiotics prescription from hospital within 3 months are 16.5 times the odds of a patient who did not. The odds of a patient who had an urine infection within 3 months are 21.5 times the odds of a patient who did not. The odds of a patient who had kidney infection within 3 months are 145.7 times the odds of a patient who did not.
Conclusions Determining the factors associated with the development of E. coli bacteraemia will allow patients at highest risk to be identified. If these risk factors are modifiable, then preventive interventions can be introduced to reduce the number of potential cases of E. coli bacteraemia.
Abstract no. 186 Predictive modeling with machine learning based variable selection: a study on 30-day readmission prediction
Nan Liu, Kheng Hock Lee, and Marcus Eng Hock Ong, Singapore General Hospital, Singapore
Lian Leng Low and Julian Thumboo, Duke-NUS Medical School, Singapore
Introduction Healthcare resources are finite and frequent readmissions can overwhelm even developed health systems. Patients with frequent admissions also experience significant psychological stress and financial burden. In the United States, 30-day readmissions are considered an accountability measure and quality indicator. In this study, we aimed to develop a predictive model to assess the risk of 30-day readmissions for admitted patients, where machine learning (ML) algorithms were used for clinical variable selection.
Method This was a retrospective observational study in Singapore General Hospital. All adult patients ≥21 years were included if they had alive-discharge episodes from Department of Internal Medicine in 2012. Patients who died during the index admission, non-residents, or who had a discharge destination other than home at discharge were excluded. Comorbidities were identified using ICD-10 codes in any primary or secondary diagnosis fields dating back to one year preceding the index admission. Charlson comorbidity index (CCI) and the LACE score were computed for each patient. Additionally, patient demographics and laboratory variables were extracted. We used 80% randomly selected data for model derivation and the remaining 20% for model validation. A novel machine learning based variable selection algorithm was proposed to determine a subset of strong independent predictors. The novel variable selection method was developed based on ensemble learning framework and random forests.
Results 6,377 unique patients were admitted to internal medicine wards in 2012. 515 (8.1%) were excluded from analysis. Of the 5,862 (91.9%) patients remaining in the cohort, 572 patients (9.8%) were readmitted within 30 days after discharge. We built two predictive models: Model A used a full set of variables and Model B used selected variables obtained from our proposed algorithm. Model A achieved C-statistic of 0.68, sensitivity of 66.0% and specificity of 60.4% at the cut-off score of 90. Model B achieved C-statistic of 0.7, sensitivity of 70.1% and specificity of 60.4% at the cut-off score of 90.3. In comparison, the LACE score had lower C-statistic (0.62), sensitivity (66%) and specificity (52.7%) at the cut-off of 6.
Discussion By applying the novel variable selection algorithm, we selected a total of fifteen significant predictors, built and validated a predictive model. Both Model A and Model B outperformed the LACE score in predicting 30-day readmissions, which showed the evidence that machine learning based predictive model is a promising replacement of traditional clinical score. Moreover, with a similar cut-off (90 vs 90.3), Model B derived on selected variables achieved higher sensitivity (70.1% vs 66.0%) compared to Model A in which all variables were used. This has demonstrated that a subset of significant predictors is desired in building predictive models.
Conclusion We observed that a few selected predictors outperformed the full set in predicting the risk of 30-day readmissions. The novel machine learning based variable selection method has proven to be effective in choosing the most discriminatory predictors. Moving forward, we will conduct a large-scale validation study using the hospital’s electronic health records for all clinical departments.
Abstract no. 187 Facebook ‘Likes’ do not accurately predict symptom reports: a machine learning study
Chris Gibbons, University of Cambridge, Cambridge
Introduction Digital footprints, including Facebook ‘Likes’, have been used to successfully predict factors including personality, gender, and relationship status. We attempted to predict medical symptom reports using Facebook ‘Like’ information.
Methods Data were collected from the myPersonality application. 2036 participants submitted symptom data (collected using the Pennebaker Inventory of Limbic Languidness) alongside demographic information and Facebook ‘Like’ data. We trained multiple machine learning algorithms to predict symptom reporting using digital footprint information. Algorithms including generalised linear model with lasso regularisation (GLM), support vector machines with linear and polynomial basis function kernel (SVM linear and polynomial), regression trees (trees) and random forests with 500 trees (random forest). Data were randomly split into ‘training and ‘validation’ samples with an 80:20 ratio. Algorithm performance was compared using Pearson correlation between predicted and real values from the validation dataset. RMSE was used as a measure for prediction error.
Results 2036 adult participants (mean age = 25.14, SD = 8.51) provided information on all measures. The best algorithm for predicting the actual symptom reports using the full range of the scale was the random forest (r = 0.28, RMSE = 31.29). Regression with lasso regularization performed similarly well (r = 0.22, RMSE = 30.81). Regression trees (r = 0.08, RMSE = 30.68) and SVM (linear: r = 0.11, RMSE = 47.34 polynomial: r = 0.05, RMSE = 47.82) performed worse at predicting symptom reports using the information based on participants’ Facebook ‘Likes’.
Discussion & Conclusions Multiple machine learning algorithms failed to predict symptom reports with high accuracy. This result may be explained by lack of temporal sensitivity inherent in Facebook ‘Likes’ which, in contrast to symptom reports, provide a signal that remains consistent over time. Symptom reports may be better predicted by signals in digital footprint that fluctuate over time, such as online behaviour and status updates. The study highlights the importance of matching transient and enduring data, even when using powerful deep machine learning approaches.
Abstract no. 188 The features patients ‘want’ in a smartphone app to support asthma self-management and their clinical effectiveness: a systematic review of the telehealth interventions and online discussion forums
Chi Yan Hui, Tracy Jackson, Eleftheria Vasileiou, and Hilary Pinnock, Asthma UK Centre for Applied Research, Usher Institute of Population Health Sciences and Informatics, The University of Edinburgh, Edinburgh
Robert Walton, Centre for Primary Care and Public Health, Barts and The London School of Medicine and Dentistry, Blizard Institute, Queen Mary University of London, London
Brian McKinstry, Primary Care eHealth, Usher Institute of Population Health Sciences and Informatics, The University of Edinburgh, Edinburgh
Richard Parker, Health Services Research Unit, The University of Edinburgh, Edinburgh
Introduction Self-management with an action plan, as opposed to passive self-monitoring, improves health outcomes. Mobile technology, incorporating education, personalised asthma action plans and facilitating professional support, could be an option for supporting asthma self-management. Clinical research focusses on health-related outcomes whereas the eHealth market focusses on customer engagement. Therefore, we aimed to assess both the clinical effectiveness of the technology, and also identify application features that patient want and will continue to use in a self-management app.
Methods For clinical effectiveness, we followed Cochrane methodology to systematically review randomised controlled trials (RCTs) of telemedicine in adults/teenagers with asthma, and synthesised data on health outcomes (e.g. asthma control questionnaire and/or exacerbation rate). We searched nine databases and 2 reviewers selected eligible papers, extracted data, and used meta-analysis and narrative synthesis. For patients ‘want’ features, we systematically searched Google for ‘asthma’ ‘forums’ and retrieved posts in which patients discussed ‘wanted’ features. Eligible posts were assessed by two reviewers. We identified the frequency with which features were mentioned and synthesised the perceptions thematically.
Results We included 12 RCTs (published in 14 January 2000 –January 2015 updated search in April 2016.) in the systematic review. Meta-analysis (n=3) showed improved asthma control (mean difference -0.25 [95% CI, -0.37 to -0.12]). The effect on health outcomes of the 10 common features (education, monitoring and electronic diary, action plans, reminders or prompts to promote medication adherence, professional support for patients, raising patient awareness of asthma control, and supporting the healthcare professional) varied, but there were no examples of harm. No interventions explicitly reported the adoption of and adherence to the technology system by patients and healthcare professionals. From 25 online social forums, we included 22 posts (November 2013 –November 2015). 42 people with asthma commented on 44 application features, which we grouped into five categories (self-monitoring, feedbacks/advice, professional/carer support, reminders, and others e.g. stress management). Feelings ranged from ‘positive’, ‘appreciative but worried (e.g. about confidentiality)’, ‘nothing unique’, ‘doubtful’ and ‘negative’. The majority of comments about apps incorporating monitoring peak flows (sometimes with novel gadgets), symptoms and medication usage were positive, but without explicit mention of action plans. Smart gadgets, such as electronic inhaler logs provoked a wide range of responses.
Discussion The effect of telehealth applications, many including the features identified by patients, on health outcomes varied but was at least as good as traditional modes. People with asthma showed interest in logging health status with symptoms or peak flows, in contrast to the clinical evidence that evaluates self-management.
Conclusion Mobile technology is an option for supporting asthma self-management. The lack of discussion about action plans, suggests that today’s apps are limited to self-monitoring rather than self-management. Further research is needed to understand this limitation and the features associated with adoption and adherence to self-management.
Abstract no. 194 Moving WHO international classification of health interventions (ICHI) towards semantic interoperability
Jean Marie Rodrigues, INSERM LIMICS U1142 UPMC UP13 Université Jean monnet/Université de Lyon, Paris
Sukil Kim, Catholic University of Korea, Seoul
Béatrice Trombert-Paviot, INSERM U1142 LIMICS, Saint-Etienne & Paris
Introduction The WHO International Classification for Health Intervention (ICHI) is based on an ontology framework defined in ISO 1828, named Categorical Structure for terminological systems of surgical procedures. We reviewed 574 ICHI alpha 2016 existing codes and structure and compared with EN 1828 and the SNOMED CT (SCT) procedures hierarchy concept model. We conclude that modifications are needed to design a more semantically defined version of the ICHI chapter Medical and Surgical interventions. We checked if the three axes of ICHI (Target, Action and Means) are sufficient to express semantically the Medical and Surgical interventions and how ISO 1828 and SNOMED CT concept model for the Procedure Hierarchy express these interventions.
Method We studied 574 ICHI alpha 20161 interventions from three chapters: Nervous system, Ear, and Endocrine system. We compare the existing three axis structure of ICHI with ISO 18282 and SCT concept model.3
Results The different concept model of SCT attributes using the word “direct”, as in procedure site direct, direct morphology, direct device and direct substance are equivalent to ISO 1828 semantic link “hasObject” and semantic categories “Anatomical Entity”, “Lesion” and “Interventional equipment”. They have no equivalent in ICHI. Further on the attributes Procedure site indirect allows to provide the equivalent with ISO 1828 semantic link “hasSite” with the semantic category “Anatomical entity”. The ICHI axis Action should be duplicated to express the intent and the deed. The ICHI Target axis should be extended to pathology as adhesions or calculus, and to medical devices as pacemaker. The ICHI Target axis should be duplicate in Direct Target grouping the semantic categories on which the action is carried out and Indirect Target which is the site on which is localised the object on which the action is carried out as “Implantation of internal device, ventricles of brain”. The ICHI Means axis should be extended to medical devices and drugs.
References
International Classification of Health Intervention: Alpha2 Version 2016 http://mitel.dimi.uniud.it/ichi/docs/
EN ISO 1828 2012. http://www.iso.org/iso/iso_catalogue/catalogue_tc/catalogue_detail.htm?csnumber=52388
SNOMED CT® Editorial Guide July 2016 International Release (US English). https://confluence.ihtsdotools.org/display/DOCEG/SNOMED+CT+Editorial+Guide
Abstract no. 199 Enhancing nationwide medico-administrative databases analysis with SAF4Big, a statistical analysis framework for big data in healthcare
Alexandre Georges, Alexandre Caron, Jean-Baptiste Beuscart, Cécile Bonte, and Nicolas Girier, CHU Lille, Lille
Thibaut Balcaen, Emilie Baro, Jean-Baptiste Dugast, Fabien Bray, Grégoire Ficheur, and Emmanuel Chazard, Univ. Lille, EA2694, Lille
Many epidemiological studies now rely on the reuse of large medico-administrative databases. In those studies, most of the time is consumed in managing data and performing basic statistical analyses, and is not available anymore for complex statistical and medical analysis, so that the potential of such databases is sometimes under exploited. The objective of this work is to build SAF4Big, a statistical analysis framework for big data in healthcare, using literature-based specifications. A literature review was performed on PubMed in 4 different medical domains: caesarean deliveries, cholecystectomies, left implantable ventricular assist devices, and hip replacement surgeries. We identified 43 papers relating analyses of large databases. They reported epidemiological indicators (e.g. mean age) that were abstracted to features (e.g. univariate description of a quantitative variable), that were implemented through 37 new functions in R programming language (e.g. a function will draw a histogram, compute the mean with confidence interval, quantiles, etc.): 4 functions for data management, 9 for univariate analysis, 8 for bivariate analysis, 11 for multivariate analysis, and 5 intermediate functions. Those functions were successfully used to analyse a French database of 250 million discharge summaries. The set of R ready-to-use functions defined in this work could enable to secure repetitive tasks, and to refocus efforts on expert analysis.
Abstract no. 202 Release of the standard export data format by the japanese circulation society for standardized structured medical information exchange extended storage
Masaharu Nakayama and on behalf of the IHE-J Cardiology Team, Tohoku University, Sendai
Background In the era of big data, utilization and analysis of large amounts of clinical data are important. A substantial clinical database for cardiovascular disease requires a wide range of data including medical records, medication, laboratory tests, physiological examinations, and data from multiple modalities. Although these data are in a digital format, data transition from the hospital information system (HIS) to the database is performed manually in most hospitals, resulting in excess burden for physicians and clinical research coordinators. Hence, automated transfer of these data from the HIS to the database is desired, which requires the determination of standard formats for data connection between the HISs and the database.
Methods and Results In Japan, the standardized structured medical information exchange (SS-MIX) was developed in 2006 as a standard data storage format to share clinical data from various vendor-derived HISs and was revised (SS-MIX2) in 2012. Several national database projects and local electronic health records use the SS-MIX2. Moreover, data are retrieved from the SS-MIX2 storage for secondary use. The SS-MIX2 storage is divided into two categories: standardized and extended storage. The standardized storage includes standard structured and coded clinical data, such as basic patient data, prescriptions, and laboratory data transferred from the HIS in Health Level Seven format. All other data in non-standardized formats, such as electrocardiogram (ECG), echocardiography (UCG), and catheter examination data, are stored in the extended storage. Standardized storages are often utilized for several projects however, extended ones are rarely used. In 2014, the Japanese Circulation Society (JCS) decided to develop structured standard formats to save clinical data in SS-MIX2 storage, in collaboration with an international association that aims to improve the use of computer systems in healthcare through standards, integration healthcare enterprise (IHE), IT vendors, and several academic cardiology societies. In 2015, the Standard Export datA forMAT (SEAMAT) for ECGs, UCGs, and catheter examination data was announced. According to SEAMAT, the item name, unit, and format for SS-MIX2 can be determined. This step would help to effectively establish a nationwide clinical database and reduce the tedious manual data input by clinicians and clinical research coordinators. However, hospitals may continue to incur significant costs to equip information systems with this format. Thus, a program that enables the conversion of comma-separated data from information systems to SEAMAT is also being developed, which will be a useful and economical tool for transferring huge clinical data to SS-MIX2.
Conclusions Sharing medical information among hospitals is crucial for patient care and research. In Japan, JCS developed SEAMAT for the secondary use of important clinical data in cardiology. These stepwise implementations are crucial to achieve a nationwide clinical database for cardiology disease in Japan.
Abstract no. 210 Actual (in)validity of scientometric analysis in online scientific world
Izet Masic, Faculty of Medicine, University of Sarajevo, Sarajevo, Bosnia and Herzegovina
Edin Begic, Faculty of Medicine, University of Tuzla, Sarajevo, Bosnia and Herzegovina
Introduction Citing is an integral part of an article. Scientometric indicators of work of an author are number of citations, H index, i10 index and g index. Scientometric analyses of the work of one author are essentially meaningless, since they are based on platform of Google Scholar, which indexes any document belonging to academic domain, and is accessible for manual manipulation of content, and in most cases takes into account the work of authors who belong to the contemporary digital world and do not take into account the work of one author at a time when the content was not so much accessible to online community.
Method This article aims to show the (in)validity of scientometric analysis in the online scientific world.
Results Scientometric indicators of Web of Science, Scopus and Google Scholar (including Publish and Perish software) were analyzed. Incorrect quotation of an article or book lead to two different quotations of one article with different number of citations (which ultimately leads to incorrect H or i10 index). Digitalization of content in the modern age skipped numerous citations prior to digitization, and information on Google Scholar can give a false picture of the author (especially for authors who do not belong in the modern era). By analyzing the work of one author, we came to the conclusion that the Web of Science is more selective than Scopus and Google Scholar (Google Scholar shows the highest number of total papers, as well as the total number of citations). Scopus is more selective database than Google Scholar, but it is not known whether it is more valid. H index displayed on Scopus page is always lower than the index of H Google Scholar.
Discussion There is a lot of uncertainty in scientometric analysis of one author (in scientific community ranking in some field is an important factor). Google Scholar is subject of numerous manipulations, because it collects information, without paying attention on the credibility of the results, which leaves a lot of space for doubts in its validity.
Conclusion Scientometric analysis of the work of one author has more space for progress and the new tools are necessary for better evaluation. ORCID ID is a necessary thing for identification of an author in the online world.
Abstract no. 232 Design for governing the flow of data in a complex, multi-stakeholder and multi-jurisdictional health informatics project across canada
Karim Keshavjee, Frank Sullivan, Michelle Greiver, and Don Willison, University of Toronto, Toronto
Introduction The incidence of diabetes continues to grow in Canada and across the world. Diabetes Action Canada (DAC) has been funded by the Canadian Institutes of Health Research and others to conduct observational and interventional human studies with the goal of predicting and preventing diabetes complications. DAC brings together key stakeholders from across Canada. While there is a critical need to share information towards common goals, each stakeholder group has its own risks and concerns to address to meet the needs of its constituents. For example, ethical decision-making for research in Indigenous peoples is governed by a framework reflecting the requirements of First Nations. Legal frameworks in Quebec are different from those in Alberta. Cultural norms are different in British Columbia than in Alberta. The aim of this project is to address the various barriers to information sharing to enable data flow that will support the goals of DAC.
Method The UK Design Council’s Double-Diamond (Discover, Define, Develop, Deliver) method was used to identify key issues that each stakeholder feel they need to manage for appropriate governance (Discover). Key functionalities were required to manage the issues and achieve clinical and workflow goals. An iterative approach was used to engage a series of stakeholders to develop a solution that would work for all stakeholders. We also used a reflective process to identify salient features of governance processes of previous successful projects that could inform the development of our solution.
Results We have developed a novel Governance “Microbubble” model that incorporates several desiderata of interoperability: 1) Standard operating procedures and approaches to governing high risk, high stakes health or research goals 2) Standardized operationalization of generally accepted Governance Principles (transparency, accountability, etc.) 3) Standardized policies and procedures that are intended to engender trust, trustworthiness and confidence in data sharing 4) Oversight over work-flows, information flows and information technology to ensure that outcomes are consistent with goals and that risks are being managed appropriately 5) Scalability as new entities participate in the data sharing process. The model has been reviewed with key stakeholders it has or is attaining face validity and is currently being operationalized.
Discussion Multi-jurisdictional and multi-stakeholder projects face significant barriers to information sharing. Overcoming these barriers requires innovative social processes as much as they require innovative technologies.
Conclusion We have developed a conceptual governance, workflow, information flow and information technology oversight ‘package’ that can be standardized for use by multiple stakeholders in multiple-jurisdictions that have a plurality of ethical and regulatory frameworks. Operationalization and experience with the conceptual model will be reported at future conferences.
Abstract no. 239 EyeDraw Pedigrees: a case study in applying user-centred design to open source, clinical software development
Maria Cross and Jugnoo Rahi, University College London, London
George Aylward, Moorfields Eye Hospital, London
Introduction With the increasing role of genetics in modern healthcare, pedigree-drawing is becoming a vital part of medical history-taking. As we move toward a universal adoption of electronic medical records, there is an increasing demand for pedigree-drawing software appropriate for use within patient consultations. However, there is a paucity of freely available, interactive drawing tools that meet the needs of clinical users.
Methods We adopt a user-centred framework to develop a clinical pedigree-drawing application intended to be both useful and usable in clinical contexts. A mix of methods was employed, including semi-structured interviews, user goal and task analysis, and usability testing. Participants (two consultant ophthalmologists, one consultant clinical electrophysiologist, one genetic counsellor, one clinical lecturer, and two postgraduate research students) were identified as “expert users” working within clinical paediatric ophthalmic genetics. To develop the tool, we contributed to an open source JavaScript-based drawing software, EyeDraw, from the OpenEyes Foundation. Following an agile method, software modifications were made iteratively according to user feedback. Final testing, completed by two authors, involved drawing clinical pedigrees from the Great Ormond Street Hospital paediatric ophthalmology department. Pedigrees were identified from paper notes during a retrospective medical record review of patients seen in the outpatient clinic during a two-week period in October 2016.
Results Requirements elicitation defined the need for a pedigree drawing tool that was interactive, worked across a range of devices and was intuitive, following standardised pedigree drawing notation as recommended by the National Society of Genetic Counsellors. A decision to develop a web-based application was made to allow for cross-platform usage. The iterative development process took five months, employing both face-to-face and remote use engagement. Development ceased when no more user recommendations were made. Final software testing included 48 pedigrees (median 7 family members, range: 3-33; median 2 generations, range: 2-5). All tested pedigrees could be drawn, visualising all the data observed in the parallel paper-based approach including consanguineous families, multiple mates, multiple diagnoses and individual level information such as age and genotypic data.
Discussion User feedback and software tests presented in this case study demonstrate a successful user-centred approach to developing clinical software. As web-based, open source software, the resulting pedigree-drawing tool is suitable as a standalone application or could be integrated into any other web-based system. However, while cases seen at the Great Ormond Street paediatric ophthalmology department are complex, development and testing was limited to this context further work is required to assess the suitability of the software for other potential uses including different medical specialties and research.
Conclusion With the involvement of expert users throughout the process, we have developed and tested an open source electronic pedigree-drawing tool. The tool is suited to interactively draw the small, but potentially complex pedigrees encountered during clinical consultations.
Abstract no. 258 Reuse of electronic health record data in clinical decision support systems
Georgy Kopanitsa, Tomsk Polytechnic University, Tomsk
The efficiency and acceptance of clinical decision support systems (CDSS) can increase if they reuse medical data captured during health care delivery. High heterogeneity of the existing legacy data formats has become the main barrier for the reuse of data. Thus, we need to apply data modeling mechanisms that provide standardization, transformation, accumulation and querying medical data to allow its reuse. In this paper, we focus on the interoperability issues of the hospital information systems (HIS) and CDSS data integration. The project results have proven that archetype based technologies are mature enough to be applied in routine operations that require extraction, transformation, loading and querying medical data from heterogeneous EHR systems. Inference models in clinical research and CDSS can benefit from this by defining queries to a valid dataset with known structure and constraints.
Abstract no. 261 Automated pdf highlights for faster curation of neuordegenerative disorder literature
Honghan Wu, Anika Oellrich, and Richard Dobson, MRC Social, Genetic & Developmental Psychiatry Centre (SGDP), King’s College London, London
Christine Girges and Bernard de Bono, Farr Institute of Health Informatics Research, UCL Institute of Health Informatics, University College London, London
Tim Hubbard, Department of Medical & Molecular Genetics, King’s College London, London
Introduction Alzheimer’s disease, the most common neurodegenerative disorder, is expected to cause 1 million new sufferers per year as early as 2050. Similarly, numbers of people suffering from Parkinson’s disease are expected to rise to between 8.7 and 9.3 million by 2030, making it the second most common neurodegenerative disorder. As such, these diseases have become a major focus of global biomedical research in an effort to develop a detailed understanding of causes and pathology that will lead to novel treatments and improved care. The ApiNATOMY project (http://apinatomy.org/home) aims to contribute to our understanding of neurodegenerative disorders by manually curating and abstracting data from the vast body of literature amassed for these illnesses. As curation is labour-intensive, automated methods are sought that allow for faster manual curation. Here we present our method aimed to learn the highlighting behaviours of human curators.
Methods PDFs are converted into sentence-separated XML files using Partridge. Sentences potentially relevant for the curator, are identified through an algorithm that assesses each sentence individually and scores its relevance based on linguistic (cardinal numbers preceding nouns, characteristic subject-predicate pairs), semantic (named entities) and spatial features (splitting of papers into regions and section assignment). Linguistic and semantic features were weighted based on the percentage of their occurrences in highlighted sentences and spatial regions. The overall score of a sentence was calculated using a linear function that combined scores of all identified features in it. The parameters of the linear function were chosen from the values that led to best performance on the training data. To configure and evaluate the algorithm, we used PDF files that had been manually assessed and highlighted (by one curator) as part of the ApiNATOMY project. The data is divided into two sets: configuration (183 papers) and evaluation (58 papers). We also implemented four binary classifiers (Perceptron, Passive Aggressive Classifier, kNN and Random Forest ) based on the bag-of-words model as baselines.
Results Using a test set manually corrected for tool imprecision, experiments showed that our approach achieved a macro-averaged F1-measure (a measure of a test’s accuracy) of 0.51, which was an increase of 132% compared to the best baseline model - Perceptron. In addition, a user based evaluation by a senior curator (author CG) was also conducted to assess the usefulness of the methodology on 40 unseen publications, which reveals that in 85% cases all highlighted sentences are relevant to the curation task and in about 65% of the cases, the highlights are sufficient to support knowledge curation task without the need to consult the full text.
Conclusion Our initial results are encouraging and we believe that the results presented are a promising first step to automatically preparing PDF documents to speed up the curation process and consequently lower costs in projects such as ApiNATOMY.
Abstract no. 265 Machine learning analysis substantiates importance of inter-individual genetic variability in PPAR signalling for brain connectivity in preterm infants
Michelle Krishnan, Paul Aljabar, Zi Wang, Gareth Ball, Serena Counsell, Giovanni Montana, and David Edwards, King’s College London, London
Ghazala Mirza, University College London, London
Alka Saxena, Guy’s and St Thomas’ NHS Foundation Trust, London
Introduction The incidence of preterm birth is increasing, with a high proportion of survivors experiencing motor, cognitive and psychiatric sequelae. Prematurity places newborn infants in an adverse environment accentuating their individual ability to cope with systemic challenges, and calls for precision in healthcare interventions. Machine learning strategies are used here to investigate the neurobiological consequences of prematurity. Given the establishment of a large genetic contribution to quantitative neuroimaging features informative of downstream function, and the assumption that a subset of genetic markers will be found in statistically meaningful association with a subset of image features, computational models must be able to select those informative variables. Multivariate sparse regression models such as the sparse Reduced Rank Regression method (sRRR) obviate the need for multiple-testing correction and significance thresholds, since this involves fitting a predictive model using all SNPs and ranking them based on their association to the image features (Vounou et al., 2010, Vounou et al., 2012).
Method 272 infants (mean gestational age (GA) 29+4 weeks) had magnetic resonance (MR) imaging at term-equivalent age (mean post-menstrual age (PMA) 42+4 weeks). 3-Tesla magnetic resonance images were used for probabilistic tractography (Robinson et al., 2008), using a 90-node anatomical neonatal atlas (Shi et al., 2011) and custom neonatal registration pipeline (Ball et al., 2010). A weighted adjacency matrix of brain regions for each infant was converted into a single vector of edge weights based on fractional anisotropy (FA), resulting in one matrix of n individuals by q edges, where n = 272 and q = 4005, adjusted for major covariates (post-menstrual age at scan (PMA), gestational age at birth (GA)) and ancestry. Saliva samples were collected using Oragene DNA OG-250 kits, and genotyped on Illumina HumanOmniExpress-24 v1.1 chip. The genotype matrix was converted into minor allele counts, including only SNPs with MAF ≥5% and 100% genotyping rate (556 227 SNPs). sRRR model parameters: SNPs at each iteration (n = 500), stability selection with 1000 subsamples of size 2/3 subjects, convergence criterion = 1x10⁻⁶, resulting in a ranking of all genome-wide SNPs based on their importance in the model. A null distribution was computed by running sRRR in the same way, additionally permuting the order of subjects within the phenotype matrix between each subsample during stability selection with 20 000 subsamples.
Results sRRR detected a stable association between SNPs in the PPARγ gene and the imaging phenotype fully adjusted for GA, PMA and ancestry. SNPs in PPARγ were significantly over-represented among the variables with the uniformly highest ranking in the model, contributing to a broader significant enrichment of lipid-related genes among the top 100 ranked SNPs.
Discussion In concordance with findings from two previous independent studies of a comparable cohort (Krishnan et al., 2016, Boardman et al., 2014), these results suggest a consistent association between inter-individual genetic variation in PPAR signalling and diffusion properties of the white matter in preterm infants.
Conclusion This provides specific insight into how nutrition might be tailored with precision according to each infant’s genetic profile to optimize brain development.
Abstract no. 267 Usability across health information technology systems: searching for commonalities and consistency
Ross Koppel, University of Pennsylvania, Philadelphia, USA
Craig Kuziemsky, University of Ottawa, Ottawa, Canada
Introduction HIT usability issues remain a prominent source of medical errors and other unintended consequences. While research has identified usability issues in a single system or setting, the challenge of usability across a range of systems remains problematic. Patient care increasingly occurs across multiple providers, settings and HIT systems, and thus usability must be considered not just for one system, but across several systems and users. Functions or features in HIT (e.g. data retrieval or display) may not be designed consistently across systems and this can lead to errors and other unintended consequences.
Methods To examine the variables and interactions of how specific usability issues vary across different clinical systems we constructed a matrix of 11 usability dimensions and contextual differences. We built the matrix from the literature and from our collective 52 years of surveys, observations, shadowing clinicians, usability studies, etc. For this poster, we select four key usability dimensions and discuss how they contribute to the silent error of information retrieval. We also shall illustrate each of these with screen shots and analyses.
Results Finding patients and data reflects inconsistent navigation and search functions. Such problems are at least inefficient, and at worst, lethal. Inconsistent data displays, e.g., fonts, colours, metrics and interfaces etc. vary dramatically across systems. Providers become comfortable viewing data in a specific context and may be confused when the display changes. Last, the number of screens and patient charts open at once—presents patient safety dangers and trade-off. Each additional chart or screen increases the probability of entering an order into the wrong patient chart or reading data from the wrong patient chart.
Discussion We sought to examine multi-setting, multi-systems, and multi-user matrix of usability dimensions and contexts. The proposed research will hopefully encourage a more panoptic design of HIT software by incorporating the need to focus on usability across several facilities and many software vendors’ products.
Conclusion HIT systems and functions will always be emergent, interactive and multifaceted. To make the systems useable across many settings and many users, vendors will have to incorporate equally emergent, multi-context and multifaceted approach to usability.
Abstract no. 273 Mobile applications to support depression self-management: a review of apps
Sharareh R. Niakan Kalhori and Hajar Hasannejadasl Farhad Fatehi, Tehran University of Medical Sciences, Tehran
According to the World Health Organization 33% of the years lived with disability (YLD) are attributed to neuropsychiatric disorders. WHO estimated that globally 350 million people suffer from depression. The effect of this burden on society is overwhelming. Meanwhile, self-management is an important aspect of required care in long-term disorders and diseases management. mHealth based tools such as smartphone applications have been recommended as new tools to support self-management in depression. In this review we assess on mobile application apps were focused on depression in English. Evaluation conducted based on 7 functionalities (such as inform, instruct). Of 251 potentially relevant apps, 68 met our inclusion criteria. However for self-management assessment 7 applications had the minimum eligibility. Given the complex challenges faced by patients with depression, there is a need for further app development targeting their needs. In addition development of multifunctional apps is required to support the management of depression along with other related mental disorders such as anxiety and stress concurrently.
Abstract no. 281 Predictive factors associated with intensity of physical activity of 12 month infants in environment of healthy living cohort study
Haider Raza, Gareth Stratton, and Ronan Lynos, Swansea University, Swansea
Shang-Ming Zhou, Swansea University Medical School, Swansea
Sinead Brophy, FARR Institute (CIPHER - Swansea), Swansea University, Swansea
Introduction It is well-recognized that physical-activity (PA) plays an important role in enhancing and maintaining health-related behaviors in children1. This study aims to examine factors associated with high-level PA at age 12 months compared to those who are relatively inactive.
Methods The Environments for Healthy-Living, Growing up in Wales cohort study collected questionnaire data and postnatal notes and linked this data with general practice and hospital admission records. In addition, a total 148 out of 800 infants wore a tri-axial GENEActiv accelerometer on their ankle to collect the physical activity data2 over 7 consecutive days. Activity was measured in the sum of vector (SVM) magnitudes and the population was divided into two using the median from a lower activity and a higher activity group. Important predictive factors were identified for a linear regression model to predict the PA levels.
Results The mean SVM score in lower active group ranged from [0.677, 4.932] SVM magnitude and in active group from [4.975, 10.628] SVM magnitude. Infants in the active group were more likely to be boys (i.e. 70.42% boys and 29.58% girls), whereas in the inactive group (i.e. 38.57% boys and 61.43% girls). Active infants have a longer gestation, more milk feeds per week, more likely to be breastfed for longer, more active at night, and drink more juice. There were significant differences between lower and higher active infants groups on the following factors defined by mean difference (MD) and confidence interval (CI)): mother gestation days (MD: -9.7 days, CI: [-16.235, -3.167]), where there is 12.8% of preterm birth (i.e. 260 days) in lower activity level and no such case exists in higher activity group, number of milk feed per week (MD: -2.923, CI: [-5.574,-0.272]), last breastfeed in weeks (MD:-7.877, CI:[-14.350, -1.404]), mean SVM of baby during night (i.e. 7:00 PM to 7:00 AM) (MD: -1.750, CI: [-2.5356, -1.234]), number of night walks per night (MD: 0.58, CI: [0.061, 1.091]), number of juice taken per week (MD: 1.076, CI: [0.025, 2.216]). Moreover, in the higher active group, 84.85% of mothers tried to breastfed their babies, whereas in the lower active group this percentage was reduced to 77.61%.
Conclusion There is a great deal of variability in the level of activity in different children. The active children are more likely to be those who are full-term, breastfed, active at night, and take juice. There was no significant effect on the size of the baby on the activity level however, the preterm birth is associated with lower activity level. The important factors identified by this study would benefit health decision making in promoting healthier lifestyles for infants and their mothers.
References
Pawlowski et-al, “Children’s physical activity behavior during school recess: a pilot study using GPS, accelerometer, participant observation, and go-along interview,” PLoS One, vol. 11, no. 2, pp. 1–17, 2016.
Morgan et-al , “Physical activity and excess weight in pregnancy have independent and unique effects on delivery and perinatal outcomes,” PLoS One, vol. 9, no. 4, pp 1–8, 2014.
Abstract no. 284 Dementia severity and progression: identifying those most at risk for rapid cognitive decline
Elizabeth Baker, Ehtesham Iqbal, Caroline Johnston, and Stephen Newhouse, Department of Biostatistics and Health Informatics, King’s College London, London
Matthew Broadbent, NIHR Biomedical Research Centre for Mental Health, King’s College London, London
Hitesh Shetty, South London and Maudsely NHS Foundation Trust, London
Robert Stewart, Department of Psychological Medicine, King’s College London, London
Robert Howard, Division of Psychiatry, University College London, London
Mizanur Khondoker, Department of Population Health and Primary Care, University of East Anglia, Norwich
Steven Kiddle, King’s College London and MRC Biostatistics Unit, London
Richard Dobson, Department of Biostatistics and Health Informatics, King’s College London, London
Introduction Stratifying patients based on predicted future rate of decline would help in the design of clinical trials. Trajectory modeling to detect patterns of decline is a challenge when little information on disease stage is available. The relationship between the rate of progression and disease severity can be used to identify dementia patients deviating from the expected pattern of change.1 Applying this approach with a cognitive phenotype has not yet been explored but could be used to identify those most at risk for faster cognitive decline.
Methods Due to the challenge of identifying a cohort with sufficient length of follow-up to effectively study disease progression, this study turned to the secondary use of electronic health records. Specifically, a retrospective cohort was derived from South London and Maudsley NHS Foundation Trust health records comprising 3441 subjects with at least 3 MMSE scores recorded over 5 years. Residuals from the relationship between cognitive decline and disease severity were grouped into tertiles of average, slower and faster progression. Subject characteristics were explored for association with group membership by multinomial regression. Characteristics including demographics, items from the Health of Nation Outcome Scales (HoNOS) and promising repurposing medications for dementia2 were available for comparison across groups.
Results A quadratic relationship between the rate of cognitive decline and disease severity was observed in this health record-derived cohort. In the multinomial regression analysis, HoNOS items indicating presence of Hallucinations (and/or delusions) [Relative risk ratio (RRR) = 1.5, 95% Confidence Interval (CI) 1.1-2.05] and presence of cognitive problems [RRR = 1.57, 95% CI = 1.24-1.98] were associated with an increased risk of being in the faster progression group. Prescription of Olanzapine [RRR = 2.49, 95% CI = 1.43-4.35] and HoNOS item for the presence of problems with work or leisure activities [RRR = 1.31, 95% CI = 1.01-1.7] were associated with a higher risk of being in the slower progression group. Prescription of Galantamine was associated with being in the slower progression group compared to the average group [RRR = 0.481, 95% CI 0.292-0.792].
Discussion A presence of psychotic symptoms and prescription of antipsychotic medications showed increased risk of being in both the fast and slow progression groups. This may reflect differences in reporting of psychotic symptoms and possible early monitoring of dementia in patients with other mental health difficulties. Further exploration and replication in the Camden and Islington NHS Foundation trust health records are underway.
Conclusions This study demonstrates how health records can be used to suggest potential relationships between patient characteristics and future disease progression.
References
Villemagne, V. L, et al, Australian Imaging, Biomarkers and Lifestyle Study of Aging group. Amyloid beta deposition, neurodegeneration, and cognitive decline in sporadic Alzheimer’s disease: a prospective cohort study. Lancet Neurol 2013 12(4), 357-367.
Appleby BS, et al, A Review: Treatment of Alzheimer’s Disease Discovered in Repurposed Agents. Dementia and geriatric cognitive disorders. 201335:1-22.
Abstract no. 289 Steps to modeling of physical-activity-related adherence in patients with heart disease. Literature review on adherence influence factors
Kristina Livitckaia, Nicos Maglaveras, and Ioanna Chouvarda, Aristotle University of Thessaloniki, Laboratory of Computing and Medical Informatics, Thessaloniki
Introduction The problem of patient adherence is becoming alarming in the medical practice worldwide. Formation of patient adherence (PA) depends on many factors. Specifically, there is limited data on PA to particular lifestyle recommendations. Considering physical activity and exercise as an essential part of lifestyle to control cardiovascular disease (CVD) and prevent its further progression, the review was focused on discovering the factors associated with physical-activity-related adherence in a group of patients with CVD that can be used under eHealth interventions development. The objectives of the review included: (a) identification of types of physical-activity-related behaviour and its settings, (b) assembling adherence measurement criteria, (c) identification and classification of factors affecting adherence.
Methods A comprehensive literature review was conducted based on the scoping studies approach1. Where applicable, the systematic review methods were used to narrow and increase the quality of the final results. The MEDLINE database and the Cochrane Library were accessed between March and August 2016. Out of original 277 yielded publications, 58 were included for further analysis. Considering the manual search queries, 5 relevant papers were added to the final results.
Results PA is an indicator of the performed level of physical activity in everyday life, as well as during cardiac rehabilitation. Attention was paid to the perspectives from which the term was considered in the selected studies. In regard to adherence, the types and settings of physical-activity-related behaviour were determined and classified. Finally, the measure instruments used up to date for adherence were overviewed and briefly described. Patient adherence to physical-activity-related behaviour reflects a complex interaction of different factors. Examined factors have been classified with regard to the nature of its origin and association to PA. Statistically significant factors and their influence on PA to physical-activity-related behaviour are discussed in the review.
Discussion Intervention settings: Majority of the interventions was heterogeneous and not comparable with regard to participants’ characteristics, types and settings of physical-activity-related behavior, and intervention settings. Patient adherence: The selected studies provide different types and dimensions of adherence, depending on the particular behaviour, measurement methods and instruments. Associated actors: The biggest challenge in understanding the influence of certain factors is that adherence is multifactorial.
Conclusion Intervention classification: There is a need for intervention classification, the results of which could be used in the design of eHealth interventions. Modifiable factors analysis: Actuality for dividing factors to modifiable and non-modifiable, from the perspective of eHealth interventions development, requires further investigation. Prediction algorithm: Attention has to be given to the eHealth interventions that already exist in the clinical practice. Together with the recent results, it may serve a solid background for the development of the prediction algorithm for early identification and prognosis of patients’ (non-) adherence.
Reference
H. Arksey and L. O’Malley (2005) “Scoping studies: towards a methodological framework”, Int. J. Soc. Res. Methodol., 8(1):19–32.
Abstract no. 294 Intensive care decision making: acute physiology and chronic health evaluation II vs. simplified acute physiology score II: a prospective cross-sectional evaluation study.
Alireza Atashi and Mirmohammad Miri, Mashhad University of Medical Sciences, Mashhad
Zahra Rahmatinezhad, Breast Cancer Research Center, ACECR, Tehran
Saeid Eslami, Student Research Committee, Department of Medical Informatics, Faculty of Medicine, Mashhad University of Medical Sciences, Mashhad
Masoumeh Sarbaz, Shahid Beheshti UMS, Tehran
Introduction Accurate outcome prediction by the means of available clinical contributing factors will support researchers and administrators in realistic planning, workload determination, resource optimization, and evidence-based quality control process. This study is aimed to evaluate APACHE II and SAPS II prediction models in an Iranian population.
Methods To calculate APACHE II and SAPS II for all consecutive patients admitted to intensive care units, a prospective cross-sectional study was conducted in four tertiary care referral centers located in the top two most populated cities in Iran, from August 2013 to August 2015. The Brier score, Area Under the Receiver Operating Characteristics Curve (AUC), and Hosmer-Lemeshow (H-L) goodness-of-fit test were employed to quantify models’ performance.
Results A total of 1799 patients (58.5% males and 41.5% females) were included for further score calculation. The Brier score for APACHE II and SAPS II were 0.17 and 0.196, respectively. Both scoring systems were associated with acceptable AUCs (APACHE II = 0.745 and SAPS II = 0.751). However, none of prediction models were fitted to dataset (H-L ρ value < 0.01).
Conclusion With regards to poor performance measures of APACHE II and SAPS II in this study, finding recalibrated version of current prediction models is considered as an obligatory research question before applying it as a clinical prioritization or quality control instrument.
Abstract no. 308 Subgroup biomarker identification: an information theoretic insight
Emily Turner and Konstantinos Sechidis, University of Manchester, Manchester
Paul D. Metcalfe, Advanced Analytics Centre, Global Medicines Development, AstraZeneca, Cambridge
James Weatherall, Advanced Analytics Centre, Global Medicines Development, AstraZeneca, Alderley Park
Gavin Brown, School of Computer Science, University of Manchester, Manchester
Our work provides a theoretical and experimental comparison of three prominent methods for exploratory subgroup identification. We provide an information theoretic interpretation of the problem and connect it with the three methods. We believe that this interpretation brings additional clarity to the comparison. Our conclusions are that Virtual Twins (Foster et al. 2011) performs best by several measures. However, it appears to have weaknesses in distinguishing between predictive and prognostic biomarkers.
Abstract no. 311 Use of cognitive and behavioral theory in clinical decision support systems: systematic review
Stephanie Medlock and Ameen Abu-Hanna, Academic Medical Center, Amsterdam
Introduction Decision support is widely regarded as one of the most promising means for information technology to improve care. However, to date, its ability to live up to that promise has been inconsistent. The recently-published “Two Stream Model” proposes that decision support can be described in terms of the clinical stream (reasoning about what advice to present) and the cognitive stream (reasoning about how to present that advice to the user). It suggests that cognitive/behavioural knowledge should be used to determine what support the user needs and how the system should provide it. The objective of this review is to evaluate whether and how knowledge from three diverse areas of cognitive science - descriptive decision theory, human-computer interaction, and behaviour change theory - have been applied or proposed for application to the field of computerized clinical decision support.
Methods A search was conducted for each of the three areas of cognitive/behavioural science by a Master’s student in Medical Informatics. The searches used Medline (all searches), Google Scholar (for human-computer interaction) and Embase (for behaviour change theories) and followed the general form: ((area of cognitive-behavioural science) and (decision support)). The searches were conducted in January 2016. Articles were included if they described a computerized decision support system, or a proposal for designing such systems, and described the use of a descriptive decision theory, human-computer interaction, or behaviour change theory in the design or evaluation of that system. Papers which used one of these approaches exclusively to analyze the results of a usability evaluation were excluded. Data were extracted on the study year, the cognitive/ behavioural theory used, how it was used, and the decision support system where it was applied. Data extraction was checked by a second reviewer.
Results A total of 15 studies were included: 5 incorporating descriptive decision theory, 5 using human-computer interaction, and 5 using behaviour-change theory. The studies using descriptive decision theory mainly used methods from this field (cognitive task analysis and theory of situation awareness) to collect observations used in system design. One study used Norman’s Theory of Action to categorize system use problems in evaluation of an existing system. Knowledge from human-computer interaction was used in both design and evaluation. Two proposed general principles for the design of systems, two described observation methods during evaluation, and one proposed a tool for evaluating human factors principles in medication alerts. Behaviour change theory was used exclusively in the design of patient-oriented systems, mainly for smoking cessation (4 studies). Four employed the trans-theoretical model one used the PRIME theory.
Conclusions Although these results should be considered preliminary due to the limitation that each search was carried out by a single researcher, these results suggest that knowledge from the field of cognitive and behavioural science has seen only limited use in the field of clinical decision support systems. These three areas of cognitive science were chosen due to their clear relevance to the field of decision support. However, further research should extend this to other areas of cognitive/ behavioural science.
Abstract no. 318 The RADAR Platform: an open source generalized mhealth data pipeline
Francesco Nobilia, Maximilian Kerz, and Richard Dobson, Department of Biostatistics and Health Informatics, Institute of Psychiatry Psychology and Neuroscience, King’s College London, London
Joris Borgdorff, Maxim Moinat, and Nivethika Mahasivam, The Hyve, Utrecht
Herculano Campos, Goldenarm, New York
Mark Begale, Vibrent Health, Fairfax
Amos Folarin, Farr Institute of Health Informatics Research, UCL Institute of Health Informatics, University College London, London
Introduction We are presently witnessing a new epoch in the evolution of mobile technologies defined by the proliferation of network aware, compute capable devices dubbed the ‘IoT Age’. A distinct category of these are personal wearable devices or ‘wearables’ which have an enormous potential application in the fields of healthcare and medical research. Real time data streaming capabilities represent an innovative and promising opportunity for mobile health (mHealth) applications based on remote sensing and feedback. The €22m IMI2 Remote Assessment of Disease and Relapse – Central Nervous System (RADAR-CNS http://radar-cns.org) initiative is a new research programme aimed at developing novel methods and infrastructure for monitoring major depressive disorder, epilepsy, and multiple sclerosis using wearable devices and smart-phone technology. While a number of commercial mHealth solutions are available to aggregate sensors data, there is a lack of an open source software stack that provides end-to-end data collection functionality for research, clinical trials and real-world applications. The RADAR platform aims to fill exactly this gap, providing generalised, scalable, fault tolerant, high-throughput, low-latency and data collection solution.
Methods By leveraging open source data streaming technologies, we are building an end-to-end system with generalized aggregation capabilities. The platform will focus on classes of data rather than specific devices, in doing so it will enhance modularity and adaptability as new devices become available. The platform is delivered under open source licence in order to create a legacy to downstream RADAR projects and the wider mHealth community. The key components of our software stack include: Data Ingestion and Schematisation (using Apache AVRO), Database Storage and Data Interface, Data Analytics, Front-end Ecosystem, Privacy and Security.
Results We have utilised the Confluent Platform as a core component, this is a new open source suite of tools built on top of Apache Kafka. At fixed intervals of time, the patients’ data sources collect data representing the patient’s attributes by passive (e.g. from hardware sensor streams) or active (e.g. questionnaires, assessments apps) ways. These attributes are then ingested via an HTTPS interface which translates REST calls in native Kafka calls. After a restructuring phase, data (both real-time and historical) are simultaneously analysed and persisted. Two different data warehouse layers (cold and hot storage) are deployed to provide low latency and high performance data access via controlled interfaces.
Discussion So far, we have demonstrated integration of the Empatica E4 wearable device and on-board smartphone sensors as examples of passive data sources and a Cordova questionnaire app builder as an example of an active remote monitoring data sources. Low latency data access tools and REST APIs serve as downstream generalised data access interfaces, examples of which are modular data visualisation tools.
Conclusion RADAR-CNS aims to improve patients’ quality of life, through self-management for example, and potentially change how these and other chronic disorders are treated. Its vision is to reduce: i) cost ii) trauma to the patients and carers iii) hospitalisations, by predicting and pre-empting relapses and recurrences via the use of remote assessment technologies.
Abstract no. 323 Mapping clinical care and research data to HL7 FHIR to improve sharing and reuse
Hannes Ulrich, Ann-Kristin Kock-Schoppenhauer, Björn Andersen, Petra Duhm-Harbeck, and Josef Ingenerf, Universität zu Lübeck, Lübeck
Introduction The increased adoption of electronic health records (EHRs) could enable better care for patients by sharing the collected clinical data between care providers and besides better clinical research through secondary use of EHR data. Clinical research is highly dependent on this data, such as demographic information, clinical data, or device observations. Every medical centre in the western world maintains a hospital information system (HIS), usually consisting of many subsystems, that support the clinical workflow, patient safety, and legal demands. Especially in university hospitals, physicians often have obligations in addition to clinical routine: In cooperation with other scientists they conduct clinical or experimental research.
Method In order to ensure the reproducibility of research results and for preserving raw data, the general trend favours the pooling of research data in standardized formats. The emerging HL7 Fast Healthcare Interoperability Resources (FHIR) aims to increase interoperability, information integrity, as well as the implementability of data exchange tasks in the healthcare and research IT environment. With focus on the research platform system CentraXX (Kairos GmbH) for biobank and study management, HL7 FHIR is used in this work to improve the semantic integration, (re-)use of relevant data and for connecting point-ofcare medical data. The transition from the research platform to the central clinical repository is desired to be simple, robust, and direct. In order to align and to map the proprietary CentraXX data model to FHIR resources, the underlying relational database schemata were analysed to specify the scope and the requirements for the desired mapping. In the following step, the list of HL7 FHIR resources was reviewed, considering the usage, limitations, and relationships of each.
Results Regarding the fast development of HL7 FHIR, we decided to use a pre-released standard for trial use in version 3 (STU3) in anticipation of upcoming resources changes. Therefore, our mapping can easily be adjusted to the impending update. Eight suitable resources were identified: Patient, Encounter, Observation, Condition, Procedure, Diagnostic Report, Specimen and Consent. Some values are initially missing in the Patient resource, so a specific profile was created to represent the patients’ nationality and blood group.
Discussion Any mapping relies on the experts who design the mapping. The validation of the mapping was performed by one medical expert and one technical expert independently, which agreed despite of minor differences. So, a clinical repository allows for the reuse of data, yet the threat of misinterpretation of the data remains. Despite our efforts, there is no complete certainty that the acquisition context and purpose is fully represented in the repository. To minimize this threat, further tools and data quality monitoring efforts are required.
Conclusion The comprehensive clinical repository introduced in this paper combines patient demographic and clinical data including device observations in a standardized way. The data collected along the way of a patient’s progression through the healthcare system can thus now be reused for further research projects. As all information is represented in a standardized way, the exchange and pooling of data is significantly simplified.
Abstract no. 332 Addressing SNOMED CT description logic modelling errors in issues with finding site
Heike Dewenter and Sylvia Thun, Niederrhein University of Applied Sciences, Krefeld
Kai U. Heitmann, HL7 Deutschland e. V., Köln
Introduction The use of SNOMED CT in medical coding is constantly progressing on an international level.1 However, description logic modelling errors related to the hierarchical structure have been described before on aspects of anatomy and clinical findings. Examples for problem types are especially “issues with site and resulting interferences”.2 We present an additional approach to address SNOMED CT logic modelling errors that affect issues with finding site. Our entry point for improvement is primarily substantial and focuses on concept definitions provided by literature.
Methods For examining exemplary description logic modelling errors, we use the SNOMED CT International Version 20160731. We take the concept |414086009|Embolism (disorder)|, that is erroneously defined as a |19660004|Disorder of soft tissue (disorder)|. After the analysis of associated concept definitions for “embolism” and “soft tissue”, the hierarchical connections are adjusted.
Results In SNOMED CT, there is the distinction between |414086009|Embolism (disorder)| and 55584005|Embolus (morphologic abnormality)|. Embolism is defined as a condition where the blood flow in an artery is blocked by a foreign body. Soft tissue includes all kinds of tissues inside the body, except bone. To improve the modelling, we take an alternative definition of “embolism” connected to the specification of a certain finding site, especially in the bloodstream.3 According to this definition and with the intention to include the “site aspect”, it seems rather an option to create a new hierarchical connection that defines:
|414086009|Embolism (disorder)| is a |43195004|Bloodstream finding| is a |118234003|Finding by site|.
Discussion In clinical practice, embolism is considered as a finding of the blood stream rather than a soft tissue disorder. Soft tissue seems to be unsuitable as a classifier concept because of the broad term definition. The finding site is needed to indicate the location of embolism that is the cause of the incorrect classification. In order to rearrange the hierarchy, the finding site of blood vessel has to be changed to enable the expected description logic modelling result.
Conclusion It will be a considerable huge effort to filter all concepts that seem to have an “issue with site”, with regard to the definition of the term ‘soft tissue’. However, the assignment of new or alternative parent concepts will not solve the problem. It is not ideal to declare all embolism disorders as primitive concepts. It seems to be the best option to limit the content improvement on single use cases and to get more evidence on whether keeping soft tissue disorder as a classifier or to retire it.
References
Lee D et al. Literature review of SNOMED CT use. J Am Med Inform Assoc. 2014 Feb 21(e1): e11–e19
Rector AL et al. Getting the foot out of the pelvis: Modelling problems affecting use of SNOMED CT hierarchies in practical applications. J Am Med Inform Assoc. 2011 Jul-Aug 18 (4):432-40
Dorland’s. Dorland’s Illustrated Medical Dictionary (32nd edition). 2012. Elsevier. p. 606.
Abstract no. 341 Big difference? Harnessing big data for two of the world’s largest biobanks
Sam Sansome and Ligia Adamska, University of Oxford, Oxford
Introduction The University of Oxford is engaged with some of the world’s largest population-based, prospective studies. The UK Biobank (UKB) and China Kadoorie Biobank (CKB), each of which recruited over half a million participants, will be based at the University of Oxford’s Big Data Institute (BDI). The BDI will be directed at obtaining and characterising large data-sets to significantly alter our understanding of the causes and treatment of disease. Both studies will have a unique opportunity to share what they have learnt from each other and to identify new opportunities in the future.
Methods UKB and CKB both recruited half a million middle aged participants between 2004 and 2010. Participants were selected from different regions across the UK and China, and have undergone extensive baseline measures, provided blood and urine for future analysis and gave detailed information about themselves. Participants’ health outcomes will be closely followed over the next few decades through linkage with established death and disease registries, and national health databases. Both studies run periodic repeat assessments on a subset of their cohorts and implement project enhancements such as genotyping, physical activity assessment, biochemistry, proteomics and new web-based questionnaires to collect even more data on their participants.
Results Collectively, both biobanks have combined health-related data on over a million people, stored over 3.5 million blood samples and have linked participants to 45,000 death records, 100,000 cancer records and 1.5 million hospital admission and health records. UKB is an open access resource with over 3,619 registered researchers, 343 projects underway and 1,256 released datasets. CKB has its own researchers in the UK and China, and it is only just starting to make its data available to the public. CKB now has over 300 registered researchers.
Discussion Whilst the two studies began with separate operating and funding models, we have identified many opportunities to share methodologies such as genetic assays, record linkage, encryption, anonymisation and delivery of research datasets.
We are looking for further opportunities to explore new and novel big data opportunities by working closely together. We have begun sharing our knowledge and experience with integration of new data sources such as physical activity monitors, electronic data capture devices, imaging data, outcome adjudication and linkage of our participants to air pollution and other meteorological data.
We are also collaborating and attracting the attention of other departments within the university to develop machine learning techniques on data such as the ECG to predict future outcomes for our participants and validate these through our continual follow-up.
Conclusion These two studies are powerful resources for investigating the main causes of many common chronic diseases over the next few decades, and the information generated will advance our understanding of disease aetiology in the UK, China and in other countries. This collaboration also presents an invaluable opportunity for sharing of methodologies related to integration, processing, dissemination and storage of health-related data. This has led to high quality research and contributed immensely to understanding of disease and contributing factors.
Abstract no. 353 Patient flow modelling and scheduling using point interval temporal logic
Irfan Chishti, Artie Basukoski, and Thierry Chaussalet, University of Westminster, London
It has been increasingly recognized that a consistent process model and its implementation, such as a simulation, can be instrumental in addressing the multi-faceted challenges health care is facing at present and more importantly in the future. However, current modelling and scheduling techniques are intuitive normally depicted as flowcharts or activity diagrams. These diagrams provide vague descriptions that cannot fully capture the complexities of the types of activities, and types of temporal constraints between them, i.e. finish-start barrier, which are essential for the application of the critical path method(CPM) and project evaluation review technique (PERT). This paper proposes a framework to model patient flows for precise representation based on point interval logic (PIL). The framework consists of steps that can be applied to transform activity diagrams to a Point Graph (PG) which has a formal translation to PIL. We will briefly evaluate an illustrative discharge patient flow example initially modelled using Unified Modelling Language Activity Diagram (UML AD) with the intention to compare with the technique presented here for its potential use to model patient flows.
Abstract no. 357 Impact of linkage error in a national mother-baby data linkage cohort
Katie Harron and Jan van der Meulen, London School of Hygiene and Tropical Medicine, London
Ruth Gilbert, University College London, London
Introduction Linkage of administrative data is an important tool for population-based epidemiological analyses. Evidence suggests that errors in linkage disproportionally affect particular subgroups of individuals, yet records that fail to link (missedmatches) are typically discarded and not used in analysis. This means linked dataset may not be representative of the study population and may produce biased results for research or service evaluation. We explored the impact of linkage error in a previously linked, population-based cohort of mothers and babies.
Methods We used a gold-standard subset of data from 15 NHS maternity units for 2012 to 2013, to validate previous mother-baby linkage within national hospital admission data for England (Hospital Episode Statistics HES). We compared characteristics of the gold-standard data and linked data. We also explored the effect of a more conservative linkage approach, aiming to limit the false-match rate (where baby records link to the wrong maternal record).
Results Of 72,824 records in the gold-standard dataset, 632 (0.9%) were false-matches and 297 (0.4%) were missed-matches in the original linked mother-baby HES data. Using the conservative probabilistic linkage algorithm resulted in fewer false matches (212 0.3%) but substantially increased the number of missed-matches (7,797 10.7%). Records that failed to were more likely to have missing data, and be of lower birthweight and gestational age, or still births.
Discussion Quality of linkage in the national mother-baby dataset is high, but specific subgroups of interest are less likely to link due to poorer data quality. Reducing the false-match rate disproportionately affects the number of unlinked records and restricts the number of records available for analysis.
Conclusion Since linkage error and missing data are intertwined, future research will explore the potential for statistical methods such as multiple imputation to account for bias due to both missing data and missed-matches. Additional methods are required for identifying and handling bias arising from false-matches.
Abstract no. 364 Design of the rural health centres locating model using Geographic Information Systems
Marzieh Saremian, Lorestan University of Medical Sciences, Khorramabad
Reza Safdari and Marjan Ghazisaeedi, Tehran University of Medical Sciences, Khorramabad
Abbas Sheikhtaheri, Iran University of Medical Sciences, Khorramabad
Introduction Lack of health services, especially in rural areas, small towns and poor areas, will bring a lot of negative consequences. In recent years, the use of information and communication technologies in healthcare, improve the quality of health care. Because the health of society depends on the health service centres, and health centres directly involved in providing the health of individuals and society, so easy and timely access to these centres is essential. The decision about the construction of health centres based on the number, density and health problems of people and type of provided services, are issues that Geographic Information Systems (GIS) can help to solve them through spatial analysis. A part of the GIS software package is Model Builder. This is the tools to create, modify and manage the models. Therefore, the use of GIS in the establishment and distribution of health services, particularly in rural health centres, increases efficiency in the field of healthcare.
Method In this applied research, the rural health centres locating model was designed using GIS software. At first, the study area’s maps, using GIS and application of Georeferencing and Digitizing functions, were prepared. Further, for effective locating criteria and sub-criteria for rural health centres, separated layers were defined. For such actions, we used Arc Map, Arc Catalog and Arc toolbox environments of Arc GIS (version 9.3). Then using the maps and layers, we designed the model by defining inputs, outputs and processes in the model builder environment of GIS.
Result In order to design the locating model, initially in Arc Catalog, a Toolbox was built. Then in the Arc Map and by Model Builder, the model was designed. The designed model allow that by entering maps and information layers, and run the model, the needed analysis for optimal locating carried out. Finally, a map was prepared that indicated the possibility of appropriateness to establish the rural health centres in the study area.
Conclusion The use of technology such as GIS in locating of rural health centres, can improve the quality of planners’ work, as well as enhance the quality of people life, particularly people those living in rural and remote areas that are deprived of many resources, especially in the health field. Future plan: The use of GIS in locating of health centres and hospital is recommended. Also it is recommended that Proper distribution hospitals and other health centres be reviewed so that if necessary, appropriate measures carried out.
Abstract no. 365 Application and reuse of metadata for healthcare quality indicators
Pam White, Kent County Council, Maidstone
Abdul Roudsari, University of Victoria, Victoria
Introduction There have been numerous simultaneous quality initiatives in the United Kingdom’s National Health Service (NHS), including Payment By Results, the Quality, Innovation, Productivity and Prevention programme and the NHS Quality and Outcomes Framework1. When more than one governing body issues similar quality indicators, they are prone to inconsistencies in formatting and may overlap in content.
Method We developed a pilot ontology that specifies inclusion and exclusion criteria, along with relationships between quality indicators and categorises of indicators. Our ontology is intended to make components of the indicators searchable. We recorded metadata, sourced from NHS Digital, for a set of 222 quality indicators2 in the ontology. We explain further detail about conceptualisation of the ontology in a separate article.3
Results Inconsistent/incomplete metadata for some indicators contributed to inconsistent definitions for properties, including Source and Formula. Some indicators were part of a named set. Some were single indicators. Indicator set names were not standardised. The source for one set was sometimes listed as ‘UK Renal Registry’. Other times, it was listed as ‘National Renal Dataset’. The formula metadata supplied by NHS Digital was inconsistent, sometimes with just a referring URL and other times with extensive detail that included non-formulaic information. The referring URL was occassionally a broken link and no formula could be found. Other links led to a general website, with no clear link to methodology. The formula was sometimes more clearly presented in the other sections of the NHS Digital metadata than in their Formula section.
Discussion NHS Digital’s Metadata Library Guide for the indicators was largely based on the United Kindgom’s e-Government Metadata Standard.4 In practice, the guide includes vague explanations for some metadata elements. The International Federation of Library Association’s5 Statement of International Cataloguing Principles could be used as a starting point to develop standards for metadata for quality indicators. A companion guide to these principles, Resource Description and Access, has been made available by the Joint Steering Committee for Development of RDA.6
Variations in origin and complexity of the indicators may count for some inconsistencies we found in the metadata from NHS Digital. It is difficult to standardise metadata for formulae for indicators developed outside a descriptive framework, due to differing calculation methods. The US National Quality Forum7 has developed a framework for health indicator metadata, based on data available in electronic health records. Alternatively, a diverse set of quality indicators may be represented with components of indicators described separately with names or codes of separate metadata elements summarised in the Formula metadata field.
Conclusion Consistent and accurate metadata to support access to quality indicators is crucial to establishing indicator interoperability. The recommendations in this paper pertain to metadata for identifying healthcare quality indicator source and formula. Further exploratory work to analyse descriptive information about other indicator sets could inform the development of international guidance for quality indicator metadata.
References
http://www.nhsemployers.org/
https://mqi.ic.nhs.uk/IndicatorsList.aspx
Stud Health Technol Inform. 2015208:347-51.
http://www.esd.org.uk/standards/egms/
http://www.ifla.org/files/assets/cataloguing/icp/icp_2009-en.pdf
http://www.rda-jsc.org/docs/5rda-objectivesrev3.pdf.
http://www.qualityforum.org/WorkArea/linkit.aspx?LinkIdentifier=id&ItemID=22019
Abstract no. 370 Quanti-Kin Web: a web tool for ELISA assay processing
Mauro Giacomini, Simona Bertolini, Isabella Martini, Jennifer McDermott, Elena Lazarova, Giorgia Gazzarata, Roberta Gazzarata, and Oliviero Varnier, University of Genova, Genova
Diagnosis and treatment monitoring can be greatly improved if numerical values of laboratory markers are available. In several laboratories various tests, such as the enzyme-linked immunosorbent assay (ELISA), are based on colorimetric methods, where enzyme activity is used as a quantitative label. The ELISA is an easily standardized and readily automated, relatively inexpensive, highly sensitive and specific procedure, which requires small sample and reagent volumes. The accuracy and wide range of quantification with the ELISA method is still an open problem. This paper presents the improved and web based version of a software for analyte quantification that bases its quantification capability on optical density readings collected both during the colour formation phase and after the dispensation of the stop solution.
The Quanti-Kin Web has been developed within Microsoft Visual Studio 2015 using Microsoft SQL Server 2016 to record data and is now available at the address http://www.quantikin.com. The complete process of test management can be divided into five sections.
1. Creation of a new assay.
2. Optical density values acquisition.
3. Web based data transfer.
4. Quality control of the experiment.
5. Quantification of analyte and results reporting.
A large quantity of old data related to the calibration curves of two important experimental centres and data produced in the same centres, but by training personnel visiting these centres, was collected. Therefore, with these types of data it was possible to evaluate the efficiency of the calculation engine. The previous program QKDS achieved good precision regarding the quantification of known amounts of p24, but the data presented were only produced in an extremely well controlled environment. The statistical analysis performed with the data collected by highly trained users shows that Quanti-Kin Web produced results similar to those presented in. On the contrary, during widespread worldwide routine use the performances in quantification were significantly lower than those obtained by well trained personnel and reported in. This aspect can greatly influence quantification results and the curves. Thanks to Quanti-Kin Web improved quantification algorithm, this problem can be overcome without affecting the quality of the experiment. In fact a strong check on the wells has been developed. By this way, the maximum error has been significantly reduced from 960.49 in the old version to 55.63 in the new one. The standard deviation was also reduced from 86.53% to 6.7%, the variance was reduced from 74.87 to 44.87 and lastly the mean error was reduced from 15.19 to 0.24. The data are calculated over experiment performed in many laboratories all over the word during the last three years.
The web deployment of the present tool makes its use very simple, as it does not require any installation and it assures a very fast execution. The data that are exchanged on the web are uniquely related to the amount of analyte present in the wells and not to the identity of the patient, so any restrictions due to the privacy laws of many countries are not affected.
Abstract no. 377 A CTS2 compliant solution for semantics management in laboratory reports at regional level
Roberta Gazzarata and Mauro Giacomini, University of Genova, Genova
Maria Eugenia Monteverde, Healthropy s.r.l., Savona
Elena Vio and Claudio Saccavini, Arsenàl.IT, Treviso
Lorenzo Gubian, Veneto Region, Venezia
Idelfo Borgo, Local Health Authority 16 of Padova, Padova
The clinical data sharing represents a fundamental tool to improve the clinical research, patient care and reduce health costs. The Health Ministries of many developed countries are planning the creation of national health information exchange (HIE) systems by defining the functionalities to support the sharing of the knowledge of their content. To realize distributed system architectures able to satisfy this requirement, the management of semantics is a critical and essential aspect that must be considered. For this reason, a research is now underway to set up an infrastructure able to aggregate information coming from health information systems, and it will be experimented to support regional HIE in Veneto Region. In this paper the first steps of this research and the current implementation state are presented.
The first period focused on the semantics management in laboratory reports. As indicated by the Italian Health Ministry, laboratory reports must be structured adopting the HL7 Clinical Document Architecture Release 2 (CDA R2) standard and LOINC vocabulary. For this reason, LOINC was used as reference code system. To manage the semantics of the information involved in the contextual workflow, the design and the implementation of a terminology service was considered and the Common Terminology Service Release 2 (CTS2) standard, product of Healthcare Service Specification Project3, was adopted. In this phase, the authors selected 6 CTS2 terminology resources (codeSystems, codeSystemVersions, EntityDescripctions, Map, MapVersion and MapEntry) and, for all these, decided to start from the implementation of read, query, maintenance and temporal functionalities. The SOAP (Simple Object Access Protocol) was chosen as implementation profile and Microsoft Windows Azure was adopted as cloud platform to host both database and web services.
The proposed solution is formed by the regional HIE, 22 Laboratory Information Systems (LISs) of the local departments of the Veneto region, the terminology service, called Health Terminology Service (HTS), and an application to manage the content of the terminology database. The core of the architecture is the HTS that provides access to the terminology database through interfaces compliant to the CTS2 standard. At the present, the HTS is formed by a Microsoft SQL Azure database (the terminology database), and eighteen Windows Communication Foundation (WCF) services, which represent the CTS2 interface, hosted on Microsoft Azure. The first client application that was connected to the HTS was the web application used to maintain the content of the HTS terminology database. It is continuously evolving to satisfy both the needs of medical staff and the requirements that the Veneto region is designing to create the regional HIE and to manage the semantics of its content.
This paper presents the current implementation state of the infrastructure proposed to manage semantics in laboratory reports at regional level. In the next months, the technical specification will be defined for the integration of HTS with 4 out of 22 LISs and with the regional HIE. After a validation period in which the solution will be tested, an analysis will be performed to evaluate its impacts.
Abstract no. 385 A ‘one health’ antibacterial prescription surveillance approach developed through the use of health informatics
Fernando Sanchez-Vizcaino, Daniel Hungerford, and Rob Christley, University of Liverpool, Institute of Infection and Global Health, Liverpool
Neil French, David Singleton and Alan Radford, NIHR Health Protection Research Unit in Emerging and Zoonotic Infections, University of Liverpool, Liverpool
Introduction Evidence of antimicrobial resistance transmission between humans, livestock and companion animals highlights that a truly ‘one health’ approach is needed to preserve antimicrobial efficacy. Antibacterial use is considered as the key driver for the development of antibiotic resistance bacteria. It is therefore essential to understand how widely antibacterials are being used across both human and animal health. However, tools for integrating data sources contributed to by both human and veterinary healthcare have not been developed yet, nor has the extent to which small companion animals contribute towards zoonotic antimicrobial resistant transmission been investigated. The objective of this study is to demonstrate the feasibility of a novel ‘One Health Informatics’ approach for comparing antibacterial prescribing practices in human and small animals healthcare settings through the use of electronic health records (EHRs) obtained from a UK sentinel network of medical and veterinary practices.
Methods Medical data were collected through NHS Liverpool Clinical Commissioning Group facilitation, from 26 general medical practices in Liverpool between June 2014 and May 2016. EHRs included patient information such as sex, age, residence, antibacterials prescribed and the consultation coding for both respiratory disease and gastrointestinal disease consultations. Veterinary data were gathered electronically in real-time by SAVSNET, the Small Animal Veterinary Surveillance Network, from 458 veterinary premises throughout the UK between April 2014 and March 2016. Each record included the animal signalment (including species, breed, sex, age, etc.), owner’s postcode, syndrome information and treatments including antibacterials.
Results & Discussion EHRs were obtained from 4,121,340 (n= 157,274 patients) human consultations and 918,333 (n=413,870 dogs) canine and 352,730 (n=200,541 cats) feline veterinary consultations. In humans, total antibacterial prescribing was less common (4.51% of consultations, 95%CI: 4.49-4.53) than in dogs (18.8%, 18.2-19.4) or cats (17.5%, 16.9-18.1). Beta-lactams represented the most commonly prescribed antibacterial class in humans (53.8% of prescriptions, 53.6-54.0), dogs (43.8%, 42.4-45.1) and cats (71.1%, 68.9-73.3). The most commonly prescribed antibacterial was amoxicillin in humans (30.6% of overall prescriptions, 30.5-30.8), clavulanic acid potentiated amoxicillin in dogs (28.6%, 27.3-29.9), and cefovecin, a third-generation cephalosporin, in cats (35.2%, 31.9-38.6). To understand these differences in prescribing between human and small animals healthcare settings it will be important to assess the different types of patient seen in medical and veterinary practice.
Conclusion These preliminary results demonstrate the feasibility of ‘One Health’ antibacterial prescription surveillance in a UK sentinel network of medical and veterinary practices. In future work, we will develop tools to track geographical and temporal changes in the overall prescribing and at syndromic level in human and animal health and to explore factors associated with variation in prescribing patterns within medical and veterinary consultations.
Abstract no. 392 Sleepylab: an extendable mobile sleeplab based on wearable sensors
Andreas Burgdorf and Stephan M. Jonas, Department of Medical Informatics, Uniklinik RWTH Aachen, Aachen
Jó Agila Bitsch, COMSYS, RWTH Aachen University, Aachen
Introduction According to the Robert Koch-Institute, 25 percent of German adults suffer from sleep disorders. Consequences of sleep disorders are dangerous and costly. A common sleep examination is the in-clinic polysomnography, which records vital, activity and other parameters. These examinations are costly and usually limited to a few nights per patient. A possibility to perform cheap, long-time monitoring of patients are smart wearable devices. Many consumer-grade smartwatches or fitness trackers are equipped with sleep monitoring applications. However, these applications are not based on scientific publications and are limited to vendor applications. Thus, data access or aggregation across multiple devices, which would be required for a clinical assessment, is limited or impossible.
Method To close this information gap, we developed the modular Android application SleepyLab: a mobile sleep laboratory based on wearable devices. The modular architecture allows for different hardware, and processing or visualization algorithms in one solution. Therefore, SleepyLab consists of a Core Application and three plugin-types: 1) monitor, 2) processing and 3) presentation plugins. Recorded data is stored and communicated by the core application in an interoperable format using the Medical Subject Headings (MeSH) to classify devices and body regions. Monitor plugins measure data from smartphone-internal or connected sensors. For each device or characteristic, a separate plugin can be installed and integrates seamlessly into SleepyLab. Inspired by polysomnography, the following monitoring plugins have been realized: 1-3) movement (smartphone, smartwatch, TI SensorTag), 4-5) cardiac activity (chest belt, smartwatch), 6) sound (smartphone), 7) brightness (smartphone) and 8) EEG (Emotiv Epoc+). Processing plugins analyze recorded (or already processed) sleep data with arbitrary algorithms. Algorithms can potentially detect sleep stages, activity or snoring based on recorded signals. A first realized plugin aggregates movement data into activity. Finally, presentation plugins display recorded or analyzed data or are other data endpoints. One implemented plugin allows users to view graphs of raw data. Another plugin exports data into csv files for further processing.
Results SleepyLab was evaluated in two different phases. First, the suitability of the developed plugins and corresponding sensors was evaluated. Second, several full-night recording were performed in self-tests. The plugin evaluations showed that most plugins were suitable to perform their task. The smartwatch performed best in detecting movements, while the chest belt measured a more accurate heart rate. The sound plugin performed best with external microphones and the brightness plugin’s quality strongly depended on the used device. The EEG plugin could store the recorded data as EDF+ files but the sampling rate was too high to directly communicate data to the core application. The full night records were performed without the EEG device due to its form-factor. Nevertheless, the visualization of movements, sounds and heart rates allowed the manual detection of different sleep phases without further processing. Disadvantages were high energy consumption of the smartwatch and the heat development of the smartphone, if charger wirelessly.
Conclusion The mobile Application SleepyLab records, processes and visualizes sleep-related data from wearable devices to supports sleep research and clinical practice with inexpensive and unobtrusive long-term monitoring.
Abstract no. 404 Impact of large flash memory and thin- client infrastructure for the EHR and PACS Sharing system with XDS/XDS-I
Hiroshi Kondoh, Tottori University Hospital, Yonago
Masaki MOCHIDA, Tatsuro KAWAI, and Motohiro NISHIMUARA, SECOM Sanin Co.Ltd., Matsue
Takeshi YAMAGUCHI, GE Healthcare Japan Co. Ltd., Tokyo
Daisuke IDE, IBM Japan Co. Ltd., Tokyo
We developed and operated ERP and PACS sharing system with XDS/XDS-I on thin-client infrastructure. Large flash memory was introduced at the renewal of server, it was surprisingly shortened the start-up time and display time. EHR on cloud server should be spread in future.
Abstract no. 408 Attitude and current utilization of telehealth applications among diabetic patients in king saud university medical city, Riyadh Saudi Arabia
Nejoud AlKhashan and Ahmed Ismail Albarrak, King Saud University, Riyadh
Introduction Previous studies have strongly suggested good outcomes from using telehealth to support the management of chronic diseases and its complications. Outcomes include, improve patient’s quality of life, increase satisfaction, less visits to the emergency department, and better control over the disease with less overall costs. In Saudi Arabia, it was estimated that 24% of the population are diabetic. Objectives: To assess the diabetic patients’ utilization and attitude towards telehealth applications in King Saud University Medical City (KSUMC).
Methods A cross sectional study was conducted in KSUMC between March and April 2015. A self-administered questionnaire was adapted from technology acceptance model (TAM) and distributed to diabetic patients. Descriptive and correlation analysis was then performed.
Results A total of 237 participants responded to the questioner (128 (54%) males, 109 (46%) females), with mean age 47±15 (mean±SD). Although 30% prefer to see a healthcare provider (HCP) in person, however results show a positive attitude towards utilizing telehealth (p < .001). This can be can explain by the high number of smartphone users (86%).
Conclusion The study results revealed a gap in communication between diabetic patients and healthcare providers. Telehealth could play a major role in bridging this gap this is supported by the high number of smartphones’ applications users and the participants’ positive attitude towards the utilization of telehealth. It is recommended to work on promoting utilization of telehealth applications by patients with chronic diseases to have better control over their disease.
Abstract no. 414 When do people read their health record? – Analysis of usage data of a national eHealth service giving patients access to their electronic health record
Isabella Scandurra, Örebro University, Örebro
Maria Pettersson, Inera AB, Stockholm
Maria Hagglund, Karolinska Institutet, Stockholm
Introduction eHealth services for citizens provide support for patients and families, as well as for healthcare professionals. In Sweden different eHealth services have been developed since the late 1990s and they are now used by millions of users. One of the national eHealth services that provides opportunities for increased participation in care is the Patient Accessible Electronic Health Record (PAEHR). To date (February 2017) over one million citizens (of 10 million inhabitants) have accessed their own electronic health record (EHR). In this study, we describe current usage by analysing log-data from the service. Who are the users, and how and when do they use the service?
Method Data collection of routinely captured usage data was administered by Inera AB, owner of all Swedish national eHealth services. Data was analyzed through IBM SPSS in accordance with the declaration of Helsinki. Queries for this quantitative study were created based on previously published results regarding concerns often expressed by healthcare professionals (HCP) as well as routinely captured log-data. Descriptive usage statistics were analysed towards such HCP concerns, e.g. increased workload due to worried patients reading but not understanding the PAEHR content.
Results Current status of the Swedish PAEHR is presented, e.g. number of users, demographic data (age, gender) in relation to log-in statistics. Regarding log-ins, first-time users and unique hits show that attention by national media has an impact a news cast resulted in 31,000 logged in compared to a week day average of 20,000. To date more than 1 million citizens have chosen to log in and the numbers are increasing. A newly connected region (Örebro) has an average of 500 new users a day. This can be compared to the first region (Uppsala) which during the first year (2012-2013) had approx. 100 new users a day, although the strategy then was not to advertise the service. In total 10,000 to 13,000 new users log in every day nationally. More women than men log in and their mean age are 23-32 years. The older the users get the less they use the PAEHR, however some users are older than 93 years. During weekends the activity decreases, as opposed to HCP expectations. More often, users log in on week days, e.g. on Monday morning.
Discussion Usage statistics were related to concerns of HCP, which seem to have little resemblance to reality. One concern was that the service would not provide benefit for patients, here contradicted by the increasing number of both first-time and recurrent users. However, such indicators need to be further analysed. Paper records and PAEHR usage are difficult to compare, due to lack of statistics regarding printout reading. Usage comparisons between PAEHR solutions of different counties would however be interesting.
Conclusion Recurrent concerns of mainly HCP seem to be contradicted by actual usage by patients. This may lead to a decreased controversy of how PAEHR is experienced by patients and HCP. Knowledge about how users actually use PAEHR may also improve the service as such.
Abstract no. 419 Longitudinal resource usage of transcatheter aortic valve implantation (TAVI) using Hospital episode statistics in England
Samuel Urwin, Kim Keltie, Azfar Zaman, and Richard Edwards, Newcastle upon Tyne Hospitals NHS Foundation Trust, Newcastle-upon-Tyne
Julie Burn and Andrew Sims, Newcastle University, Newcastle-upon-Tyne
Introduction Transcatheter aortic valve implantation (TAVI) is a minimally invasive method of replacing the aortic valve in patients with aortic stenosis who are considered inoperable or high risk for surgical aortic valve replacement. The aim of this study was to estimate in-patient NHS resource usage following TAVI procedures using routine hospital administrative data from the Hospital Episode Statistics (HES) database in England.
Methods All in-patient finished consultant episodes of care (FCEs) relating to patients undergoing TAVI between 01/04/2009 and 31/03/2014 were extracted for the period from the TAVI admission until 1 year after the TAVI discharge date. FCEs were aggregated into admissions, and for each admission, administrative details, procedure codes, and diagnosis codes were analysed. This provided information on the dates of admission/discharge, the reason for admission (ICD-10 code), the urgency of admission, whether the admission was due to a complication, length of hospital stay, and the procedures undertaken during the admission (OPCS codes). The pseudonymised patient identifiers were extracted and linked with mortality data from the Office of National Statistics up to 31/03/2015. A Kaplan-Meier survival analysis of time to death was performed.
Results After exclusions, 4874 patients undergoing TAVI between 01/04/2009 and 31/03/2014 were identified from the HES database. During the TAVI admission, the median [interquartile range] length of stay was 8 [6:14] days, and 216 (4.43%) patients died. In the 30 day period following TAVI discharge, there were 1602 readmissions by 1205 patients (25.9% of patients surviving at TAVI discharge), accounting for 16399 days in hospital. This corresponded to a rate [95% CI] of 0.34 [0.33:0.36] readmissions and 3.52 [3.47:3.57] days in hospital per patient surviving at TAVI discharge (4658). In the 30 day to 1 year period following TAVI discharge, there were 6868 readmissions by 2500 patients (54.5% of patients surviving at 30 days post TAVI discharge), accounting for 53481 days in hospital. This corresponded to a rate [95% CI] of 1.50 [1.46:1.53] readmissions and 8.10 [8.01:8.17] days in hospital per patient surviving at 30 days post TAVI discharge (4584). 710 (14.6%) patients had died at one year post TAVI discharge. In the Kaplan-Meier survival analysis, median survival [95% CI] was reached at 1969 [1836:2136] days (5.4 years).
Discussion This is the first study to estimate the in-patient resource usage of a national cohort of TAVI patients in the NHS for the year following the procedure, and may provide useful reference information for commissioners and clinicians involved in decision making. The methods developed provide a technique of tracking patients longitudinally following procedures through the HES database to gather useful clinical information, and are generalisable to other procedures. A limitation is that the data are dependent on the accuracy of clinical coding, which has been shown to vary between providers.
Abstract no. 432 Designing a bedside application for adverse event reporting
Hanne Aserod and Ankica Babic, Department for Information Science and Media Studies, University of Bergen, Bergen, Norway
Introduction We present a mobile software application development for safety reporting within the field of angioplasty. The application aims at supporting physicians with capturing and retaining data regarding safety events. A combination of Interaction design and User experience techniques was used to inspire usability1 and create useful, intuitive interface. The consequence of not considering the user experience could be user frustration and the user looking for an alternative solutions to data capture. If f forced upon users, an application usage could increase the likelihood of mistakes increases, and reduce effectiveness.2
Method To collect data and define system requirements a literature review and a field study were conducted which resulted in both quantitative and qualitative data. The data was analyzed to understand the data flow and clinical processes all with a purpose to enable a user keeping in touch with the whole hospital information system. To be able to utilize the users’ skills and experiences within their domain, it was important to include them in the participatory design process. To get feedback on the concept, medical staff was given the screens together with explanation of the concept based on several levels of functionality.
Results Proposed user interface enables entry of data specific for adverse events of the knee and hip implants. Besides the patient data, the system allows entry of the event classification (serious, non-serious) and treatment, as well as the connection of the database maintained within the Helse Bergen hospital system. Reports could be initiated and retrieved if there are previous adverse event instances. Expert evaluation of the first design solution was performed using low fidelity prototype. It has shown that design was relevant, straightforward, done in a way that official reporting would commence. A question was also asked if the system could be adjusted to general reporting.
Discussion The design was met with enthusiasm by the healthcare professionals. However, it has been clear that there are reservations exist for reporting adverse events in general. The main reason seems to be a heavy work burden. There were also concerns about being viewed negatively by other medical staff. Attitudes towards reporting were not entirely negative, for example, the biomedical engineer lab that evaluates explanted medical devices would appreciate such a bed side reporting. Interviewed physicians accepted this point of view and did not entirely rule out their participation. Therefore, more work needs to be done to address attitudes towards reporting and lack of motivation for it.
Conclusion The development is directed towards the high-fidelity prototype and further web-based system development that will enable more detailed reports. Those will be fit into the hospital information system and provide basis for other functionalities such as e-learning and other general reporting.
References
N. Kellingley, “What is the difference between Interaction Design and UX Design?” [Online]. Available: https://www.interaction-design.org/literature/article/what-is-the-difference-between-interaction-design-and-ux-design. [Accessed: 07-May-2016].
O. Mival and D. Benyon, “Requirements Engineering for Digital Health,” A. S. Fricker, C. Thümmler, and A. Gavras, Eds. Cham: Springer International Publishing, 2015, pp. 117–131
Abstract no. 434 PITeS-TIiSS: complex chronic patient personalized decision support
Noa P. Cruz Díaz, Group of Research and Innovation in Biomedical Informatics, Biomedical Engineering and Health Economy. Institute of Biomedicine of Seville, IBiS / Virgen del Rocío University Hospital, Seville
Alicia Martínez-García, Virgen del Rocío University Hospital - FISEVI, SEVILLA
Maria Jose Garcia Lozano, Camas Primary Care Center, Seville
Bosco Barón Franco and Lourdes Moreno Gaviño, Internal Medicine and Integrated Care Department, Virgen del Rocío University Hospital., Seville
Carlos Parra, Group of Research and Innovation in Biomedical Informatics, Biomedical Engineering and Health Economy. Institute of Biomedicine of Seville, IBiS / Virgen del Rocío University Hospital, Sevilla
Complex Chronic Patient management is of great difficulty, in a context that requires personalization of actions based on the complexity of the patient’s condition over time. It needs to complement the recommendations defined in clinical guidelines from recommendations based on treatments performed on a representative set of patients, identifying conflicts between the recommendations of different guidelines designed for handling isolated chronic diseases. It also requires its extension to specific protocols in areas not described with sufficient detail in clinical guidelines in terms of safety and quality. The PITeS-TIiSS project aims to overcome this problem. Its main goal is to design and deploy a Clinical Decision Support System which helps to improve personalized decisions based on evidence and reduce variability in clinical practice in an integrated care domain. It will perform, integrated into the workflow of the healthcare professional, two types of recommendations related to the need to identify the duality between the best practice defined by consensus of domain experts and the analysis of the results obtained from patients with similar characteristics. From the review of the integrated care process of the pluripathological patient1 and the existing clinical practice guidelines on the management of acute and chronic heart failure2 and chronic obstructive pulmonary disease,3 it will be defined decision rules that allow applying, automatically and personalized to the patient’s conditions, clinical knowledge. It will also take into account cross-cutting tools such as the Stopp/Start4 and Less-Chron5 criteria as well as a prognostic scale called Profund index6. The process will be dynamic in order to improve its adaptation for changes in the reference knowledge and for the feedback on its use, introducing the concept of Learning Health System. In this study, the tool will access the information provided by the Health Information infrastructure of the Andalusian Public Healthcare Service. The integration of information will be carried out in a fast, consistent and reusable way. Final results will be reported in December 2018.
References
J.A. Mitchell, et al. 50 years of informatics research on decision support: What’s next. Methods of information in medicine, 50(6), 525. (2011).
P. Ponikowski, et al. 2016 ESC Guidelines for the diagnosis and treatment of acute and chronic heart failure. European heart journal. (2015).
M. Miravitlles, et al. Guía española de la EPOC (GesEPOC). Actualización 2014. Archivos de bronconeumologia, 50, 1-16. (2014).
D. O’mahony, et al. STOPP/START criteria for potentially inappropriate prescribing in older people: version 2. Age and ageing. (2014).
A. Rodríguez-Perez, et al. DI-060 Translating into english a new tool to guide deprescribing: A cross cultural adaptation. Eur J Hosp Pharm 2016, 23:A144-A145. (2016).
M. Bernabeu-Wittel, M. Ollero-Baturone, D. Nieto-Martín. Polypathological patients and prognostic scores. About the PROFUND index. Eur J Intern Med, 23(4):e116. (2012).
Abstract no. 438 Canadian primary care EMRs as the basis for a registry RCT.
Frank Sullivan, University of St Andrews, Scotland
Karim Keshavjee, Infoclin, Toronto
Braden OO’Neill, North York General Hospital, Toronto
Michelle Greiver and Frank Sullivan, University of Toronto, Toronto
Introduction Registry Randomized Controlled Trials (RRCTs) provide clinical researchers with the ability and resources to ask important clinical questions and design studies without the inherent biases often introduced through trials which recruit by other means. RRCTs have three key characteristics:
1. Randomly assigning patients in a clinical quality registry which combines the features of a prospective randomized trial with a large-scale clinical registry.
2. They are more pragmatic and enable fast enrolment, control of non-enrolled patients, and the possibility of very long-term follow-up.
3. The clinical registry can be used to identify patients for enrolment, perform randomization, collect baseline variables, and detect end points.
Method Qualitative work for a pilot and optimisation study which builds upon recent developments in Canadian Research Capacity:
The ability to extract, transform and link EMR data to administrative data for ascertainment of long-term outcomes in the $35M Canadian Institute for Health Research (CIHR) Funded Strategy For Patient Orientated Research(SPOR) Diabetes Action Canada research program.
Improvements in the quality of Primary Care EMR data in the Canadian Primary Care Sentinel Surveillance Network (CPCSSN):
The ability to link EMR data to trial management software (REDCap in this case)
Stronger research infrastructure in primary care in Practice based Research Networks (UTOPIAN, SAPCRen and NAPCRen in this case)
Results 21 of 60 practices surveyed are willing to engage in an RRCT involving randomising patients taking Metformin as the 1st line drug for Type 2 diabetes to Empaglifozin or continuing the biguanide. By the time of the presentation we will have conducted focus groups and interviews with patients, clinicians, Research Ethics Boards and policymakers in Ontario and Alberta.
Discussion Health Technology Assessment (HTA) Programme funded work in the UK by van Staa et al has shown that RRCTs using primary care EMRs is feasible but optimisation of the study in a pilot is required to address REB concerns and workflow issues. In particular the mechanisms to recruit sufficient patients and minimise the workload on physicians and clinic staff by approaching potentially eligible study subjects outwith consultations have been shown to be important.
Conclusion Before embarking on a substantive trial, recruiting the thousands of patients likely to be necessary for adequate power to answer this question effectively we are conducting a mixed methods feasibility and optimisation study. Experience in this T2DM example will be useful for the development of RRCTs on other topics in Canada and other countries where primary care EMRs provide access to data and Practice Based Research Networks enable studies to be implemented.
Abstract no. 441 Importing patient generated health data from wearable devices to multiple sclerosis quality register
Michael Fardis, Karolinska Institutet, Stockholm
Nabil Zary, Lee Kong Chian School of Medicine, Nanyang Technological University, Singapore, Singapore
Introduction Patient generated health data (PGHD) from Wearable Devices (WD), could transform Healthcare and be found useful in the management of quality of care and research of a chronic disease, like Multiple Sclerosis (MS). Objective: The study investigated what set of PGHD could be relevant for MS and explored challenges to the use of PGHD by Quality Registers (QR).
Methods Sequential explanatory mixed method design was chosen as a methodology. A questionnaire was delivered to MS professionals, in order to find the most meaningful PGHD for MS. Interviews followed, in order to assist the interpretation of the questionnaire’s findings.
Results 35 healthcare professionals answered the survey. Analysis of the questionnaire results offered a proposed dataset of PGHD for MS. The interviews revealed challenges (legislative, organizational) and opportunities (innovative solution) of tracking a disease like MS with the usage of WDs.
Conclusion Several challenges exist in the usage of PGHD. WDs alone cannot cover the measurements for a disease like MS and applications for patients’ reporting are needed as well.
Abstract no. 450 User-centred design of e-health technology for patients and professionals in productive teams - multidisciplinary work across organisational borders
Berglind Smaradottir, Santiago Martinez, and Rune Fensli, University of Agder, Kristiansand
Introduction The research project Patients and Professionals in Productive Teams (3P) 2016-2019, approved by the Research Council of Norway and funded through the Regional Hospital Trust Funds in Norway, aims to study multidisciplinary teamwork across organisational borders with a citizen-centred approach and focus on health service research, quality of care and patient safety. Health services face the challenge of providing individualised treatment to a growing ageing population prone to long-term conditions and multi-morbidities. There is an urgent need to understand how to operationalise patient-centred and integrated care, supported by technology where confidentiality, efficient team collaboration, quality of care and patient outcomes are at the centre. In this way, the 3P project includes 4 pilot sites that contribute to the development of innovative technology that is: 1) citizen-centred 2) coordinated, proactive and planned 3) having one-point of contact 4) using multidisciplinary teams and 5) a learning care system. The 3P project aims are to improve quality of care and patient safety for citizens with long-term conditions with the ultimate goal of improving outcomes, care experience and reducing costs.
Methods Based on user-centred design principles1,2 4 pilot sites in Norway and Denmark will work on functionality and organisational use of e-health support systems for care delivery. In the first project phase, field studies and focus group interviews will identify existing patient flows and map out the experienced current obstacles. The project will propose then coordinated optimal procedures to improve the existing workflows with the patient at the centre and with one-point-of contact with the organisational healthcare professional team. In the next phase, workshops with end-user groups will define functional requirements for an e-health technology support system, outline ideal teamwork situations and use-cases with the focus on access to and sharing of information. The end-users will describe advantages of ideal procedures and identify how e-health systems can provide support for efficient team collaboration.
Results The 3P project is in the first project phase. The preliminary results from data collected during field studies and focus group interviews in the 4 pilot sites will be published at the end of 2017.
Conclusion This research study contributes to understand the role of e-health technology that supports multidisciplinary work in several ways. Firstly, it contributes to the knowledge on patient-centred systems, aiming at increasing efficiency and quality of care and empowering citizens with long-term conditions. Secondly, it shows how to actively and effectively involving end-users in design and development of e-health technology when conducting empirical research. Thirdly, it provides recommendations for large scale deployment of e-health technology that supports multidisciplinary teamwork across organisational borders.
References
B. Smaradottir, User-centred Design and Evaluation of Health Information Technology, Doctoral Dissertation, University of Agder, Norway, 2016. ISBN 978-82-7117-830-7
B. Smaradottir, M. Gerdes, S. Martinez, R. Fensli, The EU-project United4Health: User-centred design of an information system for a Norwegian telemedicine service, J Telemed Telecare, Vol. 22(7) (2016), 422–429. DOI:10.1177/1357633X15615048
Abstract no. 453 Extracting social factors from clinical free text
Andika Yudha Utomo and Azad Dehghan, University of Manchester, Manchester
Tom Liptrot, Daniel Tibble, Matthew Barker-Hewitt, and Goran Nenadic, The Christie NHS Foundation Trust, Manchester
Introduction Electronic health records (EHRs) contain vast amount of clinical information, with free text clinical narratives used as a routine medium to record details of patient care. The use of Text Mining (TM) methods in the clinical domain has therefore become increasingly important in order to extract knowledge from large volumes of EHRs. Social factors, such as smoking or alcohol consumption, in particular have repeatedly been shown as an important factor in modeling clinical outcomes. Such information is often recorded only in clinical narrative. Here we present an algorithm to automatically predict a patient’s smoking status from retrospective textual clinical records.
Method We developed a set of rule-based methods and embedded them in the GATE (General Architecture for Text Engineering) framework. The system takes as input a set of free text notes and automatically assigns the smoking status (current-, past-, non-smoker, smoker, unknown) to the given patient. The rules were crafted based on several lexical cues (e.g. mentions of smoking-related terms, including, for example, the number of cigarettes smoked), along with information on word distance, negation, and context. A dictionary-based post-processing component was developed to prevent obvious false positives. The methods described here are available as open source software at: http://github.com/christie-nhs-data-science/social-factors-classifier
Results To explore how general the rules are, the system was evaluated on three manually annotated datasets coming from: Informatics for Integrating Biology and the Bedside (i2b2) 2006 smoking challenge (i2b2/2006), i2b2/2014 heart disease risk factors identification challenge, and The Christie NHS Foundation Trust clinical notes (Christie). The results (see Table below) show that the method achieved a high-level of performance by reaching 0.90 score for micro-averaged F1-measure.

Discussion The scores are comparable to the best submissions on both the i2b2 2006 and 2014 challenges, demonstrating that the system is robust and applicable to clinical narrative coming from different healthcare disciplines. The main challenge proved to be the identification of the generic class of smoker, given the label is ambiguous (it does not discriminate between current/past smokers) and there are only small number of records with this label in each dataset. Similarly, some expressions (e.g. “He has a smoking history”) are ambiguous and it is difficult to differentiate whether such expressions refer to a current or past smoker (or it should be just smoker).
Conclusion We have demonstrated that a rule-based system can be used to extract social factors from clinical narratives with high performance. While most of social factors are expressed explicitly in text, we will use language modelling on larger datasets to determine implicit patterns that may indicate the presence of a targeted social factor.
Abstract no. 465 Validation of a case definition for depression in administrative data using a chart review reference standard
Chelsea Doktorchik, Cathy Eastwood, Mingkai Peng, and Hude Quan, University of Calgary, Calgary
Introduction Because the collection of mental health information through interviews is expensive and time consuming, interest in using population-based administrative health data to conduct research on depression has increased. However, there is legitimate concern that misclassification of disease diagnosis in the underlying data might bias the results. Our objective was to determine the validity of ICD-9 and ICD-10 administrative health data case definitions for depression using a review of family physician (FP) charts as the reference standard.
Methods Five trained chart reviewers reviewed 3362 randomly selected charts from years 2001 and 2004 at 64 FP clinics in Alberta and British Columbia, Canada. Depression was defined as presence of either: 1) documentation of major depressive episode, or 2) documentation of specific antidepressant medication prescription plus recorded depressed mood. Bipolar depression and alternate indications for antidepressants were excluded. The charts were linked to administrative data (hospital discharge abstracts and physician claims data) by unique personal health number. Validity indices were estimated for six administrative data definitions of depression using three years of administrative data.
Results Depression prevalence by chart review was 15.9%-19.2% depending on year, region, and province. An ICD administrative data definition of ‘2 depression claims within a one-year window OR 1 discharge abstract data (DAD) diagnosis’ had the highest overall validity, with estimates being 61.4% for sensitivity, 94.3% for specificity, 69.7% for positive predictive value, and 92.0% for negative predictive value. Stratification of the validity for this case definition showed that sensitivity was fairly consistent across groups, however the positive predictive value was significantly higher in 2004 data compared to 2001 data (78.8% and 59.6%, respectively), and in Alberta data compared to British Columbia data (79.8% and 61.7%, respectively).
Discussion Our estimates of validity indices are similar to those reported in the literature. Sensitivity is often moderate, and specificity is often high, as depression is a difficult mood disorder to diagnose due to its varying severity and presentation. Limitations to this study include the use of FP chart data as the “gold standard”, given the potential for missed or incorrect depression diagnoses.
Conclusions These results suggest that administrative data depression case definitions are moderately valid, and that administrative data can be used as a source of information for both research and health services purposes.
Abstract no. 466 Implementation of mHealth interventions in low income settings: overcoming the risk for prioritising up-scaling over evidence
Mathew Mndeme, Hamish Fraser, and Tolib Mirzoev, University of Leeds, Leeds
Susan Clamp, Leeds Institute of Health Sciences, University of Leeds, Leeds
Background Use of mobile phones for health innovations (mHealth) is increasingly adopted in Tanzania to address different health-system constraints. This builds on the advantage of a wide penetration of mobile phone networks (79%), rapid growth of teledensity (85%), and successful experiences of innovations for mobile-money transactions. This study evaluates the implementation experience of mHealth intervention for communicable diseases reporting and outbreaks notification in Tanzania (eIDSR). It identifies implementation practices that led to prioritise up-scaling over evidence. Alternative, evidenced-based approaches for scaling up is proposed.
Methods This was a retrospective mixed-methods study in two districts. Data were collected through (1) semi-structured interviews, (2) analysis of eIDSR implementation documents, and (3) analysing trends of reporting through the eIDSR. Data from (1 & 2) were thematically analysed and (3) were analysed using descriptive statistics.
Results eIDSR was implemented under coordination of the Ministry of Health using a top-down approach with minimal involvement of users were data originates. Its inception was supported by development partners with interest in diseases surveillance. They provided resources for piloting and up-scaling. Funding came from different sources, some of which dictated a deployment approach. eIDSR was piloted in one district (out of 182) for 2 months and up-scaled to cover 70 districts (38.5%) within 2 years. Despite being integrated to the mainstream Health Information system (HIS) strategy, it was not regarded as a reliable source of surveillance and operated parallel to paper-based system. During the 2015-2016 cholera outbreak, eIDSR failed to support reporting and notification of cases as anticipated. Conversely, unstructured SMS and phone calls were the prefered means of reporting. Implementation design did not envision contextual situations like designating of cholera treatment centres as source of data. Additionally, eIDSR was hardly used due to unresolved technical challenges and use of personal mobile phones for reporting, among other reasons. As a result, only 65 out of 3,608 (2%) cases and deaths were reported through eIDSR.
Discussion There was weak evidence to support the level of up-scaling the eIDSR intervention. Most of the implementation challenges observed during piloting stage were still obvious throughout the up-scaling process. The urgency of addressing the burden of communicable-diseases and controlling outbreaks, uncertainty of funding sources, and reported potentials of mHealth innovations to improve health, temped implementers to accelerate up-scaling without thorough evaluation of implementation practices and evidence of intended outcomes.
Conclusion This study suggests that the risk of prioritising up-scaling of mHealth over evidence is associated with both inhibiting factors (unreliability of funding sources, and lack of evaluation studies) and facilitating factors (availability of mHealth supportive infrastructure, successful experience of using mobile phones for money transactions, and technological pressure). There is a need for rigorous evaluation studies to help inform mHealth implementation designs and practices. mHealth implementation should be funded within the mainstream eHealth strategies and efforts should be directed to overcome the weakness of conventional HIS practices to accommodate mHealth innovations. Similarly, technical integration of mHealth into mainstream HIS strategy should take place concurrently with revisiting of non-technical determinants of HIS performances.
Abstract no. 467 Blood pressure data quality assessment in Canadian and UK EMR data: how is blood pressure recorded?
Mingkai Peng, Shiva Wagle, Hude Quan, Tyler Williamson, and Guanmin Chen, University of Calgary, Calgary
Background The electronic medical record (EMR) provides rich clinical information on patients and an opportunity to conduct risk factor surveillance at population levels. In this study, we investigated the data quality of blood pressure (BP) in two large EMR databases in UK and Canada.
Methods This is a population-based cross-sectional study. We identified the active patients in The Health Improvement Network (THIN) and Canadian Primary Care Sentinel Surveillance Network (CPCSSN) from 2008 to 2010. The blood pressure measurements were extracted from the database and stratified by age and sex. We examined the proportion of patients with BP measurements. The time gap between measurements was examined for patients with more than 1 measurement. The context information of blood pressure, such as diagnosis and prescriptions, was also examined.
Results In THIN, there were 3 027 635 individuals. The proportion of individuals with BP recorded during 2010, 2009-2010 and 2008-2010 were 38.6%, 51.6%, and 59.4%, respectively. Females had more BP recorded than males. The proportion of individuals with BP measured increased with the age. In the period of 2008 to 2010, there were 42.4% of individuals with at least 2 BP measurements? Among those individuals with at least 2 BP records, 19.7 % of individuals has two BP measured within 1 month. Analysis on CPCSSN is still underway.
Conclusion The EMR contains rich BP information, especially for the female and older individuals. The number of individuals with BP measurements and the number of BP measurements increased with increased observational periods.
Abstract no. 471 Datasets of interest to researchers studying UK primary care and related topics
Lucy McDonnell, King’s College London, London
Frank Sullivan, University of Toronto, Toronto
Brendan Delaney, Imperial College, London
Introduction Primary care in the U.K. generates an extraordinary amount of data creating unrivalled opportunities for research. Some of this data however, is underused, unknown and historically only accessed by certain institutions or experienced researchers. The aims of this project were to systematically identify, describe and facilitate access to primary care datasets in England, Scotland, Wales and Northern Ireland and to present the information found in an accessible format for all researchers.
Method We searched for relevant datasets via a variety of methods. Methods included reviewing previously compiled but unpublished lists of datasets, searching the internet using the search terms ‘primary care’ ‘general practice’ ‘GP’ ‘data’ and ‘datasets’ and identifying datasets which use primary care electronic record systems e.g. EMIS and Vision to extract data. Metadata were mostly taken from comprehensive website searches. Completed metadata templates were sent out via email to data custodians to verify the information prior to publication.
Results We identified more than 30 datasets divided into the following categories: electronic medical record data, quality of primary care services, prescribing data, audit, health surveys, special datasets, cohort studies, administrative datasets and screening datasets. The largest datasets were electronic medical record data linked to primary care electronic medical system e.g. ResearchOne incorporating over 30 million registered patients. The smallest datasets were audits and surveys, e.g. the health survey for Northern Ireland which included around 4000 patients in 2014/5. Metadata included type of data, context of data and method of extraction, coverage, geography, duration, volume, events for data collected, granularity, coding, consent and access. Example publications using the data were included for the majority of datasets listed. The majority of dataset custodians replied to our enquiry and verified the information.
Discussion Our search identified a large number of datasets which may be useful to primary care researchers including major popular datasets, and less well known resources. Identifying peer reviewed publications which have used the datasets allowed us to highlight the variety of research that can be carried out with routinely collected data. We used a template similar to that on the Health Data Finder website to ensure consistency of metadata.
Conclusion This project fills a gap in the literature regarding the existence and availability of primary health care datasets and is intended to be used as a starting point for researchers. It is a useful resource for both established primary care researchers who have current or historic links to particular datasets, as well as potential users who may not be aware of the existence of such a large variety of datasets or have previously encountered barriers to access.
Abstract no. 481 Physiodom HDIM: good health, good ageing
Maite Franco, Silvia Sánchez, and Esther Jovell, Consorci Sanitari de Terrassa, Terrassa
Healthy ageing depends on genetic, environmental and behavioural factors, as well as broader environmental and socioeconomic determinants. Some of these factors are within the control of the individual, usually referred to as lifestyle factors, and others are outside the individual’s control. Social determinants of health, such income and education, influence the choices that individuals can make and create life circumstances which limit opportunities for healthy lifestyle and create health inequalities. Engaging in appropriate physical activity, healthy eating, not smoking and using alcohol and medications wisely in old age can prevent disease and functional decline, extend longevity and enhance ones quality of life. There is evidence to suggest that the determinants of health are good predictors of how well both individuals and populations age. Physiodom HDIM intervention consists of a telemonitoring system which will be employed by participants at home to perform automatic measurement of weight, BMI, L/F ratio, blood pressure, manual measurements will be provided in physical activity. Also participants will be monitored by professionals around appetite, nutritional status and dietary intake.
Objectives To demonstrate favourable effects of Physiodom HDIM on nutritional status.
To validate that this new system is able to optimize the use of resource in different health-social care settings. To assess the impact of implementing Physiodom HDIM intervention in the existing services at different organisations.
To assess the usability of a remote home services, offering services such a personal calendar management, electronic messaging and remote monitoring of the delivery of home services, though the home TC monitor and health care professionals PC. To perform a process evaluation including the usability, feasibility, acceptability and implementation fidelity of the Physiodom HDIM intervention among the elderly and involved care-givers.
Abstract no. 483 Development of a national core dataset for the Iranian breast cancer multidisciplinary registry
Mohsen Goli, Najme Nazeri, Sara Dorri, Ebrahim Abbasi, and Alireza Atashi, Cancer Informafics Department, Breast Cancer Research Center, ACECR, Tehran, Iran., Tehran
Keivan Majidzadeh and Shahpar Haghighat, Breast Cancer Research Center, ACECR, Tehran, Iran., Tehran
Introduction Different disciplines in multiple research centres need to collect a large amount of various data, which commonly spends a lot of cost and time. Normative collection of necessary data in every field will increase speed and precision of research. Regard of registry Importance, the researchers tried to create a maximum comprehensive dataset for a multidisciplinary registry for breast cancer Iranian Breast Cancer Patients.
Methods First, the scientific literature and published studies were systematically reviewed and their related data elements were extracted. The results were presented to specialists in different disciplines to give their comments. The next phase was the survey of experts on a three-step Delphi, which had an expert panel in the last step. Finally, a combination of scientific experts and scientific literature review was used.
Result In the first step, 194 component (criteria) in 11 specialized (specific) breast cancer-related fields were extracted and sent to experts. In the first Delphi step the experts added 37 components, 11 elements were duplicates and not particularly helpful. Finally, the maximum dataset was confirmed by members of the Expert Panel with 220 independent data elements in 11 specialized multidisciplinary fields in breast cancer.
Conclusions The results consensus with Delphi method and expert Panel, was more useful for the Iranian breast cancer research centers because it was collected for their objectives and it will help to increase efficiency in similar centers in storage and retrieval of their data.
Abstract no. 485 Measuring quality of teleconsultation services from the patients’ perspective: development of a questionnaire
Leonie Thijssing, Esmée Tensen, Frank Horenberg and Monique Jaspers, Academic Medical Center- University of Amsterdam, Amsterdam
Introduction Healthcare provided through teleconsultation has proven to be as efficient and effective as face-to-face consultation with high diagnostics accuracy. Literature about patient satisfaction with teleconsultation generally shows a positive trend. It does however not provide insight into quality aspects of teleconsultation that contribute or impede patients’ acceptance of these services. The aim of this research is to develop a validated and standardized questionnaire to measure experienced quality of teleconsultation services from the patients’ perspective.
Method The methods used to develop the questionnaire were based on the CQI methodology. Following this methodology we first conducted a systematic literature study and focus groups with patients, both to acquire quality aspects of teleconsultation services patients perceive as important. Search terms in PubMed and PsychINFO related to the categories: teleconsultation services, patients’ perspective, and quality of healthcare. Revealed quality aspects were transformed into a draft questionnaire which was pre-validated among stakeholders: patients, GPs, specialists, and the teleconsultation provider. In the second phase two unstructured cognitive interview rounds with patients were conducted to test the reliability and comprehensiveness of the questionnaire. Patients in the focus groups and cognitive interviews experienced a teledermatology, telepulmonology or telecardiology consultation, were 18 years or older, and were invited after permission of the GP. Problems encountered with the questions were coded according to the QAS-99 methodology and, if necessary, rephrased.
Results The systematic literature review resulted in 1474 publications. After exclusion by abstracts and full-text analysis, 7 publications remained from which 20 quality aspects of teleconsultation services deemed important by patients, were derived. In the focus groups five (first) and six (second) patients came up with 22 quality aspects perceived as important of teleconsultations. Five quality aspects were similar to those in the review, resulting in a total list of 37 unique quality aspects which were mapped to nine CQI themes: Access to care (4), Communication and information (6), Patient management role (6), Competence (3), Organization of care (8), Costs and compensations (5), Effective and safe care (2), Continuity of care (2), Interpersonal conduct (1). The cognitive interview rounds revealed problems in 35/42 and 25/42 questions respectively. After these interviews, a total of 37 questions and/or their answer categories were reformulated, one question was removed and one question was added.
Discussion We aimed at developing a questionnaire to measure the quality of care delivered through teleconsultations as perceived by patients. We identified quality aspects using a systematic literature study and focus groups, developed a concept questionnaire which was pre-validated among different stakeholders, and conducted cognitive interviews to assess the reliability and comprehensiveness of the questionnaire. In future research, we will test the reliability, internal cohesion, and the psychometric power of the questionnaire.
Conclusion The questionnaire is essential to gain insight in patients’ experiences and perspectives on teleconsultation and can improve patient satisfaction with teleconsultation. Additionally, the questionnaire could be used by healthcare centers, patients, public health inspection and government to improve the quality of teleconsultation services, to decide about reimbursement and to measure and monitor quality of care.
Abstract no. 486 Perceptions of barriers and facilitators to the sharing and linkage of health related data - how the DASSL model responds
Rosalyn Moran, Health Research Board, Dublin 2
Introduction The paper will present results of research which examined the barriers and facilitators which impact on researchers’ and other data users’ ability to access, share and link data in Ireland. The work led to the development of the Data Access, Storage, Sharing and Linkage or DASSL Model which can enable safe access and linkage of sensitive data.
Method Interviews were held with 59 informants. Included were researchers from the public health and health services research data communities, actors involved in the collection, use, sharing and linkage of data in Ireland from a range of sectors and government departments. International best practice in the generation of solutions for safe data use and linkage were examined and their fit to the legislative, cultural, technical environment in Ireland was assessed.
Results Results of the interviews conducted and international experience are reflected in the DASSL model. The model comprises seven elements – five related to infrastructure and services [a health research data hub, safe haven, trusted third party and data linkage service, output checking and disclosure control and a research support unit] required for safeguarding data, and two related to the broad legislative and socio-cultural context needed to facilitate implementation of the model i.e. governance and public engagement.
Discussion The proposals put forward for creating a safe environment for access, sharing and linkage of research and related data need to be considered by all key stakeholders. Implementation of the DASSL model will allow for safe usage of currently under-exploited data which can help inform health and wellbeing but also serve national economic and social agendas.
Conclusion It is argued that if we want a safe and trusted modern infrastructure that will enable researchers to unlock the significant value of currently underexploited data for the public good, then the DASSL model or a similar model needs to be implemented in Ireland.
Abstract no. 487 Differential impact on presentations types and equity following the relocation of a metropolitan emergency department.
Mei Ruu Kok, Matthew Tuson, Bryan Boruff, Alistair Vickery, and David Whyatt, University of Western Australia, Perth
Introduction The closure of a coastal emergency department (ED) and the opening of a new inland site in metropolitan Perth, Western Australia, was expected to improve overall access to ED. The objective of this study was to examine the impact of ED relocation on different types of ED presentations.
Methods To address this aim, ED presentations were first divided into urgent/non-urgent medical and urgent/non-urgent trauma (injuries and poisoning) based on triage categorisation and ICD-10 coding. The ED relocation occurred in February 2015. Each SA3 regions was modelled separately, comparing February to October 2014 to the same period in 2015, after adjusting for population. Estimates of the burden of ED utilisation attributable to ‘distance to ED’, were obtained using separate Poisson regression models for adults and children. Confidence intervals were estimated using a stratified bootstrap approach, at the 95% significant level.
Results 13% of the entire population had their travel distance to the nearest ED decreased by at least 1km but on average 5km, while 5% of the population had their distance increased by at least 1km and on average 5km. The total number of ED presentations increased 7.1% within the region, with population growth of 3.6%. Areas near the new ED saw a significant increase in urgent and non-urgent medical presentations in adults. Change in distance contributed 30% to 70% of the increased in urgent medical presentations. The increase of non-urgent medical presentations attributed to change in distance varied between 20% and 40%. Conversely, significant decreases in both urgent and non-urgent medical presentations were observed in areas near the closing ED, with more than 200 fewer presentations in each category. For urgent medical presentations, these decreases were entirely attributable to the increased distance to ED. The increase in urgent and non-urgent trauma presentations attributed to decreased distance ranged from 9 to 15% and 15% to 30%, respectively.
Discussion Travel distance to ED has a greater impact on medical presentations than trauma presentations. Surprisingly, distance impacted strongly on urgent medical presentations. It is anticipated that urgent medical presentations are non-trivial events. However, there was a significant decrease in the proportion of urgent medical presentations being admitted in areas near the new ED, suggesting that possibly “inappropriate” use of ED increases with the greater convenience and accessibility to the ED service. No change in admission rates amongst urgent medical presentations was observed in areas close to the closed ED. Therefore, our results suggest that inequity existed both before and after the relocation of the ED. While overall access to ED increased with the opening of the new facility, new areas of inequity may have been created.
Conclusion The relocation of an ED has varying impact on different types of ED presentations in localised areas. The extent of this impact cannot be assessed using overall measures of ED utilisation or accessibility. Localised impacts on urgent medical presentations suggest that equity of access cannot be easily addressed by relocation of centralised services.
Abstract no. 490 SEAMPAT: Evaluation of the patient-application to improve continuity of medication use through patient engagement: preliminary results
Sophie Marien, Delphine Legrand, and Anne Spinewine, Université catholique de Louvain, Louvain Drug Research Institute, Clinical pharmacy research group (LDRI/CLIP), Bruxelles
Catherine Forget and Pierre Pagazc, Université de Namur, Research Centre in Information, Law and Society (CRIDS), Namur
Patrick Heymans, Université de Namur, Research Centre in Information system engineering (PReCISE), Namur
Ravi Ramdoyal and Valéry Ramon, Centre d’Excellence en Technologies de l’Information et de la Communication (CETIC), Charleroi
Introduction Continuity of medication management is a worldwide patient safety concern requiring information sharing among providers, patients, and families across different settings. Discrepancies consist of unexplained medication discontinuity and are a threat to patient safety. To improve continuity of care, patient engagement and the use of information technology (IT) are recognized as promising solutions. The SEAMPAT project was performed in the Walloon Region in Belgium and designed as a proof-of-concept approach. Its objective is to define and implement an electronic medication reconciliation process in which the patient is actively involved. Two secured applications are being developed: the patient-application and the medication reconciliation application. Those are linked to the Regional eHealth Network. We started with low-fidelity prototypes and moved to high-fidelity prototypes through Plan-Do-Study-Act cycles to improve the tool and adapt it to users’ needs and workflow. The present abstract focuses on the high-fidelity prototype of the patient-application.
Method Starting from information communicated on the Regional eHealth Network by the general practitioner (GP) and/or the hospital, the patient validates his/her medication list through the patient-application. This patient’s list can then be accessed by the GP and other physicians. We perform a three month (September - December 2016) prospective observational study including 48 patients from the Region of Namur. Patients, recruited through both general practices and hospital clinics, volunteered to participate. The purpose of this study is to 1) assess the accuracy and completeness of the medication history collected, 2) evaluate usability including patient satisfaction - using the System Usability Scale (SUS) - and additional questions2, 3) explore the influence of the patient-application on patient participation – using the patient activation measure (PAM)3 – concerning his medication plan. The first set of evaluation was performed straight after the kick-off session for each patient.
Results Half of the participants (52%) are at least 65 years old. The majority are men (67% = 32). Participants take an average of 9 daily medications. More than half take at least one over-the-counter medication. A quarter (25%) of the patients can be considered as actively participating in their care (PAM level 4). After the first session, most participants (75%) reported that the patient-application is easy to use. They filled out an average SUS-score of 69%. Participants are convinced the patient-application could help their physician saving time to update their medication list. A large majority (92%) think it could help to improve communication and reduce medication errors. Participants familiar with technology described the patient-application as user-friendly and 81% of participants would advise a friend to use the patient-application. Accuracy and completeness of medication lists generated using the application will be measured in December when patients will be more familiar with the patient-application.
Discussion and Conclusion Preliminary results on the patient-application are promising with respect to usability. Further evaluation will be performed in next December.
Abstract no. 491 A methodology for optimising spatial accessibility to inform rationalisation of specialist health services.
Catherine Smith and Andrew Hayward, UCL, London
Introduction In an era of budget constraints for the National Health Service, strategies for provision of services that save costs without sacrificing quality are highly valued. A proposed means to achieve this is consolidation of services into fewer specialist centres. Potential benefits include increased levels of expertise reduced variation in quality, and simplification of care networks. A drawback is that it may reduce accessibility of services, particularly for diseases such as tuberculosis which may require multiple weekly clinic visits. One measure of spatial accessibility is the time that it takes to travel between locations. The aim of this study was to use travel time data to investigate the effects of service rationalisation on spatial accessibility through the exemplar of tuberculosis clinics in London.
Methods We extracted the residential locations of tuberculosis patients notified in London between 2010 and 2013 from the Enhanced Tuberculosis Surveillance system. We estimated travel times to each of 29 tuberculosis clinics in London using the Transport for London Journey Planner service, accessed via its Application Programming Interface. We determined impacts on travel times if patients were assigned to clinics based on minimum travel time as opposed to pre-existing commissioning arrangements. To investigate the impacts of service rationalisation on travel time, we determined optimum configurations of clinics for each possible subset of clinics (one to 28). We used a combinatorial optimisation algorithm to identify the set of clinics that provided the shortest overall travel time for a random sample of 1,000 patients.
Results This study was based on 12,061 tuberculosis patient residential locations. Mean travel time to clinics used by patients was 33 minutes (standard deviation 15.1 minutes), significantly longer than to nearest available clinics (27 minutes, standard deviation 9.6 minutes, t-test p<0.01). A total of 7,337 (61%) patients used their nearest clinic 2,130 (18%) used a clinic more than 15 minutes further than their nearest clinic, and 767 (6%) more than 30 minutes. Using optimum combinations of clinic locations, and assuming that patients attended their nearest clinics, a mean travel time of less than 45 minutes could be achieved with three clinics of 34 minutes with ten clinics, and of less than 30 minutes with 18 clinics.
Discussion This study shows that, in a major urban conurbation with large numbers of clinics treating the same condition, specialist services may be rationalised without impacting spatial accessibility. In London, current mean travel times for tuberculosis patients to clinics could be achieved with an optimum combination of around ten of the 29 clinics in London, provided that patients used their nearest clinic. Limitations of this study included use of estimated rather than actual travel times and the assumption that patients have a preference for clinics with shorter journeys from their place of residence.
Conclusion We have developed a methodological approach to optimise selection of clinic locations in the context of service rationalisation. In urban conurbations this may allow increased efficiency and quality of specialist services without substantially affecting spatial accessibility.
Abstract no. 493 Harnessing publicly available data to promote quality improvement: the evolution of the AF and AF-related stroke data landscape tool
Andi Orlowski, Ruth Slater and Jane Macdonald, Greater Manchester Academic Health Science Network, Manchester
Introduction In collaboration with Public Health England’s (PHE) initiative to improve the management of Atrial Fibrillation (AF) and reduce the number of avoidable AF-related strokes, the Greater Manchester (GM) Academic Health Science Network (AHSN) is harnessing insights from publicly available data across the AF care pathway. The initiative is aligned with NICE clinical guidelines (CG180, 2014), which outline best practice to improve standards of care in AF, including anticoagulation for patients at high risk of stroke. Publicly available datasets capture different segments of the AF care pathway through a range of reporting routes and at different time points – from primary care identification and management of AF, to secondary care and emergency admissions for AF-related stroke.
Methods GM AHSN has developed a first-of-its-kind online data capture and visualisation platform in AF that effectively integrates these datasets to gain the most complete evidential picture to-date across the care pathway. This includes up-to-date Quality Outcomes Framework (QOF) and GRASP-AF reporting, and Hospital Episode Statistics (HES) and Sentinel Stroke National Audit Programme (SSNAP) data. The AF- and AF-related Stroke Data Landscape Tool incorporates data from all 15 AHSNs in the UK and their memberships, enabling each CCG to pinpoint local opportunities for improved AF diagnosis and/or anticoagulation. As reporting cycles of these key datasets are not synchronised with one another, the AF Landscape Tool has been designed to easily incorporate new data releases on either a rolling or an ad hoc basis.
Results Based on insights collected from these datasets, each AHSN is able to support the creation of specific business cases for the improvement of AF care in their regions. For example, the GM AHSN has created a business case for better anticoagulation in high-risk patients with AF, which predicts a return on investment within 2 years and a potential reduction in avoidable AF-related strokes in GM by 365 in 2017. GM AHSN has also supported its member organisations to build successful business cases for AF screening programmes or treatment reviews, targeted to CCGs or individual practices that have a demonstrable need. Once piloted, successful initiatives can be scaled up to regional, and potentially national outreach.
Discussion As part of a comprehensive PHE and AHSN AF stroke-reduction initiative, the Landscape Tool helps to ensure resources are directed where they are most needed and enable maximum returns on investment. Version 2.0 of the AF Landscape Tool is planned for release in 2017, and will focus on more easily sharable and customisable interfaces to enable broader access and uptake, as well as looking at ways to integrate other relevant datasets. Updates to the Tool will also rapidly capture any changes in key datasets, including new QOF indicators, to track progress against PHE’s goal of preventing 5000 AF-related strokes per year.
Abstract no. 495 Challenges and results with the record linkage of Austrian health insurance data of different sources
Barbara Glock, dwh GmbH, simulation services, Vienna
Florian Endel, TU Wien, Institute for Analysis and Scientific Computing, Vienna
Gottfried Endel, Head Association of the Austrian Social insurance companies, Vienna
Niki Popper, dexhelpp, Vienna
Introduction Due to data privacy issues, routinely collected data of different sources is pseudonymized (e.g. MBDS minimum basic dataset from the Federal Ministry of Health, which up to 2015 does not have a personal identifier). This makes statistical analysis for decision support and health care planning very difficult. Data from insurance carriers (FoKo) is event based: whenever a hospital reports, a new data entry is generated. To enable efficient, significant and quality assured data analysis for patient centred assertions record linkage of these episodes is required with the aim of finding a personal ID for each MBDS episode.
Method For historical data (GAP-DRG1) a linkage has been done before. Some challenges remain for new data (GAP-DRG2): in MBDS data for the whole of Austria is available, but in FoKo only data for persons insured by the Lower Austria sickness fund a hospital stay may be split off in more data entries, due to intermediate reporting from the hospital. In GAP-DRG2 an iterative deterministic record linkage is applied: (1) determine the quality assured matching variables, (2) determine the minimum set of matching variables (MVs), (3) base match: check for unique matches in three basic MVs, (4) start level 1 match: data entries need to be identical in all MVs except 1 (MVs are varied Step1: missing Step 2: contradicting). (5) – (9) The same procedure is done for up to 6 missing/contradicting MVs. (10) Start the iterative process with remaining episodes at (4).
Results In GAP-DRG2 1.410.165 episodes from FoKo and 1.272.813 episodes from MBDS are designated to be matched. In the basematch 611.591 (48,05%) episodes could be matched. In the first iteration, a total of 1.271.395 (99,88%) episodes are matched, where most of them are found in level 3 (3 MVs are allowed to be NULL or contradicting, most of them involving the episode’s identifier). Finally, after iteration 3 a total of 1.272.104 (99,94%) matched data entries are found.
Discussion The main innovations of this procedure include significant improvement of previously developed methods, mainly concerning reproducibility, stability and adaptability to new data and documentation on every single step of the linkage procedure, allowing researchers to comprehend the origin of a link and adapt their data analysis strategies. Checks if the registered age differs with +/- one year is included and quality checks on the base match showed that age and district differs a lot. The procedure achieves the best possible outcome for the new datasets and is highly suitable to be used within new data. Further evaluations will be included by the end of the year.
Conclusion The applied determinist record linkage provided a rate of 99,94% matches. It is a further developed, structured and improved implementation of the historic matching. As soon as new data is incorporated the same procedure can be applied to new data, for more recent years or the whole of Austria. This project is part of the K-Project dexhelpp in COMET – Competence Centers for Excellent Technologies that is funded by BMVIT, BMWGJ and transacted by FFG.
Abstract no. 497 Using consensus clustering and resampling to identify stable subclasses of disease
Allan Tucker, Brunel University, London
Pietro Bosoni and Riccardo Bellazzi, University of Pavia, Pavia
Svetlana Nihtyanova and Christopher Denton, University College London Medical School, Royal Free Hospital, London
Introduction Different diseases can affect people in different ways: Firstly, disease categories are often “umbrella” terms for a group of subcategories of disease. Take Systemic Sclerosis (SSc), which is a chronic connective tissue disorder, affecting the skin, peripheral circulation and multiple internal organs. It can be classified into two subsets - limited cutaneous SSc, where skin thickness affects only areas distal to elbows and knees and diffuse cutaneous SSc, where skin involvement can affect the whole body. Of course, these are unlikely to be the only subcategories and discovering others will be essential if we are to make more informed diagnoses. Secondly, people respond in different ways to the same disease. For example, in SSc some patients are more affected with complications in the lungs, whilst others are in the kidneys, heart or gastro-intestinal system. Patients undergo regular assessments, including physical examination and a range of blood and internal organ tests. These tests can be used as predictors of organ complication / mortality. Systemic sclerosis shares traits that are common to many diseases: Variability in progression between different individuals, including subclasses of disease that can inform how an individual will progress, along with the eventual progression to an advance stage. If we can identify the different subclasses of disease along with the cohorts of patients that belong to them, then we can improve diagnosis, as well as build models that are more tailored to smaller groups of individuals to better manage disease progression.
Methods We are exploring the use of classification methods to predict different disease outcomes using a combination of clinical indicators related to SSc. We use unsupervised methods to pre-process patients into different cohorts and identify variations in symptoms. In particular, we explore how consensus clustering can be used in conjunction with bootstrap resampling to identify more stable and representative subclasses of disease. These clusters are used to improve models for disease classification (interpretability and accuracy). We assess how predictive the similarity of different bootstrapped clusters are in identifying stable underlying disease subclasses using the weighted Kappa metric.
Results Preliminary results on openly available diabetes data (from the UCI ML repository) and data collected at UCL’s Royal Free Hospital London, indicate that metrics such as weighted Kappa can be used on clusters generated from resamples to indicate how accurately these subgroups of patients reflect true underlying classes and subclasses of disease (correlations of 0.73 for diabetes data and 0.67 for SSc data). What is more, robust and consensus clusters are shown to generate more predictive models for diagnosing patients (improvements from 60% to 62% for diabetes data, and from 62% to 72% for SSc data).
Conclusions If we can successfully identify subclasses of disease, then we can better tailor our models for diagnosing disease and predicting progression. This work is making some first steps into identifying stable clusters of patients that better represent these underlying subclasses. What is more metric such as Weighted Kappa can be used to give us confidence in these discovered groupings.
Abstract no. 498 Using machine learning methods to create chronic disease case definitions in a primary care electronic medical record
Cord Lethebe, Tolulope Sajobi, Hude Quan, Paul Ronksley, and Tyler Williamson, University of Calgary, Calgary
Introduction The emergence of electronic medical records (EMRs) in primary care in Canada provides a unique opportunity for chronic disease surveillance. Historically, chronic disease surveillance has been difficult in the primary care setting because of the limited administrative data available within primary care. EMR databases include an abundance of rich information that, if properly harnessed, can provide an opportunity for improved chronic disease surveillance. However, the utility of the chronic disease surveillance information is dependent on the quality of the EMR data, as well as the quality of the case identification algorithm that is used. We will present an evaluation of the relative accuracy of a set of case identification algorithms built using machine learning methods as compared to a definition based on clinician expert consultation.
Methods Data was collected from the Canadian Primary Care Sentinel Surveillance Network (CPCSSN). CPCSSN is a pan-Canadian organization that collects primary care EMR data for over 1.3 million Canadians and stores it in a standardized format. A chart review study was conducted previously for the presence of 8 chronic conditions (hypertension, osteoarthritis, diabetes, depression, dementia, COPD, Parkinson’s disease, and epilepsy) in a sample of 1920 primary care patients from CPCSSN. The results of this validation study will be used as training data for a series of machine learning classification techniques capable of creating interpretable case definitions. Features will be selected from billing codes, medication prescriptions, specialist referrals, laboratory values, and physician free-text from encounter diagnoses and health-problem lists collected by CPCSSN. Classification and Regression Tree (CaRT) methods, C5.0 decision tree methods, logistic regression using a lasso (or L1) penalty, and forward stepwise logistic regression will be used for feature selection and case definition development. The lasso and forward stepwise logistic regression methods are commonly used for feature selection, but are limited in their interpretability in comparison with decision trees. Complexity parameter values will be determined using k-fold cross validation methods to minimize out-of-bag error. New case definitions will be developed and estimates of sensitivity, specificity, positive predictive value, negative predictive value, and accuracy will be estimated using bootstrap methods. The final case definitions will be compared with committee-created case definitions that are currently implemented in CPCSSN.
Results This is research in progress. Preliminary results show that machine learning methods are capable of creating case definitions that are “as good or better” than committee-created case definitions in terms of their classification accuracy and that the machine learning based definitions involve fewer criteria.
Discussion It appears as though decision tree methods are capable of creating case definitions from a large set of possible features that are easily interpretable.
Conclusion By developing a methodology that can create case definitions in an automated fashion, we can quickly develop and validate case definitions for a variety of chronic conditions and improve surveillance. This is important because quality surveillance allows us to accurately assess the burden of chronic disease in populations and improve efficiency in terms of resource planning and allocation.
Abstract no. 499 Is hearing loss an early complication of diabetes?
Simon Cichosz and Ole Hejlesen, Aalborg University, Aalborg, Denmark
Introduction Hearing loss affects approximately ∼20% of the U.S. adult population and is a major public health worry. Diabetes is a metabolic disease that for many leads to vascular and neurological degeneration. However, evidence on vascular and neurological degeneration effects of diabetes on hearing as an early complication of diabetes is still insufficient.
Methods We examined hearing impairments in undiagnosed and diagnosed adult people with diabetes from the NHANES (2011-2012) and compared them with people without diabetes. Along with the diabetes questionnaire, fasting plasma glucose (FPG) and the oral glucose tolerance test (OGTT) were used to identify people with diabetes. Pure-tone were assessed using a clinical audiometer. Pure-tone average was assessed for low/medium frequencies (500- 2000 Hz) and for high frequencies (3000- 8000 Hz).
Results 2078 people were included in this study. The pure tone average for low / medium frequencies in the worst ear was 15 dB [546] for people with undiagnosed diabetes, 16.7 dB [550.8] for known diabetes and 10 dB [1.731.7] without diabetes. The pure tone average for high frequencies was 28.8 dB [11.274.8] for undiagnosed diabetes, 32.5 dB [12.569.1] for known diabetes and 17.5 dB [3.862.5] without diabetes. The differences remained significant after adjusting for age (P<0.05).
Conclusion Our study suggests that hearing reduction is a frequent complication for people with known diabetes and undiagnosed diabetes. Future work should focus on the mechanisms involved in this diabetes related hearing impairment.
Abstract no. 502 Predicting diabetic foot ulcer outcome: the potential use of on-site observations
Clara Schaarup, Faculty of Medicine, Aalborg University, Aalborg, Denmark
Introduction More than 15% of all diabetic foot ulcers lead to an amputation. Several studies focus on the benefit of using wound outcome prediction. The majority of the model features are based on data from blood tests and various cardiovascular measurements. These features, however, are not available to nurses. This study investigates the potential use of nurses’ on-site observations for wound prediction.
Methods 50 foot ulcer cases were included. Data was obtained from the Danish wound database, Pleje.net, and was collected from January 2006 to October 2016 by Danish community nurses and wound specialists. 19 different wound features were tested. The features covered characteristics related to the three wound stages: the inflammatory phase, the proliferation phase and the maturation phase. We developed a pattern prediction model to forecast individualized development of diabetic foot ulcers into one of two classes: (i) healing, and (ii) no healing, of the diabetic foot ulcer. A positive prediction (test results) corresponds to the prediction (i) healing. In other words, the sensitivity is the number of cases where healing is predicted, in cases where healing actually occurs, divided by the number of cases where healing occurs. Since data includes both nominal and ordinal data types, a binary logistic regression classification was chosen. We used the five features with the highest separability between classes and a 2-folds cross validation.
Results The mean age for the participants was 70 (±14) years, 22% were women, and the overall healing rate among the cases was 72%. The model for predicting healing of diabetic foot ulcers included the following features in the binary logistic regression model: ‘callus’, ‘wound size’, ‘gender’, ‘epithelializing’ and ‘hypergranulation’. The ROC performance of the classifier is seen in Figure 1. The data yielded a cross validated area under the curve (AUC) of 0.66. The threshold can be set arbitrarily. When comparing the performance, one threshold will lead to a sensitivity of 83% and a corresponding specificity of 57%. This corresponds to predicting 8 out of 14 non healing wounds and predicting 30 out of 36 healing wounds. Choosing another threshold, a sensitivity of 63% and a specificity of 84% can be obtained, which corresponds to predicting 12 out of 14 non healing wounds and 23 out of 36 healing wounds.
Discussion The literature has shown several relevant features for predicting wound healing. Most of these features, however, are not for the community nurses. We identified five features from the wound anamnesis which are readily available to the community nurses. Two of these features are used in other prediction models. The remaining three, however, ‘epithelializing’, ‘hyper granulation’ and ‘callus’ have, to our knowledge, not been used in other models.
Conclusion In conclusion, features from community nurses’ wound anamneses are relevant features when predicting wound outcome.
Abstract no. 503 A secure smartphone application for clinical research on wound healing: Nurstrial
Francois-Andre Allaert, Chaire d’évaluation des allégations de santé, ESC et Cenbiotech, DIJON
Intoduction For several decades clinical and observational studies of wounds and wound healing were conducted on paper case report form (CRF) or electronic CRF corresponding to inclusion and follow-up medical visits and between these visits on questionnaires which were rarely daily filled up by the patients and/or the nurses and associated with photos of the wound.
Methods The use of Information Communication Technology and especially Smartphone applications can overhaul this traditional framework of study by introducing closer follow-up of the wound healing process, systematized image capture with few constraints, and even the more active involvement of those must concerned – the patients themselves. The main difficulty to solve is not the development of a Case Record Form on a smartphone being able to manage data, pictures and analogic scale but guaranty the medical secrecy and the protection of medical personal data in accordance to the European directive on data protection.
Results We develop a system of cryptography allowing the involvement of medical practitioner, caregivers and patients themselves in the data records using asymmetric algorithms which have been validate in the framework of a national wound observatory by the French health and data protection authorities. Briefly summarised, the physician downloads the Nurstrial Application and the system proposes to him/her to enter the data for the initial visit, follow-up visits, and undesirable events for the different patients with wounds. For each new patient, the system randomly generates a unique cryptographic identifier using a process leading to the internal creation of a cryptogram encoded on 128 bits generated by UUID-V4 combining hash algorithms and pseudo-random generators. Patients have access to the application via a special-purpose procedure for sequencing information sent in the course of the various transmissions with information sent by the physician, with no risk of collision or duplication, without ever having access to any nominal or identifying information via a process described earlier using a cryptographic identifier encoded on 128 bits generated by UUID-V4 that combines hash algorithms and pseudorandom generators. When information is not sent to the database, a message is sent to the doctor or the patients without knowing their identity.
Discussion The main limitation on the Nurstrial® system is of course the need to have an i-phone or Android type smart-phone but these systems now make up more than 85% of the total number of recent smartphones in France. The Nurstrial® application operates on smartphones with an Android 4.1 operating system and higher and on Apple smartphones with iOS 7 and higher. Here again, few people use old telephones and the phone companies and smartphone manufacturers are the first to urge people to update regularly to new versions.
Conclusion Nurstrial® is a real step forward in terms of quality for the conduct of clinical and observational studies in the area of wound healing. It enables information to be recorded in real-time in the form of text and images that are collected and potentially pooled by all of the actors in the healthcare chain: physicians, nurses, and patients too.
Abstract no. 504 Comorbidities and categorical alcohol intake in relation to upper gastrointestinal (GIB) and intracerebral (ICB)
Shreya Shukla, Adriana Amarilla Vallejo, Stevo Durbaba, Mark Ashworth, and Mariam Molokhia, King’s College London, London
Victoria Cornelius, Imperial College London, London
Introduction Upper gastrointestinal bleeding (UGIB) and intracerebral bleeding (ICB) are associated with serious morbidity and have been linked to medication use, including anticoagulants (AC) and antiplatelets (AP), amongst other risk factors,1 but there are few studies on the risk contribution from co-morbidities and level of alcohol intake.2-4 The aim of the study was to examine effects of comorbidities and alcohol intake with UGIB and ICB in adults ≥18 yrs.
Methods Case-control study of UGIB and ICB in adults using Lambeth DataNet EHRs from 51 Lambeth practices with a total of 286,162 patients, in South East London (2013). Univariable and multivariable logistic regression analyses were carried out using STATA 14, in individuals aged under and over 75 years. Crude analyses were performed adjusted for age and gender. Multivariable analyses were adjusted for age, gender, ethnicity, alcohol intake, QuOF comorbidity codes, smoking status, hypertension, previous cancer, previous stroke, liver disease, renal disease (≥CKD 3), and concomitant drug use known to increase bleeding risk (e.g. SSRIs, COXIBs, NSAIDs and interacting antibiotics). Controls were individuals without any recorded history of UGIB or ICB.
Results Results were stratified by age (<75 and >75yrs) because of significant age interaction, p<0.001. < 75 yrs UGIB significant risks (p<0.05) included: DOAC and PPI use, liver disease, high alcohol consumption (≥28 units/week), SMI and depression, stroke, SSRIs, male gender, asthma, smoking, interacting antibiotics and age for >75yrs PPI use, depression, stroke, male gender and age increased risk of UGIB. We found no association of steroids with asthma and including steroids in our models did not alter bleeding risk estimates.
< 75 yrs ICB significant risks (p<0.05) included: AP, AC and SSRI use, dementia, male gender, African ethnicity, heart failure, hypertension, ≥CKD 3, smoking and age for >75yrs significant risks were AC, AP use, dementia, SSRIs, male gender, heart failure, African ethnicity and ≥CKD 3, with protective effects for alcohol intake <28u/wk.
Discussion Additional to recognised risk factors we identified UGIB risks increased with several comorbidities including SMI, depression and asthma, and alcohol intake ≥28u/week. For ICB risk, main comorbidities included dementia, heart failure, hypertension and ≥CKD 3 with protective effects for alcohol intake <28u/week.
References
Olsen, J.B. et al., 2011. Bleeding risk in ‘real world’ patients with atrial fibrillation: comparison of two established bleeding prediction schemes in a nationwide cohort. Journal of Thrombosis and Haemostasis, 9(8), pp.1460-67.
García Rodríguez, L.A., Lin, K.J., Herna ́ndez-D ́ıaz, S. & Johansson, S., 2011. Risk of Upper Gastrointestinal Bleeding With Low-Dose Acetylsalicylic Acid Alone and in Combination With Clopidogrel and Other Medications. Circulation, 123(10), pp.1108-15.
Hazlewood, K.A., Fugate, S.E. & Harrison, D.L., 2006. Effect of Oral Corticosteroids on Chronic Warfarin Therapy. The Annals of Pharmacotherapy, 40(20), pp.2101-06.
Lin, C.C. et al., 2013. Risk factors of gastrointestinal bleeding in clopidogrel users: a nationwide population-based study. Alimentary Pharmacology and Therapeutics, 38(9), pp.1119-28.
Abstract no. 512 The application of a web-based decision support aid to the selection of treatment options for osteoarthritis
Sally Wortley, Hema Umapathy, and David Hunter, University of Sydney, Sydney
Glenn Salkeld, University of Wollongong, Wollongong
Jack Dowie, London School of Hygiene and Tropical Medicine, London
Introduction Annalisa© (AL) is a web-based decision-support aid grounded in multi-criteria decision analysis (MCDA). Within a single ‘device’ screen, Annalisa synthesizes the best available estimates of the benefits, harms and other factors related to treatment options, captures personal preferences through importance weights for each and combines them into ranked sum score that presents an ‘opinion’ on all treatment options, from most to least preferred. The aim of this study was to evaluate the feasibility and usefulness of the Annalisa decision aid amongst people who are either contemplating their treatment choices for osteoarthritis or in a pre-contemplation phase of decision making.
Methods People were invited to participate in the decision aid study through a stand-alone link on the ‘Myjointpain.org.au’ website and through its Facebook site. The survey consisted of a series of initial questions on which treatment options they were considering and, based on their response, a short OA decision aid. Participants were then given an opportunity to undertake a more thorough detailed personalised decision aid, followed by a set of user evaluation questions.
Results 3072 people clicked to access the decision-aid with 1133 people consenting to being part of the study. 1923 people did not click past the consent section. Out of the 1133 people who consented, 837 people completed the first nine questions (74%), 511 people completed the ‘short version’ Annalisa decision aid (45%). 161 people ‘completed’ the entire decision-aid (14%) and 63 people with full information (6%). Of the 837 who completed the initial questions, 57% chose lifestyle & medicines, 18% medicines and surgery, 16% lifestyle and surgery and 9% medicines only. The most important factors considered by people in their ‘short DA’ were: avoiding serious side effects of treatment, improvement in functioning, avoiding pain, avoiding stiffness, minimizing cost and mid side effects. Of the 511 who completed the DA, 65% were either not surprised or only slightly surprised by the highest ranked option generated as a result of their own importance weights for the benefits, harms and other factors. 32% of people said that the DA changed their views on the best treatment and all said that they were very likely to see their GP or specialist as a result in the next 6 months. Of the 161 people who completed the more thorough and personalized DA, the highest ranked treatment options were: strength training, followed by cardiovascular exercise, education and paracetamol. Of the small number of people who answered the evaluation questions, 59% said they would rate their experience in using the Annalisa decision aid as positive and 42% said that their experience of using the decision aid would help them improve the quality of their future decisions.
Discussion & Conclusion Quantitative decision aids are useful for some people and not others. Given the drop off in participation from the short version DA to the longer ‘personalised’ DA, the length and display of decision aid needs to be tested with those with osteoarthritis. People are interested in the effectiveness of lifestyle interventions.
Abstract no. 513 The ELAStiC (electronic longitudinal alcohol study in communities) project
Ashley Akbari, Ronan Lyons, Damon Berridge, FARR Institute (CIPHER - Swansea), Swansea
John Gallacher, Oxford University, Oxford
John Macleod, Jon Heron, Mathew Hickman, Liam Mahedy, University of Bristol, Bristol
Mark Bellis, Public Health Wales, Cardiff
David Fone, Shantini Paranjothy, Daniel Farewell, Lazlo Trefan, Annette Evans, Frank Dunstan, Vanessa Gross, and Simon Moore, Cardiff University, Cardiff
Karen Tingay, Administrative Data Research Centre - Wales, Swansea University, Swansea
Amrita Bandyopadhyay, Swansea University, Swansea
Introduction The ELAStiC (Electronic Longitudinal Alcohol Study in Communities) project was established to determine factors that predict pathways into alcohol misuse and the life-course effects of alcohol use and misuse on health and well-being. This is achieved through accessing existing longitudinal data that are key sources of evidence for social and health policy, developing statistical methods and modelling techniques from a diverse range of disciplines, working with stakeholders in both policy, practice and the third sector to bring relevance to the work, and to bring together a diverse team of experts to collaborate and facilitate learning across diverse fields.
Method The project is linking data that include cohort studies such as UK Biobank, ALSPAC (Avon Longitudinal Study of Parents and Children), Millennium Cohort Study, British Household Panel Survey, Understanding Society, E_CATALyST (Caerphilly Health and Social Needs Electronic Cohort Study) and WECC (Wales Electronic Cohort for Children). These data will be linked with routine data from primary and secondary healthcare in England, Scotland and Wales. Additional data from education and police data source will also be linked as part of the project. The main work packages for the project are:
Methodological Innovations Methodological developments in mechanisms for correcting bias in reporting alcohol consumption and for combining routine data with cohort data the application of Markov models for examining the extent to which past behaviour influences future behaviour, and econometric hedonic pricing methods for providing insights into the costs of alcohol-related harm.
Pathways into Harm Do family structure, household composition, youngsters’ previous ill-health and educational attainment predict their use of alcohol and what socio-economic factors and household transitions contribute to hazardous alcohol consumption in adults?
Secondary Harms What is the effect on children’s health and educational achievement of living in households in which one or more adults has experienced alcohol-related harm?
Mental Health & Well-Being What is the relationship between alcohol consumption, hospital admission and mental health in adults and children?
Results The results of the data linkage between the multiple cohorts and health, education and police data will be reported. The challenges of linking cohort and other data types from different nations will be discussed.
Discussion The issues surrounding UK wide data linkage and access are likely well known, especially involving numerous cohorts and countries. Our project has looked to deal with these limitations and delays by piloting methodologies within countries and cohorts which we have had more success in linking and obtaining, before expanding once the data becomes available.
Conclusion Our project will aim to provide evidence that informs the UK Government’s commitment to “radically reshape the approach to alcohol and reduce the number of people drinking to excess”, by working with existing longitudinal data collected in the UK to inform policy and practice.
Abstract no. 514 Factors affecting patients’ use of electronic personal health records
Alaa Abd-alrazaq and Hamish Fraser, Yorkshire Centre for Health Informatics, University of Leeds, Leeds
Peter Gardner, School of Psychology, University of Leeds, Leeds
Introduction Electronic personal health records (ePHRs) are web-based tools that enable patients to access parts of their health records and perform other services such as booking appointments and requesting repeat medications. Despite many potential benefits of ePHRs, the adoption rate of these tools is often very low. We describe here a systematic review of the literature regarding factors that affect patients’ use of ePHRs.
Methods This systematic review employed five search sources: 44 bibliographic databases, hand searching, checking reference lists, contacting experts and professionals, and web searching. Further, three groups of search terms, related to population, intervention and outcome, were used for searching databases. Detailed study eligibility criteria and forms were developed in this review. The Mixed Methods Appraisal Tool (MMAT) was used to appraise the quality of the included studies. The results of studies were synthesised narratively according to the outcome: intention to use, subjective measures of use, and objective measures of use.
Results 4843 titles and abstracts were screened, 245 full texts were read, and 85 publications were included in the review. According to the MMAT, the quality of qualitative studies was clearly higher than quantitative and mixed-methods studies. Among 20 studies that assessed the factors affecting patients’ intention to use ePHRs, 57 factors were grouped into 4 main categories: personal factors (35 factors), human-technology interaction factors (11), organisational factors (10), and social factors (1). The factors that affect the subjective use of ePHRs were tested in 17 studies classified into 4 groups: 32 personal factors, 8 human-technology interaction factors, 3 organisational factors, 1 social factor. The factors that influence the objective use of ePHRs were assessed in 46 studies classified into 3 groups: 70 personal factors, 11 human-technology interaction factors, and 14 organisational factors. The most tested factors were age (69 studies), gender (60), educational level (34), race (29), perceived usefulness (26), and income (25).
Discussion This review found more than 100 exclusive factors that may affect the acceptance of ePHRs. However, most of these factors either were examined by very few studies, or there is no consensus on their effect among the included studies. Therefore, definitive conclusions regarding the effect of these factors on intention to use, subjective use, or objective use of ePHRs could be drawn for only 24 factors. Of these 24 factors, only 4 factors are common among the 3 outcomes (intention to use, subjective use, and objective use): internet access (positive), perceived usefulness (positive), privacy concerns (negative), and gender (no relationship). The review is more rigorous than similar reviews in terms of several aspects such as eligibility criteria, search sources and terms, study quality assessment, and findings synthesis.
Conclusion The factors that may affect patients’ acceptance of ePHRs that have been studied are numerous and varied. In order to improve the adoption rate, the factors supported by multiple studies should be considered carefully before and after the implementation of ePHRs. Future researchers should conduct more theory-based and longitudinal studies that assess objectively the factors affecting the use of ePHRs.
Abstract no. 515 The European injury database: supporting injury research and policy across europe
Samantha Turner, Farr Institute, Swansea University, Swansea
Ronan Lyons, Farr Institute (CIPHER - Swansea), Swansea
Wim Rogmans, Eurosafe, Amsterdam
Rupert Kisser, Eurosafe, Vienna
Bjarne Laursen, National Institute of Public Health, Copenhagen
Huib Valkenberg, Consumer Safety Institute, Amsterdam
Dritan Bejko, Luxembourg Institute of Health, Luxembourg
Robert Bauer and Monica Steiner, Austrian Road Safety Board, Vienna
Gabriele Ellsaesser, State Office of Environment, Health and Consumer Protection, Brandenburg
Ashley Akbari, Swansea University, Swansea
Introduction Although various injury data sources exist in Europe many lack sufficient size, scope, detail or comparability, to support injury prevention research or policy development. Emergency department (ED) records offer one of the most comprehensive sources of injury data however, heterogeneous hospital data collection systems prevent comparative analyses between countries.
Methods As part of the Joint Action on Monitoring Injuries in Europe (JAMIE) project, and now the BRIDGE-Health (BRidging Information and Data Generation for Evidence-based Health Policy and Research) development the European Commission (EC) funded the development of a standardised European Injury Data Base (IDB). The IDB comprises two datasets: the Full DataSet (FDS) and Minimum DataSet (MDS). Although the MDS collects less detail than the FDS it is simpler for countries to adopt, and still sufficient to allow enumeration of injuries in key areas such as the home, leisure, work, road, falls, sports, and self-harm. Training, guides and rigorous quality checks, ensure consistency across participating countries.
Results To date, 26 countries have submitted 7,170,069 ED records (years 2009-2014) to the IDB in MDS format, and 20 countries have provided reference population data, enabling the calculation of ED attendance rates by country. As an exemplar, in 2013, ED rates for all injuries varied between 116 per 1000 population in Luxembourg to 33 per 1000 population in Finland. The MDS has provided a valuable source of data for several organisations across Europe, and can be accessed via several channels, including an online tool. The MDS strives to contribute data to the “European Core Health Indicators” (ECHI), including the “home, leisure and school accidents” indicator (ECHI29b).
Discussion The range in national IDB rates (e.g. 33 – 116 injury attendances per 1000 population) is quite large, suggesting that injury morbidity isn’t the only influencing factor. Variations in national health care systems, accessibility and utilisation of EDs, differences in data sampling methods and sample sizes, and other data quality issues, are likely to affect IDB estimates. Nonetheless, the IDB reports one of the lowest ranges in rates when compared to other European level health data systems.
Conclusions The development of the MDS is a great achievement and provides Europe with a valuable source of comparable injury data. Work is ongoing to ensure the IDB-MDS is as valid and representative as possible.
Abstract no. 517 Challenges in using hierarchical clustering to identify asthma subtypes: choosing the variables and variable transformation
Matea Deliu, University of Manchester, Health e-Research Centre, Manchester
Tolga Yavuz, University of Manchester, Manchester
Matthew Sperrin and Umit Sahiner, Imperial College London, London
Danielle Belgrave Cansin Sackesen, Adnan Custovic and Omer Kalayci, Haceteppe University, Ankara
Introduction The use of unsupervised clustering has identified different subtypes of asthma. Choosing the variables to input into the clustering algorithm is one of the important considerations. The majority of previous studies selected variables based on expert advice, whilst others used dimension reduction techniques such as principal component analysis (PCA). We aimed to compare the results of unsupervised clustering when using raw variables, or variables transformed using dimensionality reduction techniques.
Methods We recruited 613 asthmatics aged 6–23 years (Ankara, Turkey). We conducted extensive phenotyping, with 49 variables including demographic data, sensitization, lung function, medication, peripheral eosinophilia, and markers of asthma severity. We performed hierarchical clustering (HC) using: (1) all variables and (2) PCA-transformed variables.
Results PCA revealed 5 components describing atopy and variations in asthma severity, which were then used to infer cluster assignment. The optimal HC solution in both PCA-transformed and raw untransformed data identified 5-clusters which were not identical. Both identified mild asthma with good lung function, severe atopic asthma and late-onset atopic mild asthma. Clustering without PCA identified early-onset severe atopic asthma and late-onset atopic asthma with high BMI, whilst early onset non-atopic mild asthma in females was identified in HC with PCA. However, cluster stability was poor. A comparison of the two cluster outputs revealed four key features driving cluster allocations: age of onset, asthma severity, atopic status, and asthma exacerbations. Re-clustering with these features markedly improved cluster stability.
Conclusion Different methodologies applied to the same dataset identified differing clusters of asthma. We identified four main features that could be represent a new framework for clustering children with asthma. This will eventually bring us one step closer to identifying heterogeneity and subtypes of asthma thereby paving the way towards precision based medicine.
Abstract no. 521 Main usability problems of a home monitoring tool for heart failure patients and COPD patients: connecting medical hardware with app interface
Hester Albers, Martine Josefien Maria Breteler and Monique Jaspers, Academic Medical Center, University of Amsterdam, Amsterdam
Gaby Anne Wildenbos and Linda Peute, FocusCura Futurelab for Care, Driebergen Rijsenburg
Introduction Home telemonitoring (HTM) for the chronically ill is increasingly used as a solution to the growing problem of an aging population. Although it is suspected that older users experience difficulties with the use of monitoring systems and the associated measurement equipment, little evidence-based information on the concrete issues older adult users experience exists. Therefore, it is important that usability evaluations are performed on existing telemonitoring systems. This study focuses on the evaluation of cVitals, a HTM application. The aim of this study is to evaluate which usability issues older Chronic Obstructive Pulmonary Disease (COPD) and Heart Failure (HF) patients encounter using cVitals at home.
Method A usability evaluation combining think aloud (TA) sessions and an interview with the designer of cVitals was conducted. The interview with the designer was structured according to the extended usability guidelines of the Healthcare Information and Management Systems Society (HIMSS). The TA study was carried out with 5 HF and 5 COPD patients at their home. Observed problems and suggestions were analysed and categorized using the extended HIMSS guidelines and the framework for mHealth for older users.
Results The designer of cVitals showed that 13 of the 15 aspects of the extended HIMSS guidelines were implemented in cVitals. The usability evaluation identified 51 usability issues and 14 suggestions for improvement. Of the identified usability problems by the TA, 8 problems were related to the connection between the measurement equipment and the home monitoring application. Connection issues were mostly caused by a limited reach- and problems with the Bluetooth connection. The most used classifications were ‘no knowledge of functionalities’ and ‘effective information presentation’.
Discussion The TA study was an effective method for identifying usability problems with cVitals. It identified several different usability problems, especially regarding the connection between hardware and the home monitoring application. Patients reported high satisfaction with the system. Identified usability issues corresponded with other usability studies, carried out with older HF and COPD patients.
Conclusion The usability evaluation helped to define the usability problems and suggestions for improvement were described. This can lead the further development of this and other home monitoring application(s) and contributes to evidence-based knowledge on usability of HTM applications for older users. Better usable HTM applications leads to a higher acceptance of HTM by this target group.
Abstract no. 525 High-dimensional statistical approaches for heterogeneous molecular data in cancer medicine
Nicolas Staedler, Roche, Basel
Frank Dondelinger, Lancaster University, Lancaster
Sach Mukherjee, German Centre for Neurodegenerative Diseases, Bonn
Introduction Molecular interplay plays a central role in basic and disease biology. Patterns of interplay are thought to differ between biological contexts, such as cell type, tissue type, or disease state. Many high-throughput studies now span multiple such contexts and the data may therefore be heterogeneous with respect to patterns of interplay. This motivates a need for statistical approaches that can cope with molecular data that are heterogeneous in a multivariate sense.
Methods In this work, we exploit recent advances in high-dimensional statistics1-2 to put forward tools for analysing heterogeneous molecular data. We model the data using Gaussian graphical models,3 and develop two useful techniques based on estimation of partial correlations using the graphical lasso:4 a two-sample test that captures differences in molecular interplay or networks, and a mixture model clustering approach that simultaneously learns cluster assignments and multivariate network models that are cluster-specific.
Results We demonstrate the characteristics of our methods using an in-depth simulation study, and proceed to apply them to proteomic data from The Cancer Genome Atlas (TCGA) pan-cancer study,5 consisting of protein expression measurements for 181 cancer signalling proteins in 3,500 patients spanning 11 different cancer types. We first test for pairwise network differences between cancer types. Subsequently, we use the mixture model to identify clusters of patients that present similar protein signalling networks and we visualize the networks.
Discussion Our analysis of the TCGA data provides formal statistical evidence that protein networks dier significantly by cancer type. Furthermore, we show how multivariate models can be used to refine cancer subtypes and learn associated networks.
Conclusion Our results demonstrate the challenges involved in truly multivariate analysis of heterogeneous molecular data and the substantive gains that high-dimensional methods can offer in this setting.
References
Stadler, N. and Mukherjee, S. (2013a). Penalized estimation in high-dimensional hidden Markov models with state-specific graphical models. Annals of Applied Statistics, 7:2157-2179.
Stadler, N. and Mukherjee, S. (2013b). Two-sample testing in high-dimensional models. arXiv.org:1210.4584.
Friedman, J., Hastie, T., and Tibshirani, R. (2008). Sparse inverse covariance estimation with the graphical Lasso. Biostatistics, 9(3):432-441.
Rue, H. and Held, L. (2005). Gaussian Markov random fields: theory and applications. CRC Press, London.
Akbani, R., Ng, P. K. S., Werner, H. M., Shahmoradgoli, M., Zhang, F., Ju, Z., Liu, W., Yang, J.-Y., Yoshihara, K., Li, J., et al. (2014). A pan-cancer proteomic perspective on The Cancer Genome Atlas. Nature Communications, 5(3887).
Abstract no. 529 Survival following discharge from critical care
Angharad Walters, Ronan Lyons and Damon Berridge, FARR Institute (CIPHER - Swansea), Swansea
Richard Pugh, Betsi Cadwaladr University Health Board, Rhyl
Ceri Battle and David Hope, Abertawe Bro Morgannwg University Health Board, Swansea
David Rawlinson, Emergency Medical Retrieval & Transfer Service (EMRTS) Cymru, Swansea
Tamas Szakmany, Aneurin Bevan University Health Board, Newport
Introduction Critical care provides specialist treatment for patients with life-threatening injuries and illnesses. Outcomes data are essential to identify where resources need to be focused to provide safer care. Limited data exists on mortality risk factors for ICU survivors in Wales, in particular, little is known about the organisational factors affecting 1-year outcome. The objective of the study is to determine survival following discharge from critical care and to identify the factors that increase the risk of mortality.
Methods Anonymised critical care data reported from 1st April 2006 are held within the Secure Anonymised Information Linkage (SAIL) databank. The critical care data was linked with ONS mortality data, the Patient Episode Database for Wales (PEDW) inpatients data (to obtain hospital admission details) and the Welsh Demographic Service dataset (to obtain demographic details). Details of patient care during the critical care admission such as the organs supported and discharge details such as the time of day, along with patient demographics such as age, sex and socio economic factors were used in the analysis. The cohort included the first critical care episode for Welsh patients, aged 16+, who were discharged alive between 2006 and 2013. Patients were followed up to 365 days after discharge, outward migration or death.
Results 40,631 patients discharged alive from critical care were followed up. The estimate of the risk of death at days 30, 90 and 365 following discharge is 7.4%, 11.5% and 19.5% respectively. Factors from Cox regression that increase the risk of mortality include male sex, increasing age, increasing comorbidity score, increasing length of stay, unplanned admissions, being discharged early due to critical care bed shortage (baseline – ready to be discharged) and discharged in the evening in hours and out of hours (baseline – afternoon in hours).
Conclusion Determining the factors associated with mortality allows patients at highest risk of death to be identified. Based on this analysis, evening discharges from critical care should be avoided.
Abstract no. 530 The exploratory research of brain stem blood flow in traumatic brain injury: a challenge for clinical data science
Gleb Danilov, Natalya Zakharova, Alexander Potapov, Igor Pronin, Eugenia Alexandrova, and Andrey Oshorov, Burdenko Neurosurgery Institute, Moscow
Introduction Since the introduction of perfusion computerized tomography (PCT) into clinical practice, it was rarely used for brain stem blood flow evaluation in traumatic brain injury (TBI). The aim of this study was to assess a complex relationship between brain stem blood flow and pathophysiological/clinical manifestations of TBI using data scientist’s toolbox.
Methods To explore the patterns of brain stem blood flow (BBF) in TBI under diverse pathophysiological conditions disparate data from electronic health records, CT-scanner, monitoring devices and other sources were acquired, structured, linked and analysed. Brain stem perfusion was measured at the level of midbrain in the standardized regions of interest. In a period between 2005 and 2014 we collected data on 81 patients with acute TBI, which reflected the structural and functional changes in brain, its blood flow and clinical manifestations, as well as the state of cerebral perfusion regulation. We used exploratory, cluster and time series analysis with pattern recognition techniques. All the data processing and statistical calculations were made with the R programming language and environment (www.r-project.org).
Results The majority of studied patients were severely injured (81.5%) in road-traffic accidents (65%). The average values of BBF were 27-29 ml/100g/min, ranging significantly and increasingly in severely injured patients. The average level of brain stem blood flow was lower compared to hemispheric (26-28 ml/100 g/min, p < 0.05). The lowest BBF values were found inside the haemorrhagic lesions (4.0 ml/100 g/min). Oppositely, we explored that the high BBF (up to 76 ml/100 g/min) was related to cerebral circulation autoregulation failure (p <0.05), which, in turn, was accompanied by intracranial hypertension. Multivariate time series classification was used to distinguish the patterns of intracranial pressure (ICP) leading to autoregulation disturbance. The key factor for disregulation was ICP > 15 mmHg which appeared to be lower than the accepted ICP threshold of 25 mmHg for surgical interventions.
Discussion The study combined a prospective data collection, ad hoc analysis, observational component. The exploratory data analysis followed by conventional hypothesis testing enabled to explain the lowest BBF values by brain stem damage and the extremely high BBF levels by autoregulation failure. The time series classification was implemented for specific ICP patterns recognition. In fact, the linear relation between neurological, magnetic resonance, pathophysiological signs and BBF was rarely observed in our study. One and the same blood flow level was accompanied by diverse neurological and pathophysiological manifestations, and vice versa. We found that brainstem blood flow parameters may deteriorate much earlier than the signs of axial dislocation and secondary brain stem damage appear. That’s why that parameters could be considered as additional criterion to support the decision of decompressive surgery.
Conclusion Data science offers unrivalled opportunities for clinical research changing the future of evidence based medicine. In addition to randomized controlled trials data science enables sophisticated basic research of brain pathophysiology. In this study a diverse and clinically unpredictable brain stem blood flow was explored and simply explained by basic contributors using a complex data analysis.
Abstract no. 532 Design of a BPM model for Crohn´s clinical process
Alberto Antonio De Ramon Fernandez, University of Alicante, Murcia
Ruiz-Fernández, Virgilio Gilart, and Diego Marcos Jorquera, University of Alicante, San Vicente del Raspeig
Introduction Crohn´s disease belongs to the intestinal inflammatory diseases. It causes the inflammation of the intestinal tract and an important loss of quality of life for the patients. Its treatment generates a high cost for the national health care systems. This article pursues the integration of a Business Process Management (BPM) model to overcome the weaknesses detected in the current clinical process.
Methods A wide range of national and international clinical guidelines for the Crohn’s disease has been analysed to standardise them and detect weaknesses in the current process. This study was contrasted with staff of the area of health sciences of the University of Alicante. This work focuses on the implementation of improvements by BPM. Its agile and flexible use allows the process to be adapted to unexpected changes. The development proposed allows us to obtain a global model that integrates all processes involved in the treatment of the disease. It also includes the phase of psychological support to the patient.
Results As a result, a model based on the standard BPMN is proposed. Moreover, the main weaknesses of the current process are detected: 1) Lack of standardised clinical guidelines 2) Faecal calprotectin test carries out only in the final step of the diagnostic phase 3) Lack of psychological support during the process 4) Large number of visits to the primary care centres 5) Lack of clear and updated information throughout the clinical process 6) High cost associated with the process 7) Large number of compatible symptoms with other diseases 8) Weak implementation of IT´s in clinical processes 9) There are no clinical Decision Support System (DSS) 10) Lack of empowerment of patient.
Discussion The novelty of this work is the design of a standardised model for the clinical process of the Crohn´s disease applying BPM. It allows us to manage more efficiently the process. So far, BPM is mainly used to improve health administrative processes.
Conclusion BPM applied to clinical processes involves a new management paradigm in managing chronic diseases, providing efficiency and patient satisfaction. Thus, a dynamic model adapted to the needs of the patient is achieved. It improves the empowerment of the patient and overcomes the deficiencies in the current clinical process.
Abstract no. 534 Towards a medical informatics curricula visualization and analysis tool
Tom Broens, Floris Wiesman and Monique Jaspers, Academic Medical Center / University of Amsterdam, Amsterdam
Introduction Educational programs (curricula) are subject to change. Quality control, new didactical methods and upcoming research fields stimulate educators to change the content of their curricula and their education methods on a regular basis. This is also the case for the medical informatics bachelor and master programs at the Academic Medical Center Amsterdam, currently serving around 250 students and 100 involved lecturers. To execute a comprehensive program, all stakeholders require a clear view of the programs’ exit qualifications, the courses’ learning outcomes, the position and relation of courses to the program, and links between the courses in terms of topics covered. Without tooling, grasping a program’s contents and keeping it consistent, considering its evolution, is challenging. This abstract discusses ongoing work on the development of an ICT tool to visualize and analyze curricula to facilitate their consistent management.
Methods A literature study was performed to identify similar tools and develop an information model that provides the foundation for the tool. A prototype was developed and filled with information of the two Amsterdam programs. The prototype was used to gain insight in user experiences and formulate future improvements.
Results All information and visualization presented in the tool is generated from structured data in the underlying curricula database. The tool provides an overview of the courses, credit size, learning tracks, learning goals and references to IMIA topics. This way of handling information enables different views on a curriculum that can also be used for analytics. For example, a view of a learning track, that has different activities in different courses, can be shown comprehensively and chronologically. It indicates where different activities take place and what learning objectives are served. This enables educators to verify and maintain this track. Another example, analytics can be performed on the recorded references to IMIA topics. A heatmap is created to reveal focus areas in a program. A final example, the tool can visualize the relation between program’s exit qualifications and individual course objectives, including if required skill levels are met.
Discussion The usage of the tool stimulated discussion amongst educators. For example, different overlapping topics where identified and a more consistent program could be realized. Also terminology proved to be ambiguously interpreted amongst educators in the program. The tool enabled the identification of these differences in understanding and foster discussions using real examples. Additionally, the tool provided analytics to uncover deeper characteristics of a program. A future version of the tool will allow educators to change and add information by themselves. This makes curricula design a shared responsibility. The tool will stimulate collaboration between educators who can be supported in developing courses in a structured way using pre-defined protocols and auditing processes. Also secondary education information will be (partially) generated, for example assessment plans, and completed by users with less overhead compared to a non-automated process.
Conclusion The curricula visualization and analysis tool provides a way to consistently monitor and maintain an education program. It stimulates shared responsibility, discussion and provides opportunity for lessening administrative burden.
Abstract no. 539 XML representation of WHO international classification of health interventions (ICHI)
Sukil Kim, Catholic University of Korea, Seoul
Jae Jin Lee, WHO Collaborating Center for International Classifications and Terminology, Seoul
Jean Marie Rodrigues, The Catholic University of Korea, Seoul
Beatrice Trombert, Université Jean Monnet Saint-Etienne, Paris
Huib Ten Napel, INSERM U1142 LIMICS, Paris
Since 2006, the WHO-FIC network has been developing an International Classification for Health Intervention (ICHI) based on an ontology framework defined in ENISO 1828 named Categorical Structure, with 3 axes and 7 characters. It was planned that ICHI should encompass the granularity of the ICD 9CM Volume 3. After several tests with the ICHI alpha 2 (May 2016) version, we analysed from bottom up 574 ICHI alpha 2 codes by modelling them in XML, and show that the existing coding structure does not allow a semantic representation necessary to ensure interoperability with other existing coding system for medical and surgical interventions. We have thus developed a more refined version of ICHI using XML model: using as the root element, which is a set of elements in the XML schema, we have included 3 attributes, code, interventionType, and title, to each element. Within an element there are 7 further elements: title, comment, linkedClassification, content, composition, inclusion, and exclusion. The element is composed of three axes (Target, Action and Means), and an axes can hold more than one object type. The element allows distinction of procedures that contain multiple interventions. Our XML model of ICHI will be able to cover the problems of granularity of the previous model.
Abstract no. 542 Real time capture of routine clinical data in the hospital electronic health record using a purpose built power-form
Neil Bodagh, Queen Mary University, London
Andrew Archbold and Roshan Weerackody, Bart’s Heart Centre, London
Mike Barnes, William Harvey Research Institute, Queen Mary University, London
John Robson, Clinical Excellence Group, Queen Mary University, London
Adam Timmis, Farr Institute of Health Informatics Research and Bart’s Heart Centre, London
Introduction The electronic health record (EHR) is the major repository of clinical data in the NHS. It is a huge potential resource but remains severely under-utilised to the point that very little of the UK’s research output is based on routinely collected clinical data. The reasons are complex but ultimately reflect the fact that these data are rarely entered into the hospital EHR in a form that allows for their organized storage and digital download.
Methods We have developed a SNOMED-based electronic power-form comprising a user-friendly interface for real-time entry of clinical data into the EHR during cardiac outpatient consultation. Our aim was to capture outpatient clinical data in a form that allows for automatic development of summary patient reports and for batch download of de-identified data for audit and research.
Results During the first 4 months after installation of the power-form, consultant utilisation averaged 60% for the 327 new patients seen during that period. Presenting symptoms, examination findings, investigations, diagnosis, initial treatment and disposal (>120 fields) were entered in real time during consultation and a structured summary report was developed. This was made available for electronic transfer directly into the patient’s EMIS file in the primary care record, permitting same-day delivery of the report and obviating the need for a dictated clinic letter. Batched download of the digital data was successful, with sample analytic findings as follows:
Patient ethnicity: S Asian 44%, white 34%, black 15%
Presenting symptom: chest pain 41%, dyspnoea 11%, palpitations 10%, dizzy attacks/syncope 8%, hypertension 7%
Diagnosis: non-cardiac chest pain 24%, angina 11%, coronary disease 7%
Disposal: discharged to GP 74%, follow-up appointment 11%, cath lab waiting list 6%, referral to specialist clinic 9%
A total of 58 GPs and 37 patients have been surveyed on the utility of the report. Satisfaction has been reported with same day delivery of the summary report, its layout and the adequacy of the information provided for patients’ understanding of their condition and GPs’ clinical needs. Using a 5 point Likert scale (1=much less useful – 5=much more useful) both GPs (average Likert score 4.32) and patients (average Likert score 4.62) find the outpatient report to be more useful than the conventional dictated clinic letter.
Conclusion This is the first report of power-form development for entry of routinely collected cardiac outpatient data into the hospital EHR. The data are stored in a form that permits: (1) automatic generation of a summary report for same-day delivery into the primary care record and (2) batch download of de-identified digital data for audit. Integration of the system with programmes of generic patient consent will open-up the hospital EHR to real-world clinical research.
Abstract no. 543 Regional administrative health databases in italy: a census and practical remarks
Rosaria Gesuita and Edlira Skrami, Marche Polytechnic University, Ancona
Vincenzo Guardabasso, University Hospital ‘Policlinico Vittorio Emanuele’, Catania
Simona Villani and Paola Borrelli, University of Pavia, Pavia
Antonella Zambon, University of Milano-Bicocca, Milan
Paolo Trerotoli, University of Bari ‘Aldo Moro’, Bari
Working Group ‘Observational Studies’, SISMEC - Italian Society for Medical Statistics and Clinical Epidemiology, Pavia
Introduction Administrative Health Databases (AHD) have been widely used in Italy, some dating back two decades or more. Epidemiological observations from AHD data can be useful to stakeholders to support health policies and services. AHD scope and availability for epidemiological studies in Italy are not well known or documented. A Research project from the SISMEC Working Group on Observational Studies was funded by the Italian Ministry of Health and the Puglia Region, to perform a census of Electronic ADH in Italy (‘Electronic health databases as a source of reliable information for effective health policy”, Project RF-2010-2315604). The project aimed at evaluating methodological issues related to the use of AHD for epidemiology, and focused on the public regional health administrations.
Methods A census was completed in 2016 after sending questionnaires to the various regional administration contact persons for AHD, that receive mandatory data from hospitals and local health units. In 2 out of 21 information on AHD was directly gathered from institutional web sites. Several features were collected for AHD, including type, time span, population coverage, missing data and quality, IT system, unique linkage key and anonymization. A web site was created to make this information publicly available (http://www.sismec.info/arches).
Results The survey found 349 AHD, pertaining to 29 types, from 21 Regional Health Administrations. The results documented for the first time their detailed features, and specifically those concerning linkage keys and privacy protection. The number of AHD per region varied between 6 and 39 the most represented types were home and residential care data over 65% of AHD report protection of anonymity. Linkage key were available in 67% of AHD, and were based on local regional procedures. The survey confirmed that AHD in Italy are fragmented at the regional level. The different regional jurisdictions of local government manage the regional data on independent IT systems, because of implementation of IT after the approval of Constitutional laws in 2001 devolving health legislation to regional governments, resulting in a fragmented national context. Although many of those AHD are then merged by the Ministry of Health, the opportunities for nation-wide observational studies on secondary administrative health data collected in AHD are unclear, and any independent study proposal would run into several barriers, due to privacy regulations, confusing process of approval, and heterogeneity of AHD. At present any data-linkage procedure across regions incurs in the barrier of different pseudo-anonymous identification codes being used in different regions.
Conclusions Several problems affect the feasibility of nation-wide observational studies on secondary data from the wealth of AHD in Italy. This is especially true for epidemiology researchers, interested in research rather than in organisational analyses. However, independent research can provide the Italian Health System with new, fresh insights that could expand the borders of health systems routine monitoring. Problems of privacy protection, heterogeneity and fragmentation could be addressed at a national level, taking advantage of experience from other countries. Presently in Italy patients flow freely across health services, information about their care does not.
Abstract no. 554 Establishing safe and efficient “read-through” indexes for Scottish informatics and linkage collaboration
David Clark and Gerald Donnelly, National Records of Scotland, Edinburgh
Albert King, Scottish Government Education Analytical Services, Edinburgh
Introduction National Records of Scotland (NRS) provide the Trusted Third Party (TTP) Indexing Service on behalf of the Scottish Informatics and Linkage Collaboration, encompassing data linkage projects supported by Farr Institute Scotland, Administrative Data Research Centre – Scotland, Urban Big Data Centre and the Scottish Government. The role of NRS is to match the personal identifiers submitted by data controllers to the national research spine and generate study and datasetspecific index numbers. These indexes are used to link pseudo-anonymised records accessed by approved researchers in a safe haven. To avoid both retaining linked research datasets, and repeatedly sharing personal identifying information from datasets required in multiple projects, NRS are developing a series of “read-through” index keys, which can be re-used and facilitate safer and more efficient data linkage.
Methods NRS are in the process of agreeing a series of memorandums of understanding (MoU) with various Data Controllers of administrative datasets in order to establish safer and more efficient linkages of datasets. Under each MoU, the data controller asks NRS to process their dataset by linking it to the national research spine and creating anonymised “read-through” index keys which the Data Controller will hold at the person-level on their own dataset. NRS will maintain a look-up of the “readthrough” against the spine. This means for approved research studies involving their already indexed data, the Data Controller just needs to send the read-through keys (without any other personal identifying information) for the people comprising the study cohort, to the indexing team to generate study-specific keys in the usual manner. It can also allow the data provider to receive the “read-through” keys and study-specific index numbers from the TTP, when the research cohort originates from a dataset held by a different data controller.
Results So far MoU’s have been agreed with NHS Scotland for national health data , for primary care data from consenting General Practices, Scottish Government Education Analytical Services for school pupil census and Communities Analysis for housing data, University of Edinburgh for Scottish Mental Surveys, and NRS for Census and Vital Events data.
Discussion We anticipate that the creation of read-through indexes will deliver the following benefits without the need to increase personal data held by the TTP Indexing Service or Data Controllers, and in a way which preserves Data Controllers direct control over the use of the data they hold:
Reduced privacy risks as individual identifiers required for indexing would be shared once rather than on a project-by-project basis
Increased use of administrative data for research with benefits to public policy and academic research outputs that inform practice in health, education, and other fields
Reduced burden on data controllers as identifiers would need to be extracted only once
Improved efficiency of linkage as the indexing team would need to carry out indexing only once
Conclusion Utilising read-through keys considerably cuts down the amount of personal data which regularly have to be transferred to NRS, and then matched using probabilistic methods to the spine on a project-by-project basis.
Abstract no. 557 A intelligence application of health information monitoring and telehealthcare for surgical operations on elderly patients
Jin-Ming Wu and Te-Wei Ho, Department of Surgery, National Taiwan University Hospital and National Taiwan University College of Medicine, Taipei
Yao-Ting Chang, Chung-Chieh Hsu, and Feipei Lai, Department of Computer Science and Information Engineering, National Taiwan University, Taipei
Introduction To provide the safety and high quality health care and to provide the telehealthcare for elderly people by information and communication technology, we proposed a knowledge-based telehealthcare smartphone application (APP) with the artificial intelligence mechanism in intelligent disease management. The aim of this APP was to enhance the early recovery of elderly patients who received surgery.
Methods This study investigated a smartphone application developed to serve the functions of drainage follow-up, nutritional monitoring, symptom management, activity management, and wound care. To provide real-time remote care, we also designed a platform for the patients and medical staff to permit reviews of the records.
Results We have implemented a smartphone application for both Android and iOS versions. The APP could automatic provide a summary of the patient’s health status based on the measurement records. According to the previous preliminary results, twenty patients at the National Taiwan University Hospital received perioperative care via this APP as the telehealth group. During the study period, we retrospectively collected an additional 20 demographically matched cases as a control group. The telehealth group had a lower body weight loss percentage relative to the control group during a 6-month follow-up period (4.8 ± 1.2% vs. 8.7 ± 2.4% p <0.01).
Discussion Although the telehealth group had a lower body weight loss percentage, they had more outpatient clinic visits than did those in the control group (9.8 ± 0.9 vs. 5.6 ± 0.8 p <0.01). In the future, we will conduct a further study for the clinical effectiveness and cost-effectiveness of elderly patients who received surgery.
Conclusion This study supported the feasibility of a smartphone application for the perioperative care of patients to promote a lower body weight loss and the collection of comprehensive surgical records. With the advanced functions of this APP, we expect to acquire further clinical evidence to encourage and add further support to implementation of telehealth as part of surgery care, especially in elderly patients.
Abstract no. 562 Nurses’ needs on the adoption of hospital IoT-based service
Seung Jin Kang, Hyun Young Baek Eun Ja Jung, Hee Hwang and Sooyoung Yoo, Seoul National University Bundang Hospital, Seongnam-si
Introduction Internet of things (IoT) technologies, which combine a variety of sensors, devices, and networks, within hospitals are expected to increase the quality of patient care, reduce medical costs, enhance job efficiency of the healthcare staff including nurses, and improve hospital environments. Despite the presence of such needs in healthcare, only a small number of studies have investigated which services are in high needs. The present study aims at identifying the needs in healthcare by performing a survey of needs for IoT services within hospitals on nurses working in tertiary hospitals.
Methods Voluntary, paper-based, self-report questionnaire survey was conducted on all nurses working at single tertiary hospital from July 5, 2016 to August 9, 2016. A multidisciplinary team was arranged to extract 15 IoT hospital service items divided into three categories of patient safety, work efficiency, and hospital environment.
Patient safety: Fall management, Pressure ulcer management
Work efficiency: Smart infusion pump, Continuous vital sign monitoring system, Smart patient transfer, Hand disinfection, Rehabilitation management, Vital sign device interface system, Medicine administration monitoring, Patient tracking, Medical staff tracking
Hospital environment: working environment monitoring, device/equipment monitoring, real-time asset tracking, smart lighting system
Needs were measured on a 7-point Likert scale. Extra opinions were allowed to obtain other than 15 IoT service items. In addition, Needs for each item were compared by dividing the nurses into ward nurses and non-ward nurses as well as into nurses with fewer than 5 years of experience and those with more than five years of experience. Significance of intergroup differences was verified using T-tests.
Results Of 1,204 eligible participants, 1,086 participated in the survey (90.2%). There was a high need for all of the service items overall, with at least 5 out of 7 points for each of them. Particularly, vital sign device interface system had the highest demand (mean 6.2, SD 0.93), followed by continuous vital sign monitoring system (mean 6.0, SD 5.8). In terms of wards and non-ward departments, nurses in wards showed high needs for IoT services related to patient care while those in non-ward departments showed high needs for IoT services related to work efficiency. Further, needs for all IoT services increased with increasing career experience.
Discussion This study found that needs for IoT are high overall in healthcare. Despite the limitations of generalizing the study results due to the fact that the survey was only conducted on nurses in a single university hospital, this study is meaningful in that it shed light on the future needs for IoT services within hospitals based on deep understanding and broad experience on ICT technology by conducting a comprehensive needs survey on hospital nurses familiar with digital technology.
Conclusion This study identified needs for IoT services and positive attitudes toward novel technology among nurses working in hospitals. We expect the findings of this study to provide valuable insight for hospitals domestic and abroad for the application of IoT services.
Abstract no. 563 Predicting asthma at age 8: the application of machine learning methods
Silvia Colicino, Cosetta Minelli, and Paul Cullinan, National Heart and Lung Institute, Imperial College, London, London
Alex Lewin, Brunel University London, London
Steve Turner, University of Aberdeen, Aberdeen
Adnan Custovic, Imperial College London, London
Introduction Asthma is among the most common chronic conditions in childhood. We aimed to develop and validate robust statistical models to predict asthma at 8 years of age using three Machine Learning methods.
Methods The data come from 3 UK cohorts in the STELAR consortium. We studied 1,145 children from Ashford and Aberdeen and externally validated the predictive models using data on 348 children from Manchester. Information on characteristics of the children, family related factors and asthma-like symptoms were collected at recruitment and at 1 and 2 or 3 years of age. We defined asthma at age 8 by the presence of at least two of the following: (1) current wheeze (2) asthma treatment (3) a doctor’s diagnosis of asthma the prevalence was 65 (12%), 87 (11%) and 49 (14%) in Ashford, Aberdeen and Manchester, respectively. We developed predictive models using penalized regression methods (LASSO and Elastic Net, EN) and an empirical Bayes regularization method. These models simultaneously perform coefficient estimation and variable selection. The amount of shrinkage towards zero of the regression coefficients is controlled by hyperparameters that were chosen based on 10 fold cross-validation. We used a Normal-Gamma hierarchical prior distribution for the empirical Bayes binomial model in order to account for highly correlated variables. We externally validated these models and assessed their predictive performance by discrimination and calibration measures.
Results The LASSO, EN and empirical Bayes regression models selected 20, 23 and 19 predictors, respectively, from the initial 61. History of parental allergies and doctor’s diagnosis of eczema, the absence of a dog in the house, and antibiotic use at the age of 2 years were found to be important predictors of asthma at 8 years in all predictive models. Other predictors selected include paternal smoking, wheezing symptoms, hospital admissions and birth order. Overall, predictive models showed good accuracy (0.67, 0.64 and 0.69 for LASSO, EN and empirical Bayes, respectively). Sensitivity, specificity and negative predictive value were high (0.84, 0.65 and 0.98 for LASSO, 0.90, 0.59 and 0.96 for the EN and 0.82, 0.67 and 0.97 for empirical Bayes, respectively), whilst positive predictive values (0.28, 0.27 and 0.29 for three methods respectively) were generally low. All 3 methods reported an area under the ROC curve of 80%, showing good predictive performance and favourable discriminative ability to distinguish subjects with and without the disease.
Discussion After validation, our predictive models demonstrated good discrimination ability for asthma. Overall, the empirical Bayes method selects the most parsimonious model and provides better accuracy and predictive ability, at the expense of a lower sensitivity, compared to the other two methods. On the other hand, LASSO and EN provide very similar results with a higher accuracy in the first approach.
Conclusion This multicentre study of asthma-like symptoms in children, combined with novel statistical methods, demonstrates promising results in predicting asthma. The predictive performance in terms of positive predictive value may be further improved with the use of additional predictors and a more targeted population.
Abstract no. 567 Feasibility of electronic quality indicators for inpatient falls based on data from ENRs
Insook Cho, Inha Univerity, Incheon
Eun-Hee Boo, National Health Insurance Service Ilsan Hospital, Gyeonggi-do
Yeun-Hee Kim, Asan Medical Center, Seoul
Soo-Yeun Lee, Inha University Hospital, Incheon
Introduction Most electronic health record (EHR) systems containing electronic nursing records (ENRs) are not based on standards that facilitate semantic interoperability. We hypothesized that reorganizing nursing data into a standard format would allow the sharing and comparison of nursing data across settings. We tested the eMeasure process of the National Quality Forum using nursing data obtained in specific ENR environments, and validated the results based on manually abstracted existing reports. Inpatient fall prevention was selected as a nursing-sensitive quality measure.
Methods This study was conducted in several steps: (1) establishing a project team, (2) developing a data dictionary by reviewing eight international and national practice guidelines, (3) identifying evidence-based data elements and an indicator map, (4) mapping the local terms to concepts in reference terminologies, and (5) representing indicators and validating the process by comparing those obtained by manual abstracting. We used the current definitions of quality indicators for inpatient falls and standard nursing terminologies (the 2015 releases of the Logical Observation Identifiers Names and Codes [LOINC] and the International Classification for Nursing Practice [ICNP®]). The nursing data of 7,829 and 8,199 patients from 2 Korean hospitals with different ENRs were used to represent indicators and validate the process.
Results The identified data dictionary contained 45 data elements that were categorized into 53 concepts. These concepts were mapped onto LOINC and ICNP with coverages of 75.5% and 54.7%, respectively. The indicator map derived from a review of 10 practice guidelines identified 11 process indicators (e.g., the percentage of patients assessed for fall risk within 24 hours of hospital admission, and the percentage of patient days at risk of falling) as well as two outcome indicators (fall incidence and the percentage of falls with injury). These outcome and process indicators could be successfully represented using data from the two ENR systems, but the process indicators were not available for the manual abstractions.
Discussion In this study we were able to quantitatively represent quality indicator matrix in a form that was comparable with that used in other hospitals. The process indicators were not measureable for the manual abstractions. For the hospital that did not have an explicit policy and governance for data structures, this post-implementation solution showed several limits in mapping and reorganizing of data, which were labor-intensive and troublesome. This finding was typically observed when we determine whether the data elements in the data dictionary can be extracted from the two ENR systems. We could find significant differences depending on whether the data element was captured from a structured format or a semi-structured format. Considering the concept mapping with standard terminologies, there were significant gaps. An unexpected finding was a new detection of fall events, not reported to internal reporting system, through the data analysis on narrative nursing notes from the both of hospitals.
Conclusion Reorganizing nursing data from specific ENR environments into a standard format allowed quantitative representations of inpatient falls successfully. This implies that nursing-sensitive outcome measures can be shared and compared throught the utilization of clinical nursing data from multiple ENRs.
Abstract no. 571 Demonstrating the feasibility of using electronic health records in genome-wide association studies: a case study in the UK biobank
Ghazaleh Fatemifar, Michail Katsoulis, Riyaz Patel, Harry Hemingway, and Spiros Denaxas, Farr Institute of Health Informatics Research, Institute of Health Informatics, University College London, London
Introduction Genome-wide Association Studies (GWAS) use cases and controls from investigator-led studies, with cases often defined using manually curated medical record data. Along with the decreasing cost of genotyping, there is increasing demand for larger sample sizes to detect smaller effects. Large scale bio-banking efforts have established cohorts with >100K participants. To define cases in these cohorts it is no longer feasible to use manual approaches, and self-reported data is limited by its lack of accuracy and phenotypic resolution. To overcome these challenges, structured health data through electronic health records (EHR) is increasingly being made available. In this study, we sought to explore the performance of an EHR-derived phenotype of myocardial infarction (MI) for a GWAS in a national biobank, with a view of comparing our findings to published studies using conventional case ascertainment.
Methods The UK Biobank is a cohort with 500K middle-aged participants recruited from England, Scotland and Wales. Genotyping was performed using two Affymetrix Axiom arrays. We applied a previously validated MI phenotype algorithm (https://www.ucl.ac.uk/health-informatics/caliber) using secondary care diagnostic codes from hospitalisation (Hospital Episode Statistics) and mortality (Office of National Statistics) for UK Biobank participants, in a sub-cohort of 112,142 participants who were genotyped as of June 2015, to define participants with prevalent or incident MI (cases) and those without MI (controls). We used logistic regression to test the association between 10 million imputed genetic variants (expected allelic dosages) and MI whilst controlling for the effects of sex, batch, array and centre as well as principle components 1-15. In order to test the validity of our results we extracted all known genome-wide signals for MI and systematically compared these with our results.
Results Within the sample studied, we identified 3,408 MI cases (mean age 62, male 78%) and 108,734 controls (mean age 57, male 47%) derived from EHR. Baseline characteristics for MI cases were similar to those reported in published MI GWAS studies (62% smokers, 60% using statins). QQ-plots showed little inflation of the test statistic (lambda EHR=1.02). After adjustment for covariates we identified 69 variants in two chromosomal regions showing genome-wide significance (<5x10⁻⁸). The most robust association was for rs944797 on chromosome 9 (Risk Allele: C OR: 1.16 P: 1.4x10⁻¹¹) which was a comparable estimate to that identified previously.
Discussion Using EHR to define cases of MI, we were able to replicate several previously reported genome-wide associations, which had used conventional case ascertainment. EHR derived MI cases also had characteristics consistent with those that were expected in traditional cohort studies. We did not identify all known associations but this is likely due to statistical power. Whether an EHR-derived approach for case ascertainment out-performs, a self-reported approach remains to be tested.
Conclusion EHR-derived phenotypes offer a viable alternative to manual phenotyping at a lower cost and at higher clinical resolution and can accelerate advances in precision medicine though large-scale GWAS.
Abstract no. 573 Flipped versus traditional classroom in a small-scale programming course
Floris Wiesman, Tom Broens, and Monique Jaspers, Academic Medical Center, University of Amsterdam, Amsterdam
Introduction The flipped classroom, which involves moving content delivery out of the classroom and spending more time on reflection, can bring about significantly better learning outcomes than the traditional educational model. Large classes in particular seem to benefit. Sceptical lecturers however state that small classes by their nature are already interactive and offer a form of active learning. Moreover, students complain that they pay tuition to hear lectures, not to do homework as in the flipped classroom model. We investigated how a small-scale course can benefit from the flipped classroom model such that the students are satisfied with this new learning model.
Methods The course was an introduction to programming in Java in a bachelor programme of Medical Informatics. We performed a crossover study where the first 7 weeks followed the flipped classroom model and the next 6 weeks the traditional model. The flipped model involved each week (a) 2-4 video lectures (each including 1-3 formative quiz questions) to be watched at home, with an average total length per week of 25 minutes. (b) 90 minutes of “lecture” consisting of 5 formative quiz questions answered with mobile phones. Based on the results the lecturer provided explanations. This took 15-20 minutes. The remaining time was used to do exercises on paper or laptop, with the lecturer and a teaching assistant. (c) 120 minutes of computer lab supervised by teaching assistants. In the traditional approach there were no video lectures. Each “lecture” consisted of 50 minutes of traditional face-to-face lecturing (with students interrupting to ask questions) plus 40 minutes of exercises, which were as in the flipped model but interleaved with the lecture. Computer lab work was unchanged. A paper questionnaire was issued directly following the exam.
Results Of the 50 students who started the course 10 dropped out during the second part of the course. Among the remaining 40 who took the exam, the response rate of the questionnaire was 80%. The reported attendance of the lectures increased from 79% for the flipped model to 85% for the traditional model. The median number of video lectures watched was 24 out of 26. 91% of the students stated they were better prepared for the exercises by the video lectures than traditional lectures. Given the choice between video lectures only, flipped, and traditional model, 81% preferred the flipped approach. In the remarks, 21% stated that the possibility to watch video lectures multiple times and to pause them was valuable.
Discussion Content becomes progressively more difficult during the course, which is a more plausible explanation for the dropouts than the change from flipped to traditional model. Moreover the increasing difficulty may have negatively affected students’ attitude towards the traditional model.
Conclusion Without changing the number of contact hours, we introduced a flipped classroom that was favourably received by the vast majority of the students. Attendance was only slightly lower for the flipped classroom.
Abstract no. 584 Does pay-for-performance improve mental health related patient outcomes? The association between quality of primary care and suicides in England
Christos Grigoroglou and Evangelos Kontopantelis, NIHR School for Primary Care Research, Centre for Primary Care, Division of Population Health, Health Services Research and Primary Care, University of Manchester
Evangelos Kontopantelis, Centre for Health Informatics, Division of Informatics, Imaging and Data Sciences, University of Manchester
Luke Munford, Centre for Health Economics, Division of Population Health, Health Services Research and Primary Care, University of Manchester
Roger T. Webb and Nav Kapur, Centre for Mental Health and Safety, Institute of Brain, Behaviour and Mental Health, University of Manchester
Tim Doran, Department of Health Sciences, University of York
Darren M. Ashcroft, Centre for Pharmacoepidemiology and Drug Safety, School of Health Sciences, Faculty of Biology, Medicine and Health, University of Manchester, Manchester Academic Health Sciences Centre (MAHSC) and NIHR Greater Manchester Patient Safety Translational Research Centre, Manchester Academic Health Sciences Centre (MAHSC)
Introduction The Quality and Outcomes Framework (QOF), one of the largest Pay-for-Performance (P4P) schemes of its kind, was introduced in 2004, to improve quality of Primary Care in the UK. In this study, we assessed and quantified the relationship between general practice performance on the mental health domain indicators of the QOF and suicide mortality in England for the period 2006-2014.
Methods We obtained practice-level information covering over 99 percent of the registered general practice population and attributed to Lower Super Output Areas (LSOA) in England. Negative binomial models were fit to investigate the relationship between spatially estimated recorded quality of care and suicides. In order to measure quality of care we aggregated all indicators from the two mental health domains of the QOF, i.e. depression and serious mental illness (SMI), into a composite score. Analyses were adjusted for deprivation, social fragmentation, prevalence of depression and serious mental illness, as well as census variables.
Results Overall, no significant relationship was found between practice performance on the mental health indicators of the QOF and suicides in the practice locality (1.00 95% CI [0.99 to 1.00]). Suicides were associated with greater area social fragmentation (1.053 95% CI [1.047 to 1.059]), greater area deprivation (1.015 95% CI [1.014 to 1.016]), increased prevalence of depression (1.012 95% CI [1.003 to 1.021]) and rural location (1.048 95% CI [1.017 to 1.080]). Men aged 40 to 44 had the highest risk of suicide (1.854 95%CI [1.774 to 1.959]).
Conclusions For those practices that participate in the scheme, higher reported achievement of mental health specific activities incentivised in the QOF was not associated with significant changes in suicides. These findings suggest implications for the effects of other similar programmes on suicide prevention.
Abstract no. 586 The quantified outpatient - challenges and opportunities in 24hr patient monitoring
David Infante Sanchez, University of Birmingham, Birmingham
Sandra Woolley, Keele University, Newcastle-under-Lyme
Tim Collins, Manchester Metropolitan University, Manchester
Philip Pemberton, Tonny Veenith, David Hume, Katherine Laver, and Charlotte Small, University Hospitals Birmingham, Birmingham
Introduction Patient monitoring systems capable of accurate recording in the real-world, during the activities of everyday living, can provide rich objective accounts of patient well-being that have broad application in clinical decision support. Combining physiological, environmental and actigraphy sensing together with a quantified subjective patient report and activity log, provides new opportunities and new challenges in big data analysis, data mining and visual analytics.
Method An iterative prototyping approach together with clinical collaboration informed the design and development of a novel 24hr sensing system with broad application relevant to sleep assessment. The system design, sensor selection and visual analytic strategies were informed by literature review and pilot studies with i) clinical staff and ii) healthy participants.
The sensing system comprised, i) a daytime wearable sensing unit (on-body accelerometry for Metabolic Equivalent Task, pulse, skin temperature and resistivity) and ii) two night-time sensing units (an on-body unit as per daytime but with wrist accelerometry, and a bedside unit for ambient light, temperature and sound-level). Continuous recordings were used to generate averages, minima and maxima in 1-minute, 15-minute, 1-hour and 4-hour intervals. For data mining and visual analytics, these records were combined with quantified accounts of subjective user reports and activity logs. Ten subjects (including three clinicians) tested the system for up to three consecutive days and nights and provided assessments of use and comfortability. Five clinicians were interviewed regarding system applications, barriers to use, data use and visual analytics.
Results Data acquisition was successful across a wide range of MET levels. System comfortability was good but with some discomfort and skin irritation arising from prolonged use of a carotid pulse sensor (selected for its robust performance compared with wristband alternatives). Electrooculography sensing for REM sleep detection was attempted but was uncomfortable and performance was unsatisfactory. Usability of the system benefitted from prolonged battery operation. Few data losses resulted from user-administration of sensors, but more resulted from a lack of prototype ruggedisation. Attempts at intuitive multivariate data visualizations, including heat maps, motion charts and clustered views, had limited success. However, the system and approach was assessed as very good for real-life application and decision support.
Discussion 24hr outpatient sensing has wide clinical application in rehabilitation, in the management of chronic conditions and, in pre- and post-surgical assessment. However, better detection of both low level activity and sleep is required than currently available in commercial activity monitoring devices.
Conclusion Multi-modal outpatient monitoring can perform robustly and with acceptable comfortability across a spectrum of activity types and levels, however, system robustness and ease-of-use are paramount to reliability, and users’ self-application of sensors requires careful attention.
The new big un-delineated, multi-modal, multi-dimensional, data spaces created are unfamiliar, uncharted territories that require new understandings, guidance and training. Data mining and visual analytics provide new research insights but there are many challenges regarding their translation in clinical practice.
Abstract no. 594 A tool to improve the efficiency and reproducibility of research using electronic health record databases
Mohammad Al Sallakh and Gwyneth Davies, Swansea University Medical School, Swansea
Sarah Rodgers, Farr Institute, CIPHER, Swansea
Ronan Lyons, Farr Institute, CIPHER, Swansea
Aziz Sheikh, Usher Institute of Population Health Sciences and Informatics, University of Edinburgh, Edinburgh
Introduction Interrogation of routine electronic health record (EHR) databases often involves repetitive programming tasks, such as manually constructing and modifying complex database queries, requiring significant time from an experienced data analyst. The objective was to develop a tool to automate the selection and characterisation of cohorts from primary care databases to be used by data analysts and researchers.
Methods We identified a set of common elementary approaches to query clinical variables from the primary care database of the Secure Anonymised Information Linkage databank. We then designed an easy-to-use web-based user interface to allow using combinations of these approaches as ‘building blocks’ for querying more complex variables. We created an R programme to automatically generate and execute the corresponding Structured Query Language (SQL) queries.
Results The developed prototype allows researchers to query clinical information from primary care databases based on the following elementary variable types: (1) count of events of interest (e.g. asthma prescriptions) or their distinct dates (2) the code or date of the earliest or latest event of interest (e.g. type of the earliest smoking cessation prescription) (3) the code or date of the event of maximum or minimum value (e.g. maximum BMI recording ever) and (4) count of events of interest having complex temporal constraints with other events (e.g., count of asthma doctor visits with oral steroid prescriptions within one week). Researchers may choose fixed, dynamic, or individualised query intervals. Algorithms are saved on a web server as versioned and sharable objects. The prototype integrates with a Read Codes dictionary and a sharable codeset repository allowing researchers to keep a record of codes used for reporting transparency.
Discussion The developed prototype provides a scalable, versatile solution for the implementation of complex cohort selection and characterisation algorithms using primary care databases. The automatic generation of SQL queries reduces human errors and should enable rapid and scalable implementation of these algorithms, which has the potential to improve research efficiency and reproducibility. In addition, the graphical user interface allows researchers with no programming skills to interrogate the data. The tool is under active development to improve the functionality and usability, and we look forward to testing it in other databases and assessing its suitability in different research contexts. We plan to make this tool available under an open source licence.
Abstract no. 595 The Manitoba meta-data mapping project
Lisa Lix, University of Manitoba, Winnipeg
Wattamon Srisakuldee, George and Fay Yee Centre for Healthcare Innovation, Winnipeg
Introduction New healthcare treatments such as prescription drugs and surgical procedures are often tested in randomized clinical trials (RCTs) or evaluated in cohort studies. RCTs, in particular, can give an accurate picture of the benefits and harms of new treatments in the short term. But many treatments continue to be used for decades, meaning that RCTs or cross-sectional cohort studies do not provide a full picture of their long-term effects. In the past it was common for data to be archived when a study was finished. There is a worldwide movement to make data available for reuse in order to check the accuracy of original findings, look for new benefits and harms, and measure long-term benefits and harms. The latter can be done by linking the original participant information with data from large administrative databases. Canadian provinces provide universal health care that generates extensive records, which can be linked to the information collected in existing RCTs and cohort studies. The objective of this study is to: (a) describe the process to develop a repository in the province of Manitoba, Canada containing descriptive information (i.e., meta-data) about trials and cohort studies conducted in the last ten years, and (b) identify barriers and enablers of data reuse studies.
Methods Study participants are principal investigators who have conducted a RCT or cohort study that meets the following criteria: (a) the study captures information about one or more of the following health domains: health status, factors that influence health status, health care, public health, and health–related interventions, (b) the study collects data on Manitoba residents, and (c) the health data must come from studies completed between January 1, 2007 and December 31, 2016. Principal investigators were identified via contacts with research offices at all provincial universities and clinical research departments at hospitals, health regions, and related provincial and regional organizations. The collected meta-data includes characteristics of the patients/cohort participants (i.e., age group, sex, disease characteristics), characteristics of the study measures, data custodian/trustee, and willingness of the principal investigator to initiate data sharing agreements and/or participate in data linkage projects. Meta-data are collected using an on-line tool developed with REDCap software.
Results To date, we have identified more than 80 principal investigators who have been contacted to provide meta-data. Data collection is in process. The collected data will be used to establish a publicly-accessible online meta-data repository.
Discussion This study will help to identify the characteristics of study data that could be reused in new investigations, as well as potential methodological, logistical and ethical challenges associated with data reuse. The study results will be used to develop focus groups with members of research ethics boards and research review committees to identify issues associated with investigator requests to reactivate trials and extend cohort studies via record linkage. The study is currently being replicated at two sites in the province of Ontario, Canada to assess the feasibility of implementing it on a national basis.
Conclusion The results from this study will be used to propose best practices for data reuse focusing on data linkage. Collectively, this study will help to impact the reuse of health data in Canada to improve patient care.
Abstract no. 596 Solution for work flow management of surgical operation
Myon-Woong Park and Jae Kwan Kim, Korea Institute of Science and Technology, Seoul
Soo Hong Lee, Yonsei University, Seoul
Introduction In order to enhance the safety and efficiency of surgery, systematic information service to support various stakeholders is necessary. A smart system supposed to comprehend whole procedure of the operation and be able to provide with intelligent service such as proactive data mining and generation of warning at appropriate timing is being developed for the support.
Methods Workflow is a formalized model of a certain operational process. Through the model, the system understands the whole process in advance, reckons current progress according to the contextual information, and provides necessary service in timely manner. IDEF0 was used for the representation of the functions and relations in the model. Information, data, knowledge, context and instances pertinent to the surgical operations have been analyzed and formalized. Through the function deployment, necessary functionalities for the intended software system have been defined.
Results The resulted software named SWORM (Surgical WORkflow Manager) consists of five modules, namely, DB management module, Adaptation module, Surgery Planning Module, Surgery Recording Module, and Visualization module. The mobile application supporting relevant personnel in moving also has been constructed in a hybrid app development environment. This app is written with web technologies and currently runs on Android. At the server side, the SWORM uses HTTP and MySQL. Based on SWORM which is a kind of middle ware, pre-operative, intra-operative, and post-operative services are to be implemented. SWORM can be integrated with legacy systems including EMR or HIS and make itself a platform for applications.
Discussion The system has been applied to the preparation stage of Maxillofacial surgery for trial use, and evaluated by its developers and users. Feedback from a surgeon is the usefulness of setting up and continuous refining of personalized pre and intra operative process. The anaesthesiologist has expected merits in the perspective of safety as operations would possibly be more systematically monitored.
Conclusion SWORM is continuously improved reflecting the feedback from surgical participants, and service modules based on SWORM platform are being added. The objective of workflow management is to maximize the usability of human and material resources and to prevent the medical accident during the entire stages of surgery from pre to post operation. Ultimate goal of the research is the implementation of intelligent agents to support various medical staff.
Abstract no. 600 Patient flow networks and emergency department performance
Daniel Bean and Richard Dobson, Department of Biostatistics and Health Informatics, Institute of Psychiatry Psychology and Neuroscience, King’s College London, London
Clive Stringer, Farr Institute of Health Informatics Research, Institute of Health Informatics, University College London, London
James Teo, King’s College NHS Foundation Trust, London
Introduction Accident and Emergency department (A&E) performance against the UK’s 4-hour waiting time target is a key metric used to assess hospitals. The flow of patients through the hospital as a whole has been identified as a factor affecting A&E performance. A hospital can be considered as a network of wards that are connected when patients are transferred between them. This network science approach enables a global perspective of the complex dynamic flow of patients through a hospital.
Methods Data on A&E attendances, waiting times and patient transfers between 01/12/2014 and 01/07/2016 were extracted from the electronic medical record at King’s College Hospital NHS Foundation Trust. Only transfers for admitted non-elective patients at both hospital sites (Kings College Hospital Denmark Hill, DH, and Princess Royal University Hospital, PRUH) were included. Patient transfers were modelled as a weighted directed graph in which nodes represent wards and edges represent transfers of patients between wards. Edge weights represent the proportion of all transfers in any given day that each edge accounted for. Discharge from the hospital is represented by an edge to a virtual exit node.
Results Overall, the PRUH network consists of 72 nodes (wards) and 921 edges, and the DH network contains 78 nodes and 1531 edges. We identified a “core” set of these edges that are present in the network every month. This core set is a small proportion of all edges (21% for PRUH, 14% for DH), but accounts for the majority of all transfers (91% for PRUH, 85% for DH) and is likely to be critical to the flow of patients through the hospital network. If network-level changes affect A&E performance, the properties of the transfer network on any given day should predict performance the following day. Unsupervised clustering (PCA) of daily transfer networks separated the highest-performing 10% of days from the lowest-performing 10% in both sites. There is also a clear separation of the transfer networks on weekends vs. weekdays for both sites. For DH, the edges that contribute most to the separation of the best and worst days form clear pathways from admission to discharge with consistently higher or lower flow, whereas in PRUH the differences in flow tend to affect more individual wards.
Discussion Since the best and worst performing days can be separated using the properties of the ward network on the preceding day, the network-level changes associated with poor A&E performance could be a driver of performance. This is consistent with the previous suggestion that the occupancy of wards downstream of A&E is a key determinant of A&E performance rather than A&E attendance rates. Analysis of paths through the network shows that a small subset of edges accounts for the majority of patient flow. These pathways could be key targets for efforts to improve efficiency, particularly in times of crisis.
Conclusion Patient transfers within a hospital can be naturally described
Abstract no. 603 Development and validation of various phenotyping algorithms for diabetes mellitus using data from electronic health records
Santiago Esteban, Manuel Rodriguez Tablado, Francisco Peper, Yamila Mahumud, Ricardo Ricci, Sergio Terrasa, and Karin Kopitowski, Servicio de Medicina Familiar y Comunitaria, Hospital Italiano de Buenos Aires, Buenos Aires
Introduction Recently, the progression towards precision medicine has sought the development of large databases allowing to assess the impact of risk factors or treatments in specific subpopulations. This is usually a problem for classical cohorts, given the difficulty of enrolment and follow-up of a large enough number of patients. Even more so is the situation in developing countries, given the usual lack of funds for local research. Electronic health records (EHR) have been proposed as a solution to these two costs problems. Nevertheless, this comes at a price. The quality of data in EHR is usually less than optimal, particularly regarding misclassification errors. Phenotyping algorithms allow, through the combination of different variables extracted from the EHR, to classify patients according to their particular phenotype. Our objective is to compare the performance of different classification strategies (only using standardized problems, rules based algorithms, statistical learning algorithms (six learners) and stacked generalization (five versions)), for the categorization of patients according to their diabetic status (diabetics, not diabetics and inconclusive Diabetes of any type) using information extracted from EHR.
Methods Patient information was extracted from the EHR of the Hospital Italiano in Buenos Aires, Argentina. In order to have a training and a validation dataset, two samples of patients from different years (2005-2015 total n = 2463) were extracted. The only inclusion criterion was age (≥40 <80 years old by 1/1/2005 and by 1/1/2015 for each sample). The sampling was carried out using simple randomization. The training set (2005) featured 1663 patients. The validation set (2015) represented the ∼ 33% of the total sample (n = 800). Four researchers manually reviewed all records and classified patients according to their diabetic status (diabetic: diabetes registered as a health problem or fulfilling the ADA criteria non-diabetic: not fulfilling the ADA criteria and having at least one fasting glucose below 126 mg/dL inconclusive: no data regarding their diabetic status or only one abnormal value). The best performing algorithms within each strategy were tested on the validation set.
Results The standardized codes algorithm achieved a Kappa coefficient value of 0.59 (95% CI 0.49, 0.59) in the validation set. The Boolean logic algorithm reached 0.83 (95% CI 0.78, 0.89). A slightly higher value was achieved by the Feedforward Neural Network (0.9, 95% CI 0.85, 0.94). The best performing learner was the stacked generalization meta-learner that reached a Kappa coefficient value of 0.95 (95% CI 0.91, 0.98).
Conclusion We evaluated the performance of four different strategies for the development of diabetes phenotyping algorithms using data extracted from an EHR from Argentina. The stacked generalization strategy showed the best metrics of classification in the validation set. The implementation of these algorithms enables the exploitation of the data of thousands of patients accurately and reducing costs compared to the traditional way of collecting data for research. Thus, millions of patients from developing countries could benefit from local and specific data that could lead to treatments that take into account all their characteristics (genetic, environmental, habits, etc.) as it is the objective of precision medicine.
Abstract no. 604 Sensitivity and specificity of a rule-based phenotyping algorithm for automatic cardiovascular disease case detection using electronic medical records
Santiago Esteban, Manuel Rodriguez Tablado, and Ricardo Ricci, Hospital Italiano de Buenos Aires, Buenos Aires
Sergio Terrasa and Karin Kopitowski, Servicio de Medicina Familiar y Comunitaria, Hospital Italiano de Buenos Aires, Buenos Aires
Introduction Electronic medical records (EMR) are becoming increasingly common. They show a lot of promise in terms of data collection to facilitate observational epidemiological studies and their use for this purpose has increased significantly over the recent years. Even though the quantity and availability of the data are clearly improved thanks to EMRs, still, the problem of the quality of the data remains. This is especially important when attempting to determine if an event has actually occurred or not. We sought to assess the sensitivity, specificity, and agreement level of a codes-based algorithm for the detection of clinically relevant cardiovascular (CaVD) and cerebrovascular (CeVD) disease cases, using data from EMRs.
Methods Three family physicians from the research group selected clinically relevant CaVD and CeVD terms from the international classification of primary care, Second Edition (ICPC-2), the ICD 10 version 2015 and SNOMED-CT 2015 Edition. Clinically significant signs, symptoms, diagnoses and procedures associated with CaVD and CeVD were included. The algorithm yielded a positive result if the patient had at least one of the selected terms in their medical records, as long as it was not recorded as an error. Else, if no terms were found, the patient was classified as negative. This algorithm was applied to a randomly selected sample of the active patients within the hospital’s HMO by 1/1/2005 that were 40 to 79 years old, had at least one year of seniority in the HMO and at least one clinical encounter. Thus, patients were classified into four groups: (1) Negative patients (2) Patients with CaVD but without CeVD (3) Patients with CeVD but without disease CaVD (4) Patients with both diseases. To facilitate the validation process, a stratified sample was taken so that each of the groups represented approximately 25% of the sample.
Manual chart review was used as the gold standard for assessing the algorithm’s performance. One-third of the patients were assigned randomly to each reviewer (Cohen’s kappa 0.91). Both coded and un-coded (free text) sections of the EMR were reviewed. This was done from the first present clinical note in the patients chart to the last one registered prior to 1/1/2005.
Results The performance of the algorithm was compared against manual chart review. It yielded high sensitivity (0.99, 95% CI 0.938 – 0.9971) and acceptable specificity (0.86, 95% CI 0.818 – 0.895) for detecting cases of CaVD and CeVD combined. A qualitative analysis showed that most of the false negatives were due to terms not included in the algorith (20.4% of the total errors). False positives corresponded mostly to diagnoses that were later on dismissed (43.8%) and due to incidental findings that had no clinical significance (13.27%).
Conclusions We developed a simple algorithm, using only standardized and non-standardized coded terms within an EMR that can properly detect clinically relevant events and symptoms of CaVD and CeVD. We believe that combining it with an analysis of the free text using an NLP approach would yield even better results.
Abstract no. 610 Data quality issues with using the MIMIC-III dataset for process mining in healthcare
Angelina Prima Kurniati, School of Computing, University of Leeds, Leeds & School of Computing, Telkom University, Bandung, Indonesia
Owen Johnson and David Hogg, School of Computing, University of Leeds, Leeds
Geoff Hall, School of Medicine, University of Leeds & Leeds Institute of Cancer and Pathology, St James’s University Hospital, Leeds
Introduction Process mining is a process analytics approach for discovering and analysing process models based on the real activities captured in the event logs of information systems and there is a growing body of literature on process mining in healthcare. One initial challenge for process miners is access to a fine-grained dataset with suitable information for process mining and this is a particularly difficult problem in healthcare given the sensitive nature of health records. Publicly available datasets are one option. MIMIC-III is an open access de-identified health record dataset from the USA with a large number (n=46,520) of patient records. There are more than 120 publications using the MIMIC dataset in journals or conferences, but none of them have used process mining for process analysis. This research aims to assess the opportunities and data quality issues using the MIMIC-III dataset for healthcare process mining.
Method The study applies an established framework for e-health record data assessment using five dimensions (completeness, correctness, concordance, plausibility, and currency) and seven methods. Five of the seven data quality assessment dimensions were applied. These were data element agreement between records of every single activity in different tables, element presence for process mining attributes (case ID, activity name, and timestamp), distribution comparison to the data descriptor, validity check through database queries, and data source agreement of two hospital data sources of MIMIC-III. Log review and gold standards were not applicable because of the de-identified nature of the data.
Results There are 11 events tables in MIMIC-III meeting the minimum requirements for process mining, resulting in a large number of transactional records (n=324,481,146). There are also five dictionary tables, eight definition tables, and two mapping tables that support analysis. Interim results suggest that the data quality of MIMIC-III is strong for the 11 tables, where process mining can be used. We identified several issues with completeness due to missing data elements. Missing timestamps were evident in three tables: CPT EVENTS (82.28% of records), MICROBIOLOGY EVENTS (7.52%), and NOTE EVENTS (15.01%). The latter two tables can be modified for process mining using a transformation for datestamp replacement, but CPT EVENTS which contains Current Procedural Terminology does not contain other information that can be used to impute the frequently missing timestamps. Analysis of CPT events can be supported by information from other tables, such as ADMISSIONS and ICUSTAYS. The poster will present detailed results including graphs and tables of the issues identified.
Discussion MIMIC-III is available to e-health researchers developing novel methods. Data quality is generally high. One important challenge is that the de-identification process included shifting all dates consistently for each patient to randomly distributed future dates. This means that analysis related to a specific timeframe (e.g. weekend vs weekday, daily workload analysis) cannot be done.
Conclusion MIMIC-III dataset can be used for process mining research in healthcare because it is freely accessible, contains detailed information about patient care and supports reproducible research. Some data quality problems were identified but many can be solved using pre-processing techniques.
Abstract no. 611 Making the complex data model of a clinical research platform accessible for teaching
Christoph Rinner, Georg Duftschmid, and Walter Gall, Center for Medical Statistics, Informatics and Intelligent Systems, Medical University of Vienna, Vienna
Thomas Wrba, IT Systems & Communications, Medical University of Vienna, Vienna
Introduction For the last 19 years the Medical University of Vienna has been offering a clinical research platform (RDA)1 to securely document and analyze patient-based clinical research data. Besides its clinical foundation, the RDA is also relevant in the medical informatics curriculum at the Medical University of Vienna as it has been the reference point of numerous prototypes developed during master and PhD theses. However, in order to develop or test new features, in-depth knowledge and hands-on experience with the data model are needed and various security, licensing, and organizational barriers have to be passed. To lower the entry barrier for students working with the complex RDA data model, we aimed to set up a locally deployable development environment to evaluate the feasibility and practicability of new features in the RDA data model.
Methods The RDA allows the generic creation of forms and corresponding documents belonging to a specific patient based on the Entity-Attribute-Value (EAV) design.2 We implemented a local development environment with open source software. The data model still holds the central EAV components but was substantially simplified to focus on only those aspects that are most relevant in the teaching context.
Results Only 6 of the original over 150 tables of the RDA data model were reused. User registration, security features, project administration, etc. were not taken into consideration. To process forms, patients, and documents, SQL (PostgreSQL and MySQL), a simple REST interface and the developed web interface are made available by means of the PHP Framework Laravel. The database was preloaded with sample data no patient data from the RDA are used. We evaluate a SMART on FHIR interface using this local development environment.
Discussion Being able to directly access the data model in a locally deployed environment drastically lowers the barrier for testing RDA-related features developed by students. Due to the high quality standards needed in the RDA, new features resulting from student work are always re-implemented by staff of the RDA, hence the disadvantage of not reusing code directly for the RDA is negligible.
Conclusion We reduced a complex data model for clinical research data to the key aspects needed for teaching and provide a locally deployable environment. The entry barrier for students to develop prototypes or test new features based on the data model of the clinical research platform at the Medical University of Vienna is lowered and the transfer of innovative concepts developed by our students to the platform is facilitated.
References
Dorda W, Wrba T, et al. ArchiMed - A Medical Information- and Retrieval System. Methods Inf Med. 199938(1):16-24.
Friedman C, Hripcsak G, et al. A generalized relational schema for an integrated clinical patient database. Proc Annu Symp Comput Appl Med Care Washington, DC: IEEE Computer Society Press 1990. p. 335-9.
Abstract no. 613 Developing a standardized minimum dataset for mitochondrial research data – a project outline
Sabrina Barbara Neururer, Department of Medical Statistics, Informatics and Health Economics, Medical University of Innsbruck, Innsbruck
Erich Gnaiger, Department of Visceral, Transplant and Thoracic Surgery, D. Swarovski Research Laboratory, Medical University of Innsbruck, Innsbruck
Verena Laner and Georg Goebel, Oroboros Instruments, Innsbruck
Introduction Mitochondrial research strongly relies on quality control for monitoring and comparing mitochondrial data between individuals and populations. This abstract presents the methodological outline of a novel project aimed at developing a concept for a minimum dataset in order to describe and exchange mitochondrial data between research groups.
Methods The development is based on the MIABIS (Minimum Information About BIobank data Sharing)1 standard which was developed for sharing meta data referring to biobanks and biomaterial collections. Now we intend to evaluate, which basic data is needed to describe mitochondrial meta information and if MIABIS can be applied for this purpose.
Results The project consists of five steps and modifies and extends the 4-step approach for formalizing free-text information published by Neururer et al.2 to fit our research goal: In Step 1 an analysis is carried out for relevant mitochondrial free-text information (e.g. Bioblast,3 MitoPedia).4 Therefore, a so-called definition analysis approach2 is used. Relevant information is marked and definitions are extracted. These definitions serve as input for Step 2, which consist of a typological analysis.2 To identify the relevant data fields of the minimal mitochondrial dataset, the definitions are coded and iteratively abstracted by using qualitative content analysis methods. These data fields are mapped to the concepts offered by MIABIS in Step 3. This step shows, to which extent the MIABIS standard can be extended for this project. The initial concept for a novel mitochondrial data model is developed in Step 4. In order to validate the model, an expert-based evaluation is the main objective of Step 5. This may trigger an iterative process, which will lead to a refinement and re-evaluation of the mitochondrial data model.
Discussion The minimal mitochondrial dataset will serve as a basis for harmonizing mitochondrial information and will increase interoperability of mitochondrial research data. With the development of such a minimal dataset, we contribute to a structured representation of mitochondrial data which leads to enhanced comparability and facilitates data exchange. The strongly structured analysis approach will allow generating reproducible results. Nevertheless it remains to be shown to which extent the MIABIS standard can be applied for creating a mitochondrial data model.
Conclusion The project combines different approaches from interdisciplinary fields of research (e.g. computer science, social sciences) and contributes to the current state of the art of mitochondrial knowledge management to enhance mitochondrial research networking.
References
L. Norlin, M. N. Fransson, M. Eriksson, R. Merino-Martinez, M. Anderberg, S. Kurtovic, and J.-E. Litton, “A Minimum DataSet for Sharing Biobank Samples, Information, and Data: MIABIS,” Biopreserv. Biobank., vol. 10, no. 4, pp. 343–348, Aug. 2012.
S. B. Neururer, N. Lasierra, K. P. Peiffer, and D. Fensel, “Formalizing the Austrian Procedure Catalogue: A 4-step methodological analysis approach,” J. Biomed. Inform., vol. 60, pp. 1–13, 2016.
“Bioblast - Bioblast.” [Online]. Available: http://www.bioblast.at/index.php/Bioblast.
“MitoPedia - Bioblast.” [Online]. Available: http://www.bioblast.at/index.php/MitoPedia.
Abstract no. 615 Tech-no or tech-yes? Insights from older adults on digital monitoring for physical and cognitive health.
Gemma Stringer, Francine Jury, Ellen Poliakoff, Iracema Leroi, and Samuel Couth, The University of Manchester, Manchester
Angela Branson, Clinical Research Network: Greater Manchester, Manchester
Introduction Recent figures from the Office for National Statistics suggest that dementia and Alzheimer’s disease were the leading cause of death in 2015. Early diagnosis of neurodegenerative diseases significantly improves long-term health outcomes, thus one of the key challenges is to improve disease detection at the earliest stage possible. A second challenge is to closely monitor disease progression and fluctuations to enable the most effective therapeutic interventions. Wearable devices, apps and software offer a solution to these problems by unobtrusively collecting individualised data pertaining to physical, cognitive and functional wellbeing over time. What is not clearly understood, however, is whether older adults (either with or without a diagnosis of some form of dementia) are ready, willing and/or able to use these technologies. To address this issue, we report on qualitative data collected from three different projects which ultimately aimed to evaluate the feasibility of using technology for disease detection and monitoring.
Methods The CYGNUS project aimed to use mobile devices and wearable technology to collect outcome measures for people referred to memory assessment services. A technology questionnaire was used to determine readiness for invite into the mobile device monitoring study (n=160). The SAMS project aimed to detect subtle changes in the patterns of daily computer use as a proxy indicator of early cognitive decline. A debrief questionnaire was used to understand their acceptability and preferences of the monitoring software (n=33).
The SKIP project aimed to monitor fluctuations in Parkinson’s disease symptoms through laptop based tasks and passively through smartphone sensor data. Two focus groups were conducted to discuss the use of technology for disease monitoring (n=6).
Results Initial findings from the CYGNUS technology questionnaire suggest that there was large variability between participant’s ownership of/access to smartphones, tablets and/or computers, and also variability in how often they used these devices. In terms of monitoring for disease detection, the questionnaire from the SAMS study indicated that in general participants (all of whom were regular computer users) did not find the software to be obtrusive and many “forgot” that they were being monitored. In terms of monitoring disease progression, the participants from both the SAMS and the SKIP project agreed that they would like to receive feedback on their symptom fluctuations, but there were mixed views on who should control the data and how often feedback should be received.
Discussion Collectively across the three projects there were consistent themes into the acceptability of technological solutions, with most participants willing to be monitored. Many older adults do not own or have access to such technologies, and those who do may not use these frequently enough to capture symptom onset or progression. Control over access to data, privacy and security are also factors to consider.
Conclusions The design and implementation of health monitoring devices needs to consider the requirements and preferences of the individual to ensure adherence and accurate data capture.
Abstract no. 617 Linguistic phenotypes and early cognitive impairment: complementary diagnostic tools with potential for dementia diagnosis
Kristina Lundholm Fors, Department of Swedish, University of Gothenburg, Sweden, Gothenburg
Dimitrios Kokkinakis, University of Gothenburg, Göteborg
Introduction Memory loss and language difficulties are typical symptoms of neurodegenerative diseases including Alzheimer’s disease and other forms of dementia. Recent studies have shown that signs of language deterioration are early and can be identified using linguistic analysis. A cognitive examination is a prerequisite for early identification of dementia and deeper linguistic analysis can play an important role in diagnosis and follow-up. This paper presents the initial stages of a study aiming to identify, extract, analyze, correlate and evaluate linguistic phenotypes from retrospective data. The study is part of the Centre for Ageing and Health (AgeCap, ) where research related to ageing is conducted.
Methods We use data from a longitudinal multidisciplinary population study of women in Gothenburg, Sweden. This study includes epidemiological, clinical and biological data related to psychiatric and somatic disorders in a representative sample of women. 100 women in the study participated in ‘psychiatric interviews”, conducted by Dr Tore Hällström between 1968 and 1969. This data has now been digitized and is being transcribed. Some of these women developed dementia several years later, and since it is known that the degradation of linguistic abilities is a gradual and incremental process that can last for years, we want to investigate whether language characteristics can differentiate the participants in the very early stages of the disease. We will perform automatic analyses of the data, including the extraction of different variables in order to build, test and evaluate classifiers to identify possible indicators for early detection of mild forms of cognitive impairment. Variables will be extracted from the speech signal (e.g. pause lengths use of slow speech,), its transcription (e.g. parts of speech distribution usage of filled pauses such as “um” and “hmm”) and from conversation analysis (e.g. turn taking topic transitions).
Results This study aims to produce knowledge about the subtle linguistic nature of early dementia and how it can be recognized in spontaneous speech interaction. We will adapt and develop language technology methods to analyze recordings and try to identify characteristics that could be used to distinguish people with early, mild cognitive symptoms from normal ageing.
Discussion Instruments that examine the linguistic production are necessary in order to determine incipient language or cognitive abnormalities that precede various dementias and also differentiate from benign, usually age-related cognitive impairment. In our project we will automatically identify and extract a large number of measurable linguistic features and correlate those with medical follow-up data from the investigations that followed.
Conclusion Our study will produce complementary knowledge about the subtle language changes and the nature of early linguistic phenotypes in a large and homogeneous population. The results can be of importance for health professionals who want to quickly diagnose and identify individuals with various forms of cognitive impairment long before serious symptoms become apparent. This way, new and improved cognitive screening tests can be developed that could be used on a large scale in primary care.
Abstract no. 621 Process analysis in cardiovascular disease using process mining
Guntur Prabawa Kusuma, School of Computing, University of Leeds & Telkom University, Bandung, Indonesia
Owen Johnson and Brandon Bennett, School of Computing, University of Leeds, Leeds
Introduction Cardiovascular Disease (CVD) is one of the main causes of premature death and opportunities to improve care include earlier diagnosis, lifestyle changes and clinical interventions. This research aims to identify actual clinical pathway experiences for CVD patients from e-health records in clinical information systems and to use these to link to outcomes. Care processes can be highly dynamic, complex, ad hoc and multi-disciplinary and, as such, represent a challenge for process analysis. One approach is to apply Process Mining methods to discover processes from event logs and this been used successfully in health care. The ability to use Process Mining tools to identify the actual clinical pathways of CVD patients and outcomes will be explored using hospital data from MIMIC-III, an anonymised e-health database from the USA.
Method Data for patients with a range of CVD conditions was extracted from the full MIMIC-III dataset and prepared for Process Mining. Two tools were used to construct process models – the open source tool ProM and a commercial tool Disco. Initial process discovery used the heuristic and alpha algorithms in ProM. Machine learning approaches will be used in the next stage of this work to classify pathways based on patient characteristics and compared to best practice.
Results MIMIC-III has records for a large number of patients (n=46,520) and by following the CVD codes from International Classification of Diseases 9th revision (ICD-9), we identified 72.13% of patients with CVD (n=33,362) accounting for 43,540 episodes of care with unplanned (emergency and urgent) care episodes representing 82.36% (n=35,860) episodes, elective episodes 15.49% (n=6,745) and new born episodes 2.15% (n=935). For the CVD patients there were 543,757 different kinds of diagnoses with the most frequent diagnosis being ‘hypertension’ (n=20,703), followed by ‘congestive heart failure’ (n=13,111). The mean stay in hospital for CVD patients was 7.3 days with the longest stay being 322 days and the shortest being 35 minutes. There were seven cases of patients with more than two years in length of stay which appear to be data entry errors. Analysis of the pathways is ongoing and the poster will present interim results from the investigation.
Discussion This initial work suggests Process Mining can extract CVD care pathways from hospital data. Issues in data quality were revealed and are being investigated in a related project. This work is the beginning of a PhD research and the methods for process mining of CVD pathways developed will be extended to compare clinical practice and effectiveness in different health systems in UK, USA and Australia6.
Conclusion This research is at early stage but the Process Mining approach appears to be feasible and is already surfacing interest results. Further work will explore the opportunities for process mining CVD pathways from UK hospital and primary care data and develop methods for process mining linked to best practice and better clinical outcomes.
Abstract no. 622 Can primary care electronic health records facilitate the prediction of early cognitive decline associated with dementia? A systematic literature review
Maxine Mackintosh, Farr Institute of Health Informatics Research, University College London, London
Introduction Identifying the early stages of dementia is key in care management, clinical trial recruitment and mitigating the impact of cognitive impairment. At present, cognitive tests are most commonly used to investigate early stages of dementia and are often only conducted after initial symptoms of cognitive decline have been identified. There is potential to harness routinely collected data from electronic health records (EHR) to discover markers of early-stage dementia, both in its cognitive and non-cognitive manifestations. However, the extent to which primary care EHR can facilitate earlier diagnosis of dementia has not systematically been examined. We aim to determine the extent to which EHR can be utilized to identify prodromal dementia in primary care settings through a systematic review of the literature.
Method We searched electronic medical databases (including Scopus, Web of Science, OvidSP, MEDLINE and PsychINFO) for potentially relevant studies up to and including September 2016 and written in English. We used the following MeSH search terms: “dementia” (including its subtypes), “electronic health records” (variations thereof) and “primary care”. Additionally, grey literature was searched including reports released by the government, councils and relevant major UK charities.
Results We identified and reviewed 31 studies. In total 35 risk factors and 147 potential markers of early cognitive decline were identified. There was considerable variability across studies as to whether markers were classed as confounders, risk factors, early markers or co-morbidities. Markers predominantly fell within cognitive, affective, motor and autonomic symptoms, prescription patterns of both dementia and non-dementia medication and health system utilization, including type of consultation, frequency of contact and duration. Three studies investigated variation in the markers’ predictive strengths at different time points during the prodromal period of dementia. In the 24 months prior to diagnosis of dementia, gait disturbances, changes in weight, number of consultations, specialty referrals and hospital admissions showed the strongest strength of association with dementia diagnosis. Number of consultations, unpredictability in consulting patterns, such as “Did not attend”, carer and social care involvement showed the strongest strength of association with dementia diagnosis during a longer prodromal period (up to 54 months).
Discussion Tests which specifically investigate cognitive health, such as the Mini Mental State Exam (MMSE) exam, are often only conducted in the period of Mild Cognitive Impairment (MCI) preceding dementia diagnosis, once irremediable damage has occurred. In many cases, these symptoms are conflated with normal ageing, affective disorders, or attenuated by multimorbidities, and are therefore not directly linked to dementia. These results show that there is a broad range of potential markers which could be used to better define prodromal dementia, however very little literature has been published in this area.
Conclusion There is significant potential to use routinely collected data from EHR to investigate and define prodromal dementia. The use of EHR allows us to obtain a more complete understanding of early-stage dementia according to its more commonly investigated cognitive signs, as well as non-cognitive presentations. Understanding the breadth and trajectories in prodromal dementia period will be key in facilitating earlier diagnosis.
Abstract no. 624 Mapping reporting checklist questions against biomedical literature
Haifa Alrdahi, University of Manchester, School of Computer Science, Manchester
Goran Nenadic and Uli Sattler, University of Manchester, Manchester
Andrew Brass, Division of Informatics, Imaging and Data Sciences, School of Health, University of Manchester, Manchester
Introduction Experimental meta-data reporting is a very important field for reproducing and understanding biomedical experiments and results. Diseases caused by parasites, such as Chagas disease, are causing millions of people serious morbidity that might affect their mortality. The genetic background of the host and the parasite used in the experiments, such as the sex of the host, affects the infection outcomes. Checklist Questions (CLQs) have been designed to capture the experimental metadata and evaluate the quality of reporting. Answering CLQs automatically is important for many reasons: CLQs allow to check completeness and clarity of experimental meta-data, and this can be used in the peer-review process. Answers to CLQs can be used to search the relevant literature for meta-data analysis process an efficient way. However, answering the questions automatically is challenging. For example, identifying one species as the answer from many mentions of species requires an automatic understanding of the context the species are mentioned in. The research objectives are to:
1 Explore which kind of CLQs can be answered automatically.
2 Combine Text Mining techniques (TM), Background Knowledge resources (BK) and the article structure to extract the answers.
Methods We used 83 scientific articles from parasitology literature to answer four CLQs automatically: 1- host’s name, 2- host’s gender 3- host’s strain, 4- parasite’s name. The article title, abstract and beginning of the method sections were used to search for the answers. We utilized the CLQs keywords to search the BK and used standard TM techniques while taking into account the structure of the article. Three Named Entity Recognition tools and two large databases were used to extract the answers. We calculated the co-occurrence of the host and its strain in the abstract and method sections to increase the answers confidence.
Results & Discussion
1 The current TM tools and BK resources are not sufficient alone to recognise the correct answers from the extracted entities. For instance, strains have complex nomenclature structure combining capital and small letter with numbers and punctuations. Some texts contain terms with structures similar to the strain, which decreased the accuracy of the extracted strains.
2 The host description (name, strain, gender) is usually found together in 1-4 sentences in the beginning of the method section.
3 Both (host and parasite) or one of them were reported in the abstract and title sections.
4 The host is linked to the parasite with a verb phrase “infected with” or similar in the method section.
Conclusions So far, we can use the frequency of the host and parasite entities in title, abstract and method sections to answer the CLQs reliably. A rule-based model is planned to find the answers using the co-occurrence, frequency rate of the entities and the entities position in the sentences. Moreover, we are interested in parsing the context surrounding the entities because it will help to find the relations between the entities.
Abstract no. 627 The case for a more efficient and effective EHR system: the Portuguese files
Bruno Miguel Oliveira, CINTESIS - Center for Health Technology and Services Research, Faculty of Medicine of the University of Porto, Porto
Rui Vasconcellos Guimarães, MEDCIDS - Community Medicine, Health Information and Decision Department, Faculty of Medicine of the University of Porto, Porto
Luís Filipe Coelho Antunes, FMUP - Faculty of Medicine of the University of Porto, Porto
Pedro Pereira Rodrigues, CRACS, INESC-TEC, Faculty of Sciences University of Porto, Porto
Introduction In medical environments, research and justice there is an anecdote that Electronic Health Records (EHR) are insecure, incomplete, and do not fulfil the needs of individuals and the society. As personal records, EHR are defined and protected by law, and thus we aim to confront the hands-on experience of the professionals with the law, evaluating if issues arise from an incorrect application of the law, or from the law itself.
Methods We conducted: i) a thorough reading of the laws that rule medical and public data, and external organisations that, by their nature, have to have or request access to health records ii) a number of interviews with experts in the medical, research and systems information fields regarding hands-on experience and iii) a nominal group technique (NGT) with forensic experts regarding their practical view on accessing EHR. On the interviews we used content analysis and extracted categories (issues) a posteriori. The categories and the outcomes of the NGT were then triangulated with the law.
Results The categories from the interviews are: no guidelines and protocols on data management lack of data semantics scattered information no defined security and anonymising protocols heavy bureaucracy on external data access and lack of definition on secondary and interchange usage of EHR. The main outcome from the NGT were: low efficiency and effectiveness heavy bureaucracy risks on data anonymity no real-time data access ambiguity on the legitimacy on data access slowness and no means to check if data is complete. The law is clear on who, how and why should access EHR. Defines, by decree, the information that must be registered in medical discharges. It does not define protocols for information storage nor interchange. It is vague on data reutilisation, interchange and anonymising, but defines the office of responsible for the access to information (RAI). Regarding forensic analysis, although clear, it is heavily bureaucratic, with an extensive chain of requests and long response times.
Discussion Many of the issues raised by both the interviewed and the experts on the NGT, security, anonymity, scattered information, slowness, data semantics, no real-time data access, and data completeness arise from the lack of definitions in the law. While the law states that access levels should be defined, in practice it provides no protocol, leaving this task to developers and RAI. This originates all or nothing scenarios, where professionals either have complete access or none. Furthermore, with no protocols each system is free to implement its own, making it difficult to query existing databases. Moreover, the vague definition on data anonymity renders the reutilisation of data unpractical, crippling research. As for data interchange, the law is clearly ineffective. The lack of definitions, coupled with heavy bureaucracy, can originate situations that injure the application of justice.
Conclusions From the analysis performed, we conclude that, although clear in many aspects, in practice the law is both vague and bureaucratic. We consider that the law should define protocols for data flow, interchange, audit and security, enabling EHR systems that serves best both the individual and the society.
Abstract no. 629 Promoting the reproducibility of team health science – distributed analytics under restrictive data policies
Athanasios Pavlopoulos, University of Manchester, Manchester
Introduction Data analysis platforms used for health informatics research, follow a centralised approach to data science. This is depicted as a pool of resources within a tightly regulated but research friendly environment. While this is a positive move for science, its benefits cannot be realised outside the boundaries of this ecosystem. As a result, valuable research resources are underused. Examples of research resources include people, data and methods. Typical implications of this situation include issues with reduced research reproducibility and output. A distributed approach to data science has the potential to offer a more efficient use of research assets geo-distributed around the globe and ease the challenges of research reproducibility and output. However, additional research is necessary to establish how a distributed research environment could potentially replicate and advance the centralised model. State of the art virtualisation technologies are being investigated for this purpose.
Discussion The first contribution of this research is a systematic literature review of data analysis platforms and virtualisation technologies. This highlights the advantages and the disadvantages of the centralised and the distributed approaches to data science, focusing on the various challenges to data analysis that could be eased by using virtualisation technologies. It will describe the challenges that will be tackled in this research and those that will be left for further work.
The second contribution is a model and a framework for the transition from a centralised approach to a distributed approach. It sets the centralised approach requirements and converts them for a distributed approach. This creates a platform that conforms with the regulations while it can use more resources and enable better research practices.
The third contribution is an evaluation method that measures the effectiveness of the solution. This is based on a scale of easing the barriers to data science and good research practices. It measures the effect of the solution in performing data science on geo-distributed resources and in allowing third parties to reproduce the research and increase the research output.
A case study research paradigm is followed throughout this research. First, an existing centralised approach to data science is studied. Second, proposals for distributed approaches to data science are investigated. Third, the findings from both approaches are merged together to convert an existing centralised approach to a distributed one. Fourth, the evaluation method is created and realised. Domain experts are used throughout the research to align the research findings with state of the art theories and practices.
Conclusions The examination of the case studies from both the centralised and the distributed approaches, highlight the importance of the problem and the soundness of the proposed solution. The model and the framework from the case studies will be realised, together with the evaluation method and its implementation.
Abstract no. 630 REACT (REal-time Analytics for Clinical Trials) supporting clinical trials at the Christie hospital through the iDECIDE framework.
Jennifer Bradford and Donal Landers, AstraZeneca, Macclesfield
Introduction REACT, developed by AstraZeneca, is revolutionising clinical data interpretation and visualisation in ongoing clinical studies. It provides experts with real-time access to integrated clinical trial data such as safety, exposure, efficacy and biomarkers. This enables more informed reasoning, informed decision making and an earlier understanding of the patient benefit-risk trajectory
Methods ‘iDecide’ is a five-year collaboration harnessing clinical informatics to deliver personalised healthcare for cancer patients. The collaboration is between AstraZeneca and the Manchester Cancer Research Center (Cancer Research UK, the University of Manchester and The Christie). As part of this REACT will be used to capture and integrate clinical trial data in real time to support complex clinical and scientific questions.
Results One example of how REACT can impact patients will be through helping to address the challenges in the BISCAY study. BISCAY is an Open-Label, Randomised, Multi-Drug, Biomarker-Directed, MultiCentre, Multiarm Phase 1b Study in patients with Muscle Invasive Bladder Cancer (MIBC) who have progressed on prior treatment (BISCAY). The objective of BISCAY is to explore predictive value of common molecular aberrations in MIBC and assign patients to a cohort with the best chance of benefit.
Discussion Within the BISCAY study REACT will be used firstly to help fully understand the toxicity of the immuno-therapy and target therapy combinations as there is little or no preclinical data available, moreover it will help identify the most efficacious combinations quickly.
The iDecide framework more generally will migrate, further develop and enhance the REACT platform that has been developed in AstraZeneca within Cancer Research UK. Within Cancer Research UK REACT will support oncology studies more widely and ultimately positively impact a greater number of patients.
Abstract no. 635 European comparison of spinal surgery hospitalizations from 2010 to 2013 according to patient profiles
Pascale Brasseur, Medtronic, Tolochenaz
Cecile Blein, Lucie Deleotoing, Camille Amaz, Charlene Tournier, and Alexandre Vainchtock, Heva, Lyon
Introduction This study was performed to compare hospitalizations for spinal surgery development across France, Spain, Germany and Belgium from 2010 to 2013 and to analyze patient’s characteristics.
Methods A retrospective analysis was conducted from hospital databases PMSI for France, CMBD for Spain, SHI for Germany and RHM for Belgium between 2010 and 2013. All spinal surgery hospitalizations were collected based on procedure codes according to the respective classification of each country (CCAM for France, ICD-9 for Spain and Belgium, and OPS for Germany). The mapping of ICD-9 and OPS codes was undertaken from the French procedures. Standardization of rates of spinal surgery patients were based on age from the EU population.
Results In 2013, crude rates of hospitalized patients with spinal surgery were 6.43 per 10,000 in Spain, 18.95 per 10,000 in France, 66.27 per 10,000 in Germany and 67,50 per 10,000 in Belgium. All countries experienced an increase of this number of patients from 2010 to 2013: +14% in Spain, +17% in France and +18% in Germany except for Belgium with a decrease of 13%. The gender distribution was similar between all countries except for Belgium, with slightly more women treated in Spain and Germany: 52% versus 50% in France. However, in Belgium the number of men treated is more important (64%). Mean age was lower in Spain (53 ± 16 years) France (54 ± 17 years) and Belgium (52 years) than in Germany (59 ± 15 years) the [70-80] year group was overrepresented in Germany (24% of patients versus 15% in France and Spain) to the detriment of the [30-40] year group (6% of patients in Germany versus 15% in France and Spain). The age standardized rates of spinal surgery patients were higher in Germany (60.55 per 10,000) and Belgium (67.36 per10,000) than in France (19.91 per 10,000) and Spain (6.53 per 10,000).
Conclusions Between 2010 and 2013, spinal surgery was marked by a progression of more than 14% in each country except for Belgium with a decrease of 13%. The standardized rate of spinal surgery patients varied significantly between the 4 countries, Germany and Belgium having the highest.
Abstract no. 636 Movefit: a healthy lifestyle application
Trond Tufte, University of Bergen, Department of Information Science and Media Studies, Bergen
Ankica Babic, Dept. for Information Science and Media Studies, University of Bergen, Bergen, Norway
Introduction According to World Health Organization the worldwide prevalence of obesity nearly doubled between 1980 and 2008, emphasizing its level of significance. Obesity is often resulting from a sedentary lifestyle, which is also often connected to chronic diseases such as cardiovascular diseases and diabetes, but also mental issues such depression and anxiety. The sedentary lifestyle and its down sides are being addressed by innovative use of mobile health (mHealth).
Methods During the current project a mHealth tool for smart phones has been developed using Design Science Methodology, where the goal has been to promote an active lifestyle. This has been done by implementing social and physical activity stimulating features. The physical activity features consists of e.g. an activity alarm that prompts the user to move whenever the user has been inactive for a certain amount of time. The user will be rewarded points by moving. Another set of features is the ability for a user to create activities or routes. The user will earn points based on the various activities created. These activities can be used and reviewed by others in the same area and is therefore location based. The points earned are being used as a competitive incentive. High activity leads to more points. The various users are being listed on a leader-board with their respective scores which is also based on location. There is also a leader-board for the various routes in the area. They are displayed based on their rating and distance away from the user. Furthermore, there are some social features that allows the users to find other people in the area, where the idea is that the users can physically meet up and do activities together. The users are able to communicate via messages in the app as well as creating their own social profile which is available to people in the nearby area. The application has been developed for Android devices by use of Xamarin, which is a cross platform development tool. The application’s back-end consists of Azure Cloud Services, where both SQL database and server is provided by the host. Evaluation. The application has been evaluated by regular and expert users in order to meet usability requirements. In addition a field expert and a focus group have contributed towards the application’s potential to increase physical activity.
Results There is enough data collected by the app to document its good effect it was possible to demonstrate that the app was capable of promoting physical activity. User testing has also shown the appreciation of the various features such as social networking, activity monitoring, and route/activity creation.
Discussion & Conclusion There are many ways this app can be further developed in order to tailor suit specific user needs e.g. patient activity tracking which can be used by mental therapists or physicians to help motivate the patients. Long term effect of the app has yet to be probed in a different setting e.g. a clinical trial.
Abstract no. 641 Radiology physician order entry system for improving quality of care at a tertiary teaching hospital
Mohammad Yusuf, Aga Khan University Hospital, Karachi
Introduction Aga Khan University Hospital is a JCIA accredited tertiary healthcare facility. To improve quality of care and to eliminate patient identification errors that may arise in the workflow when a physician writes and Imaging order and the patient is registered for the procedure, an Order Entry system was developed within the institution. The system is available to physicians who enter imaging orders. These then are managed within the Radiology department to register the patient and carry out the requested procedures.
Method Ordering radiology procedures for the specific patient needs to be carefully monitored and tracked. For a nonintegrated, paper based system, the chances of errors in listing the incorrect patient identifier on the request slip increases manifold. The electronic POE system now ensures that the intended patient is selected from the system and the radiology procedures intended for that specific patient are requested. As most radiology procedures involve ionizing radiation, a procedure carried out on an incorrectly identified patient will result in unnecessary radiation exposure. Completely avoiding such mis-identified patients and ensuring patient safety by preventing incorrect exposure to radiation etc. increases patient safety. The system was developed and integrated with the Hospital Information System (HIS) and the Radiology Information System (RIS). It was deployed in a phased manner within the Inpatient areas and then in the Emergency Department.
Results The project ensures that correct patients are identified and intended procedures are requested for them. Carrying out correct procedures on the right patient eliminates any clinical and radiation safety issues altogether and quality of medical care given to the patient is improved. The project assures better patient safety, especially in the radiation related environment. It also facilitates the physicians in selecting the correct procedure by traversing an organized hierarchy of procedure lists.
Discussion The project originated based on the need to reduce any patient identification errors and for ordering the right tests for the right patient with traceable documentation. An online Radiology Electronic Physician Order Entry System (RePOE) was developed in-house, closely integrated with the hospital’s HIS and RIS. The system is deployed for inpatient areas and future deployments will include ED and outpatient areas as well. The physicians are able to select the patient on a central patient care portal, select the necessary exams, allergies, transportation, etc. as well as provide additional information regarding the requested procedures. As the patients are selected from the HIS, errors in incorrect identification are eliminated which directly translates to quality patient care.
Conclusion The electronic Physician Order Entry system is one of the essential systems in any HIS environment that has a direct bearing on patient safety and the quality of care. Globally, such systems are not commonly deployed and they are generally classified as those systems that are difficult to implement with the necessary effective change management. Successful development and deployment within the inpatient areas provides a sound testimonial to the project itself.
Abstract no. 642 Exploring multimorbidity using bayesian models with time-based abstractions
Carla Silva, Mariana Lobo, and Pedro Pereira Rodrigues, CINTESIS - Center for Health Technology and Services Research, Faculty of Medicine of the University of Porto, Porto
Introduction Modelling complex disease systems can accelerate the development of productive strategies for identifying factors of multimorbididy. Multimorbity refers to the case of coincident event of a patient expressing more than two diseases simultaneously which, with an ageing population and better chronic diseases management, happens now more often. Given the possible interaction of diseases, the analysis of such conditions requires a dynamic modelling using temporal approaches. Our aim is to propose time-varying abstractions of probabilistic graphical models that can better describe the complexity of multimorbidity in a specific subgroup of patients with acute myocardial infarction (AMI) since these patients are likely to experience multiple comorbidities and develop new conditions.
Method A retrospective cohort of 500 patients admitted with AMI in Portuguese hospitals was included and followed for a maximum of 5 years, yielding a total of 893 hospitalisations and re-hospitalisations after AMI. We defined temporal abstractions, monitoring the occurrence of comorbidities within yearly periods after AMI. Univariate, bivariate and Dynamic and Temporal Bayesian network analysis were conducted on both the hospitalisations and the patients, either by using a) the yearly time-frame temporal abstractions, and b) the full follow-up time. We expose the cohort characteristics and the Bayesian networks to analyse different views of multimorbidity evolving with time. Comparison of different time models was achieved by typical measures in clinical research (e.g. sensitivity/recall and positive predicted values/precision) and the structural Hamming distance, while each comorbidity was finally abstracted using survival analysis.
Results Our preliminary analysis showed that AMI is more commonly located in heart surface other than inferior or lateral. Moreover, atherosclerosis and hypertension, were the most common conditions, while, protein-calories malnutrition, metastic cancer and acute leukemia, trauma, major psychiatric disorders, liver and biliary disease were observed infrequently. There were decreasing statistically significant associations between comorbidities in an abstraction by time events-based, and a constant number in a time intervals-based abstraction.
Discussion Bayesian modelling applied to multimorbididy arises from the need to develop, create and extract advanced knowledge regarding the modelling of diseases. Therefore, we focus on the inference of multimorbidity scenarios expressed in time. We noted different behaviours in multimorbidity assessment, when assuming different temporal abstractions, which might lead to more accurate research paths in the area.
Conclusion An abstraction in a time intervals-based is closer to the representative abstraction of the group in consideration. We came to the conclusion that the suggested data mechanisms can therefore be used to explain series of developments of multimorbidity.
Abstract no. 645 Building an informatics environment to track and monitor CT radiation dose for improved patient care
Mohammad Yusuf, Aga Khan University Hospital, Karachi
Introduction Aga Khan University Hospital is a JCIA accredited tertiary healthcare facility. Among a suite of other high end modalities, it has two Computer Tomography (CT) facilities comprising of 64 and 640 slice machines. The Informatics team identified a quality initiative to track and manage the CT radiation dose. An Informatics based environment was built up to extract, store, integrate and manage the Radiation dose information. This Informatics led initiative resulted in identifying the areas of improvement and radiation dose was reduced to international best practices.
Methods An integrated system was built up to track and manage the radiation dose for all CT examinations. The new CT technology allows various facilities to reduce the radiation dose to patients while retaining good the image quality. The compiled results showed a margin of improvement that resulted in this project. International standards were compared and the protocols were managed to reduce the dose levels. The reduction in radiation dose provides a huge benefit to the patients, especially the paediatric population undergoing CT examinations as it reduces the risk of incidence of cancer due to exposure of radiation causing ionization. CT Dose information was extracted from the standard dose reports from the imaging archive. These were then integrated with the patient demographics and the Hospital Information Systems.
Results The main benefit of the project was to improve patient care and ensure that the patient is exposed to only a minimum level of radiation dose for any CT examination. No cost impact is related to the project except for the backend IT resources. Proper planning and analyses was carried out to define the requirements and to build up an integrated system. The initiative led to the development of improved protocols, adherence to best practices and in lowering of radiation dose in some specific procedures to the recommended international standards. The results were significant and measurable. The changes in CT protocols have resulted in reduction of the radiation dose to the patients.
Discussion The role of Informatics has been pivotal in bringing the Radiology department to the workflows and serviced in the digital age. Informatics related initiative led to the planning and development of the CT radiation dose tracking and monitoring system. It helped in streamlining the CT workflows, develop better protocols, fine-tune the systems in collaboration with the vendors and finally build up a comprehensive dose tracking and management system. This has led to the reduction in radiation dose in specific procedures and improve overall patient quality of care.
Conclusion The project directly impacts a patient and improves the quality of care by recognizing that reducing radiation dose is beneficial for the patient and then directly making efforts to reduce the dose appreciably. As it is important to process in a phased manner to ensure that image quality is retained while reducing the radiation dose, initial results have reduces the dose by about 15%. Subsequent phases will further reduce the radiation dose level.
Abstract no. 646 Discharge abstract data quality changes over time: comparing validity of 2003 and 2015 ICD-10 CA coding of charlson and elixhauser conditions, and adverse events
Cathy Eastwood, Danielle Southern, Danielle Fox, Olga Grosu, Ellena Kim, Chris King, Nicholas vanKampen, Natalie Wiebe, and Hude Quan, University of Calgary, Calgary
Introduction The World Health Organization (WHO) has been developing the eleventh version of the International Classification of Disease (ICD-11), to enhance the data captured from hospital records. As one of three WHO Collaborating Centres (with the Mayo Clinic and Stanford University in the USA), we are testing the “fitness of ICD-11” for improvements before full adoption by the WHO in 2018. As a first step, we will assess agreement between ICD-10-CA and chart review using ICD-11 concepts of medical conditions. Using coded administrative health data for research requires an assumption that the validity of the conditions’ coding is stable over time. Previous work1 showed that the implementation of ICD-10 coding has not significantly improved the quality of administrative data relative to ICD-9-CM. Therefore we will perform an assessment of the validity of ICD-10 data, as coders have gained experience with the coding system. We will test this assumption by studying the temporal trends of coding for multiple conditions in the Canadian hospital Discharge Abstract Database. The objectives were: 1) To compare trends in coding of conditions over time, and 2) To compare ICD-10-CA coded data to ICD-11 concepts through chart review to assess potential improvements to the classification.
Methods To date, we reviewed 1400 of 3000 randomly selected inpatient health records from 2015 from three teaching hospitals in Calgary, Canada, for the Charlson and Elixhauser conditions and 18 categories of adverse events. These hospital records were previously coded using ICD-10-CA the chart reviewers were blinded to the ICD-10-CA coding. Reviewers are identifying conditions as defined by ICD-11 Beta. Validity of ICD-10-CA coding in 2003 will be compared with the validity of ICD-10-CA coding of 2015. Trends in validity over time will be reported. Conditions coded in ICD-10-CA will then be compared to those captured through chart review in ICD-11 Beta.
Results The current health record review will produce a rich and robust database upon which to validate both ICD-10-CA and ICD-11 coding. Sensitivity, specificity, positive predictive value and negative predictive value of ICD-10-CA will be calculated for the multiple conditions, with chart review as the reference standard on the 2015 set of records. Comparison with ICD-11 chart review will provide an assessment of the improvements that ICD-11 will provide for the coding of conditions and adverse events.
Conclusion This study will highlight potential changes in validity of ICD-10-CA in recording the Charlson and Elixhauser conditions and patient safety indicators over a 12-year period. The highest possible data quality is essential for identifying disease prevalence, trend analysis for chronic disease surveillance, and health services planning. Recommendations for ICD-11 based on findings from this extensive validation study, will be communicated to the WHO.
Reference
Jiang, J., Southern, D., Beck, C., James, M., Lu, M., Quan, H. (2016). Validity of Canadian discharge abstract data for hypertension and diabetes from 2002 to 2013. CMAJ Open 2016. 4(4). DOI:10.9778/cmajo.20160128
Abstract no. 647 Assessing the association between different patient indexing strategies and effective indexing during the implementation of an electronic medical records system in the public health system of buenos aires, Argentina.
Santiago Esteban, Leandro Alassia, Analia Baum, and Cecilia Palermo, Dirección General de Informática Clínica, Estadística y Epidemiológica, Health Ministry, City of Buenos Aires, Buenos Aires
Fernan Gonzalez Bernaldo de Quiros, Jefatura de Gobierno de la Ciudad Autónoma de Buenos Aires, Argentina, Buenos Aires
Introduction Within the process of implementing an electronic medical records system (EMR), the creation of a master table of patients (MTP) is an essential step. Starting in January of 2016, the Ministry of health of the city of Buenos Aires is implementing the computerization of the medical records in the public health system. In this process, several patient indexing strategies have been adopted by each primary care health centre according to the features of the centre and its population. Thus, we decided to evaluate the association between the different patient indexing implementation strategies and the rate of effective patient indexing.
Methods Prospective cohort using data extracted from the MTP and the EMR. We included all persons registered in the system between 2016-06-01 and 2016-11-24. The patient indexing implementation strategy was agreed upon with the chair of every health centre. Then, these strategies were grouped in three modalities according to the intensity and methodology used: low intensity: patient registration is an alternative instance to the usual medical care process. It depends on the availability of time of the administrative workers. Paper medical records are predominant. Intermediate intensity: registration is offered mostly to patients who request appointments through the computerized system or those who visit the centre for non-medical purposes (acquiring instant formula or process related to social security). Paper and electronic records coexist. High intensity: the indexing process is proposed as a condition in all instances of consultation at the health centre. As result, we assessed the time since the registration to the first visit registered in the EMR. This was done since the crude indexing (total number of indexed patients) can reflect many people who are indexed but who do not seek medical care. The unadjusted rates of effective indexing were estimated using the Kaplan-Meier method. The curves were compared with the Log Rank test. For the multivariate adjusted model, we used Cox’s proportional hazards regression.
Results The crude analyses showed a significant difference between the curves (p < 0.0001). In the multivariate analysis, many variables violated the proportional hazards assumption, even the exposure variable. This was resolved by creating interaction terms with a flexible function of time for the covariates. For the exposure, a segmented time analysis was used, creating seven day intervals within which, the assumption held. The hazard ratios (HR) of high and low intensity interventions showed on average values above 1 from 0 to 90 days compared to the intermediate intensity strategy (High:2.08 (1.65,2.52) Low:2.59 (2.29,2.9)). From that point on, the HRs of both strategies were not different from 1.
Conclusion Promoting indexing in instances not related to healthcare yielded the worst results in regard to effective indexing. This probably points towards the importance of the medical staff being involved even in the patient indexing process. The results of our study provide us more information in order to discuss the pros and cons of the available indexing strategies with the health centres’ authorities in future implementations.
Abstract no. 649 Assessing the association between age and the probability of being indexed in a master patient index within the process of implementing an electronic medical records system in the public health system of buenos aires, Argentina.
Santiago Esteban, Manuel Rodriguez Tablado, Francisco Recondo, and Analia Baum, Dirección General de Informática Clínica, Estadística y Epidemiológica, Health Ministry, City of Buenos Aires, Buenos Aires
Fernan Gonzalez Bernaldo de Quiros, Jefatura de Gobierno de la Ciudad Autónoma de Buenos Aires, Argentina, Buenos Aires
Introduction The health ministry of the city of Buenos Aires (CABA) has set out to computerize its public health system. The process started at the primary care health centres (PCHCs). One of the critical steps of this project is the creation of a master patient index. Concerns were raised in regard to this indexing process (registration process of personal and demographic data as well as identity verification) possibly interfering with the accessibility to healthcare. One hypothesis is that indexing does not occur at random but rather it was conditional on certain patients’ characteristics, age being one of those factors. Given the importance of the registration process, we decided to investigate the association between patient age and the probability of being indexed.
Methods We included all patients who consulted at three PCHCs (No. 5, 7 and 29) during the months of June and July of 2016, and we evaluated the association between age and the probability of being registered. We adjusted for covariates like age, sex, place of residence, PCHCs of consultation and nationality.
Results We identified 4477, of which 1464 were indexed. The mean age was 14 in the non-indexed group (NIG) and 13 in the index group (IG) (p = 0.578). Of the NIG, 42.7% were between 0 and 10 years old, 17% between 11 and 20 years old and 40.3% older than 20 years old. Of the IG 45.8% were between 0 and 10 years, 12.5% between 11 and 20 years and 41.7% over 20 years. Multivariate analysis, adjusting for potential confounders, showed that patients younger than 11 years of age had a 1.8-fold odds ratio of being indexed compared to patients older than 10 years (p <0.0001), with no difference between CPHC of attention.
Discussion These results support the initial hypothesis that the registration does not arise from a random process, with age being one of the most determinant variables. This could be due to distrust of some adults to share their personal data. We also understand that resistance to registration may be related to the fact that we are evaluating the first few months of a novel process.
Conclusion The results seem to indicate an association between the age of the patients and their probability of being registered. These data allow us to plan future research to clarify the causes of differential registration and strategies to solve it.
Abstract no. 653 Audit and feedback in primary care effectiveness and informatics
Maxime Lavigne and David L. Buckeridge, McGill Clinical & Health Informatics, Department of Epidemiology and Biostatistics, McGill University, Montreal
John B. Hughes, Faculty of Medicine, McGill University, Montreal
Introduction Audit and feedback (A&F) promotes the adoption by clinicians of evidence-based findings and aims to improve healthcare quality. It tries to influence their behaviour in order for them to establish practice patterns leading to improved performance and better health outcomes. A&F is a good candidate for computerization due to its reliance on information processing. Although feedback interventions are effective in other fields, in healthcare they produce moderate effects with variable results. Exploring the cause of this limited effectiveness is difficult due to poor reporting of the theoretical basis of interventions. This study aims to identify the barriers to effective computer-assisted A&F interventions in healthcare and to suggest how informatics methods implemented in the context of theories of behaviour change (BC) can help to overcome these barriers.
Method This study used a qualitative, explanatory case-study design applying deductive thematic content analysis to computer-assisted A&F interventions identified through a review of the literature. After reviewing 456 A&F studies, qualitative data was collected from four documents using a coding scheme developed by combining multiple theoretical perspectives and adjusted to allow the extraction of resource utilization content. The codes were synthesized into representative themes which identified possible determinants of effectiveness and framed them in the context of their deployment as integrated informatics system.
Results The thematic analysis led to the identification of six overarching barriers to effective A&F implementation: “Resource Constraints” includes limitations related to the additional costs and labour required “Diffusion of Information” refers to issues related to the adoption and use of new technologies “Clinical Governance” or the expectation of A&F systems to integrate within existing organizational planning and quality improvement efforts “Dynamic System and Control Theory” addresses how the causal mechanisms of A&F can be used to drive design choices “Cognitive Biases and Behavioural Economics” relates to how real users differ from theoretical rational agents, and how this can affect A&F interventions and “Learning Culture” underlines the importance of fostering the right culture in order to drive sustainable change.
Discussion Qualitative content analysis has limited abilities to explore beyond what the authors chose to include. It however mitigates the effect of heterogeneous reporting on data extraction and allows the generation of richer accounts of the cases. The use of a case-study design enabled us to stay true to the context in which A&F took place. It has produced a holistic view that would be difficult to capture through experimentation or surveys. Focusing on actionable evidence meant the barriers and themes identified are well suited to driving new A&F interventions.
Conclusions Using qualitative content analysis and a multi-theory approach, we identified a set of principles for effective A&F design. We found that informatics facilitated the development of A&F and improved compliance with the proposed principles. This finding suggests that the effectiveness of computer-assisted A&F could be improved through careful application of the identified principles and that computer-assisted A&F is different enough from other types of A&F to warrant separate evaluation. More evaluation is needed as to the effects of the principles.
Abstract no. 656 On the variability patterns in general practitioner prescribing behaviour
Magda Bucholc, University of Ulster, Intelligent Systems Research Centre, Londonderry
Maurice O’Kane, Healthcare Analytics Limited, Portadown
KongFatt Wong-Lin, Altnagelvin Hospital, Western Health and Social Care Trust, Londonderry
Introduction Most interest in the variability in drug prescribing behaviour has been focused on cost saving. It has been estimated that £200 million could be saved if unwarranted variations in prescribing activity were reduced and the drugs were prescribed with the same standard. Such variation indicates the need to focus on efficiency and appropriateness of clinical practice and to examine the possibilities that a large variation might be related to inappropriate prescriptions. Our work examines the change in variability of primary care drug prescribing rates in Northern Ireland’s Western Health and Social Care Trust and investigates its relationship with laboratory test ordering rates.
Method The GP prescribing data (Apr 2013 – Mar 2016) for 55 general practices within the Northern Ireland Western Health and Social Care Trust was obtained from the Business Service’s prescribing and dispensing information systems. The total number of test requests was collected from the laboratory databases of the Altnagelvin Area Hospital, Tyrone County Hospital, and the South West Acute Hospital. Both the number of drug prescriptions and laboratory tests requested in each practice was normalized by the number of registered patients. The variability of drug prescribing data was determined by calculating the coefficient of variation (CV). The degree of correlation between the laboratory test ordering rates and drug prescribing rates was assessed by calculating the Spearman’s correlation coefficient (R).
Results We observed pronounced differences in drug prescribing rates among general practitioners. The high inter-practice variability in drug prescribing behaviour was shown to be caused by several GP practices with abnormally high ordering rates. No correlation between the total standardized number of prescriptions and the most commonly requested laboratory test (electrolyte profile) was reported (R = 0.107, 0.245, and 0.220 in 2013-14, 2014-15, and 2015-16 respectively). In addition, the strength of association between the most common medications used to treat under- and over-active thyroid (i.e. carbimazole, propylthiouracil, levothyroxine, and liothyronine) and the standardized laboratory test requests for thyroid profiles (FT4 and TSH) was found to be very weak (R = 0.028, 0.017, and 0.037 in 2013-14, 2014-15, and 2015-16 respectively).
Discussion There is clearly variability in prescribing rates between general practices, suggesting that the costs of prescription could potentially be lower if the variation is reduced. However, since higher variability does not necessarily suggest lower quality practice, it requires further inspection to determine if the patient population associated with specific GP practices is different and have different needs. The lack of correlation between the prescription rates and requesting rates for laboratory tests shows that practices that request laboratory tests at relatively higher or lower rates than average are not necessarily the ones with higher/lower prescription rates. This implies that other factors may influence GP’s decisions tendency to prescribe or some laboratory tests are simply ordered inappropriately.
Conclusions Our investigation of variability in drug prescribing rates between general practices provides valuable information on practice variation and helps prioritise future research studies to improve the quality of prescribing. We suggest that optimisation of prescribing could be enhanced by conducting appropriate clinical interventions.
Abstract no. 657 Investigating the accuracy of parent and self-reported hospital admissions: a validation study using linked hospital episode statistics data
Leigh Johnson, Rosie Cornish, Andy Boyd, and John Macleod, University of Bristol, Bristol
Introduction The Avon Longitudinal Study of Parents and Children (ALSPAC) is a large prospective study of around 15,000 children born in and around the city of Bristol in the early 1990s. Participants have been followed up intensively since birth through questionnaires, clinics and linkage to routine datasets. In 2013 ALSPAC extracted information on a pilot group of consenting participants from the Hospital Episode Statistics (HES) database. The aim of this study was to validate parent-reported and self-reported data on hospital admissions against HES-recorded hospital admissions.
Methods Subjects included in this study were 3,195 individuals enrolled in ALSPAC who had consented to linkage to their health data before the end of 2012. In nine questionnaires completed when the children were aged between 6 months and 13 years old, parents were asked if their child had been admitted to hospital in the time since the issue of the previous questionnaire (the periods covered varied, ranging from 6 months to 4 years). Additionally, when the participants were 18 years old they were asked whether they had been involved in a road traffic accident in the past year and, if so, whether they had been to accident and emergency (A&E) or stayed overnight in hospital. We compared this information to data recorded in the HES database for the corresponding time period and calculated sensitivities, specificities and predictive values of the questionnaire-reported admissions and A&E attendances, using HES records as the reference standard.
Results Up to 10% of individuals had been admitted to hospital during the time periods covered by the questionnaires. Among those whose parent reported a hospital admissions, at least 60% had one or more corresponding admission in the HES data. Where a hospital admission was not indicated on the questionnaire, an admission was found in the HES data for between 1.4% and 3.6% of the participants. Initial analysis suggests that some of the parent-reported admissions may have actually occurred prior to the period referred to in the questionnaire. Further analysis is planned to investigate other possible explanations for the observed discrepancies. Results for accident and emergency attendances and admissions for road traffic accidents reported by the young people will also be presented.
Discussion & Conclusions We found that the specificities and negative predictive values of parent-reported hospital admissions were high at all ages. The sensitivities and positive predictive values were lower. There are several possible explanations for this. A proportion of respondents may have interpreted the questions about admission to hospital as including visits to A&E and/or outpatient appointments. The HES database only includes A&E data from April 2007 (when the ALSPAC children were aged 15-16 years old) and outpatient data from April 2003 (when they were 11-12) so it was not possible to examine whether this explained the low sensitivities. Further, some hospital admissions would be to non-NHS providers which are not recorded in HES. Conclusions will be drawn when the additional analyses outlined above have been carried out.
Abstract no. 663 Genealogical information from co-insurance networks in pseudonymized administrative claims data in Austria
Florian Endel, Vienna University of Technology, Vienna
Introduction Routinely collected administrative claims data from the Austrian health and social insurance system is available for research in the GAP-DRG database. It is operated by Vienna University of Technology on behalf of the Main Association of Austrian Social Security Institutions. GAP-DRG holds pseudonymized information on reimbursement of prescriptions, inpatient and ambulatory outpatients contacts of almost all 8 million inhabitants. Genealogical information and family relationships are not directly available in the database. In this project, it is indirectly deduced, analyzed and integrated into GAP-DRG. This project is part of the K-Project dexhelpp in COMET and funded by BMVIT, BMWGJ and transacted by FFG.
Methods Co-insurance of relatives as spouses, children and close family members is encoded in the reimbursement information of GAP-DRG. These relationships between two persons are used to extract networks representing individuals who are associated with each other by co-insurance. Persons are classified as children, parents, in a relationship or single based on thorough data analysis and applying rules originating from qualitative descriptions of family structures in Austria. Additional data as the direction of the graph, representing the dependence of one partner on another and weights of edges holding information on e.g. difference in age is included. Visualization and common methods from graph theory are utilized to extract more details about data quality, social structure of the insured population and also limitation of the data and applied approach.
Results Depending on quality requirements, there are around 2,000,000 persons in the final dataset on co-insurance. In addition to the estimation of genealogical information, new insights into the database and especially data quality are acquired (e.g. persons older than 120 years could be identified as miscoded children due to their dependence on their parents). Networks of related persons allow in-depth analysis and informative visualizations. New quality issues were identified and missing information on e.g. the socio-economic status could be imputed or corrected. Furthermore, the estimated personal information enables novel research questions and. Due to the stepwise procedures, the implemented approach can be directly adapted to new data or particular projects.
Discussion Although solid and promising results have been obtained, additional analysis and concrete limitation have to be discussed. The quality and interpretation of co-insurance networks might vary over time, region and data source (e.g. social insurance institution). Because relationships are derived from co-insurance, couples not depending on each other directly or indirectly by a common child cannot be detected. As a result, the identification of parents is of a higher quality. External validation, verification of the methodology and its application have to be discussed.
Conclusion Genealogical information and networks of co-insurance can be estimated using administrative data. The presented method is straightforward and flexible but also pointed out limitations of the data collection and its quality. Previous knowledge about GAP-DRG and its general quality and trustworthiness could be verified. Summarizing, the newly acquired information on relationships and the extracted networks of co-insurance are interesting on their own and are expected to are the basis of novel data analysis and research.
Abstract no. 664 Predicting 90-Day hospital readmission risk for chronic obstructive pulmonary disease (COPD) patients using health administrative data from Quebec, Canada
Erin Yiran Liu, Aman Verma, Deepa Jahagirdar, and David L. Buckeridge, McGill Clinical & Health Informatics, Department of Epidemiology and Biostatistics, McGill University, Montreal
Jean Bourbeau, Respiratory Epidemiology and Clinical Research Unit, Research Institute of McGill University Health Centre and McGill University, Montreal, Montreal
Introduction Chronic obstructive pulmonary disease (COPD) affects 10% of the adult population and is the third leading cause of death in the world. The progressive nature of COPD results in frequent hospitalizations, placing a considerable burden on the healthcare system. While some of these health care visits are unavoidable, many readmissions could be prevented if the transition of care from acute to community-based services was improved. This awareness of the importance of transitions-incare has led to interventions such as discharge care bundles, which include enhanced follow-up care and referral to specialized programs. Given the tailored nature and cost of these interventions, it is important to identify those who are more likely to be readmitted so that hospital administrators can target these high-risk patients. The objective was to develop a model for predicting the 90-day readmission risk for COPD patients following hospitalization.
Methods The data source used for this study was the Population Health Record (PopHR), which contains linked health administrative data for a 25% random sample of residents of Montreal, the second largest city in Canada. The system includes linked data on hospitalizations, ambulatory care visits, prescriptions, and physician billings for 1.4 million individuals. COPD patients were identified using the validated case definition of ≥1 ambulatory claims and/or ≥1 hospitalizations for COPD. Using logistic regression, the risk of 90-day readmission was predicted based on patient characteristics, previous healthcare use and data from the index hospitalization. Due to the high dimensionality of certain data elements, the lasso technique was used as a feature selection tool and model accuracy was assessed using cross-validation on a 20% sample.
Results From Apr 1, 2006 – Mar 31, 2014 there were 12,314 COPD patients who were alive at discharge from their first hospitalization. During the 90-day follow-up, 860 (6.98%) patients died and 2,335 (18.96%) had an urgent readmission. Significant predictors for readmission included age (OR = 1.56, 95% CI: 1.24 - 1.95) for those older than 71 compared to patients ≤ 50 years old, ≥1 ED visit in the previous 6 months (OR = 1.70, 95% CI: 1.44 - 2.01), a respirologist visit in the previous 6 months (OR = 1.32, 95% CI: 1.07 - 1.63), a length of stay of ≥ 6 days on the index hospitalization (OR = 1.51, 95% CI: 1.27 - 1.80), and having a discharge diagnosis of atrial fibrillation (OR=1.58, 95% CI: 1.14 - 2.19), lung cancer (OR = 1.82, 95% CI: 1.41 - 2.36), pneumonia (OR = 2.40, 95% CI: 1.33 - 4.33), or heart failure (OR: 1.72, 95% CI: 1.36 - 2.18). The model produced an area under the curve of 65%.
Conclusions Older patients with a history of ED visits and respirologist consultations and admitted for lung cancer, pneumonia and cardiovascular disorders were more likely to be readmitted. These findings are consistent with previous research that readmissions tend to occur in patients with more severe disease. Further research is needed to assess potential differences in quality of care for readmitted and non-readmitted COPD patients, post-discharge.
Abstract no. 671 Governance of shared health information in Canada
Karim Keshavjee and Linying Dong, University of Toronto, Toronto
Susan Anderson, Orion Health, Edmonton
Diane Edlund and Carol Brien, COACH, Toronto
Selena Davis, University of Victoria, Victoria
Introduction Health organizations in socialized medicine contexts have a unique constraint: they don’t have access to information beyond the boundaries of their own organization. Yet, it is increasingly evident that lowering costs in health care, coordinating care and personalizing care will require the pooling of data from multiple sources.1,2 Other areas of human endeavour have achieved this. From sharing common lands3 to sharing data for transport,4 there are good examples of ways we can share information assets in common.
Methods A literature search of peer-reviewed articles was conducted using Google Scholar and Pubmed on governance of shared health information. A search of the grey literature on governance of shared assets was also conducted in Google. Approximately 100 relevant articles were identified.
Results
Principles of Shared Health Information Governance
The researchers identified over 25 principles relevant to the governance of shared health information. All 25 principles fell into one of four themes: Policy, People, Process or Technology. Through refinement, seven principles were distilled for governing how health information should be shared between multiple health sector entities to achieve system level goals (Table 1).
Discussion To our knowledge, this is the first articulation of principles for using health information as “a resource for action and decision-making” as opposed to “as a resource for documentation and record-keeping” which characterizes the data and IT governance literature. These principles are specific to sharing health information across multiple organizations as well as directly with patients. The principles need to be validated by stakeholders who stand to gain or lose from implementing them in actual practice.
References
Blumenthal D, Chernof B, Fulmer T, Lumpkin J, Selberg J. Caring for High-Need, High-Cost Patients - An Urgent Priority. N Engl J Med. 2016 Sep 8375(10):909-11.
Duarte TT, Spencer CT. Personalized Proteomics: The Future of Precision Medicine. Proteomes. 20164(4). pii: 29.
Ostrom E. Governing the commons. Cambridge university press 2015 Sep 23.
‘Big Data Versus Big Congestion: Using Information To Improve Transport’. McKinsey & Company. N. p., 2015. Web. 25 Nov. 2016.
Abstract no. 672 Health data visualization for consumer/ patient, clinician, and researcher insights
Suzanne Bakken, Adriana Arcia, Dawn Dowding, and Jacqueline Merrill, Columbia University, New York, NY
Sunmoo Yoon, Visiting Nurse Service of New York, New York, NY
Introduction Visualization is an integral component of data science. Visualizations of health data can be an effective means of deriving insights for patients, clinicians and researchers. Information visualization is an important aspect of the Precision in Symptom Self-Management (PriSSM) Center and our efforts range from infographics representing small data, such as blood pressure, physical activity levels, and self-reported anxiety levels designed for consumers/patients, (Figures A & B) to electronic dashboards for clinicians, and network diagrams of big data for research discovery of patterns and potential intervention targets (Figures C & D).
Methods Specific methods vary depending upon of the purpose of the visualization and the intended audience. However, a typical design process begins with prototyping by PriSSM Center Visualization Design Studio experts followed by iterative participatory design with members of the end-user population. For visualizations designed for consumers/patients, formal comprehension testing is also undertaken. A variety of software products are used to create the visualizations. These include Tableau, Adobe Illustrator, Node XL, NVivo, ORA, and custom software that our team built in a previous research project: EnTICE3 (Electronic Tailored Infographics for Community Engagement, Education, and Empowerment) system.
Results

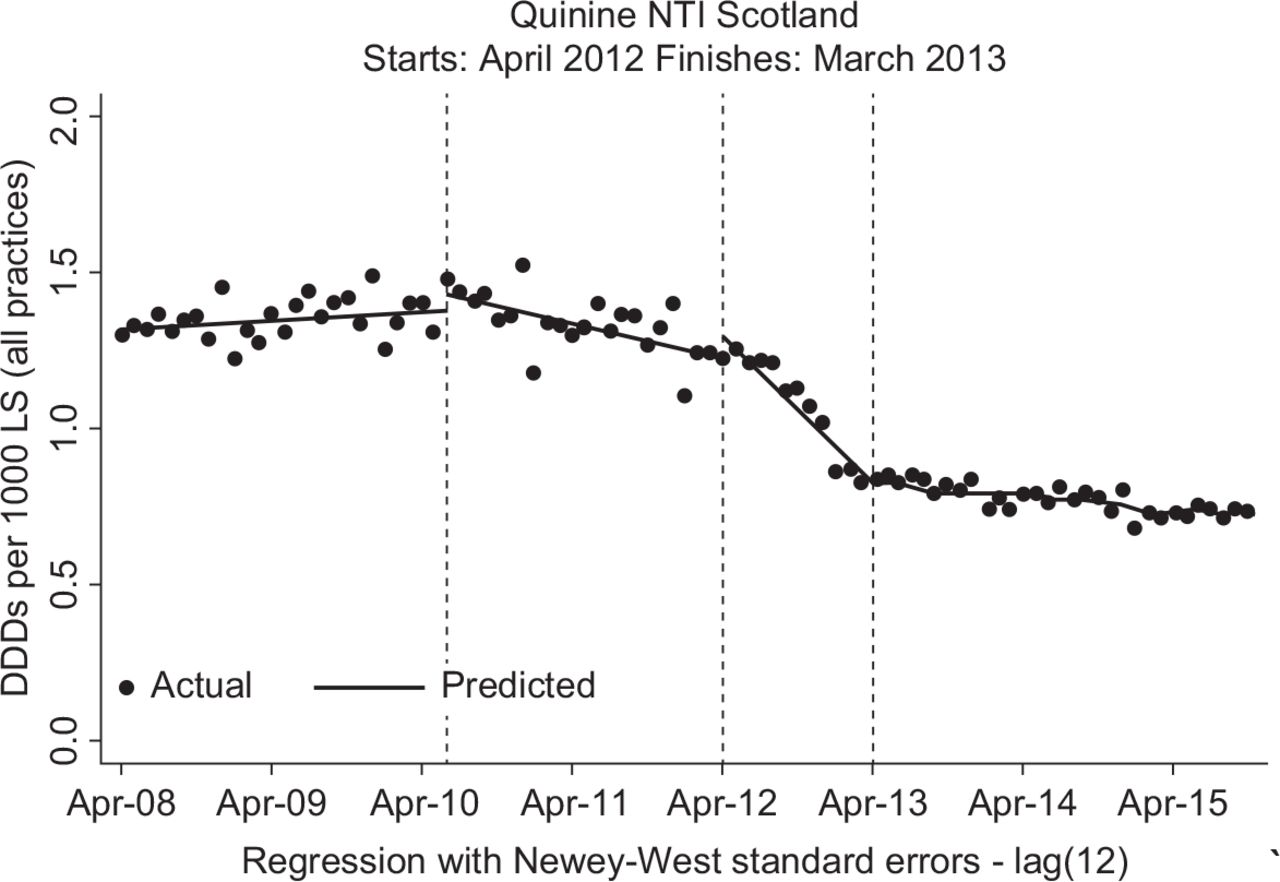
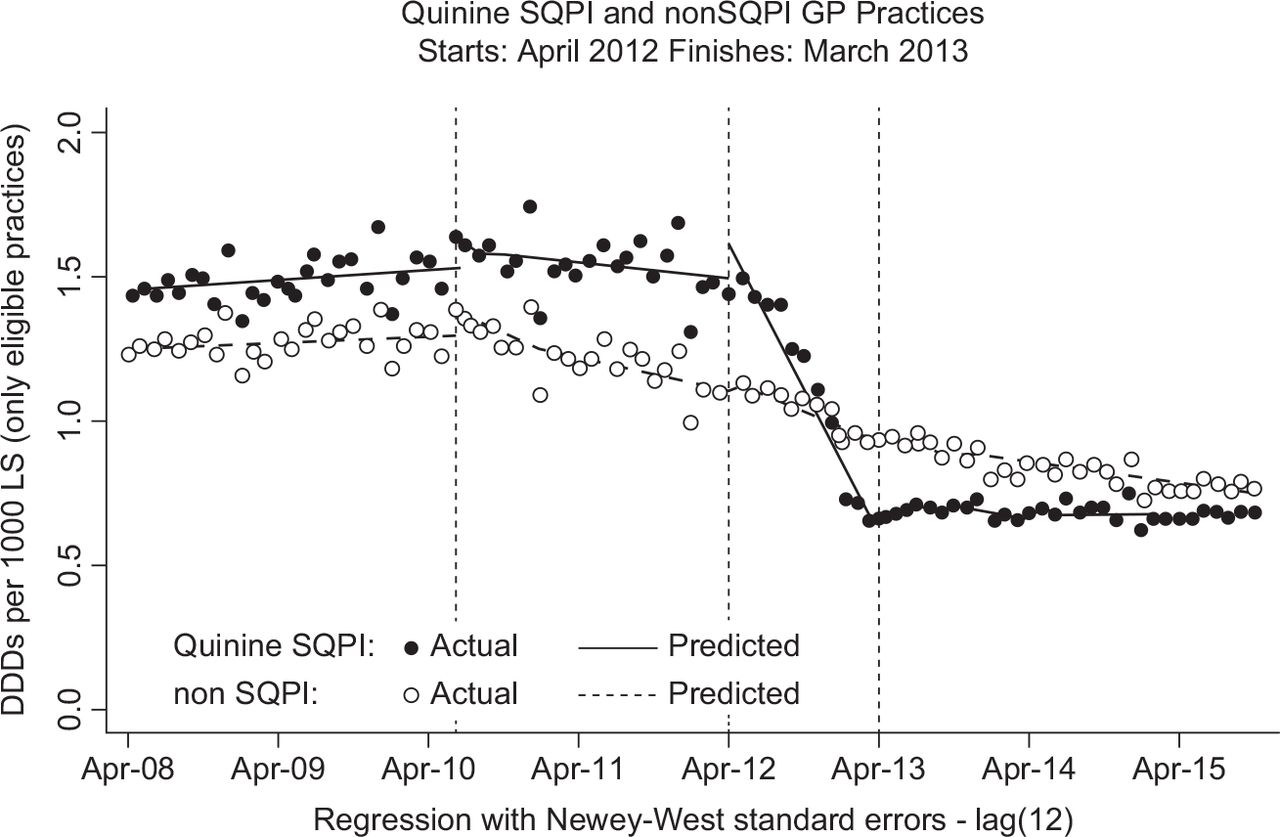
Discussion Visualizations are integral to data science and critical to advanced data analytics. Our team applies a structured approach and a variety of methods to create visualizations which have resulted in designs that allow consumers/patients, clinicians, and researchers to derive insights from data.
Conclusions We continue to evolve our visualization design research as an approach for promoting consumer/patient, clinician, and researcher insights.