Article Text

Abstract
Background Ethnicity recording within primary care computerised medical record (CMR) systems is suboptimal, exacerbated by tangled taxonomies within current coding systems.
Objective To develop a method for extending ethnicity identification using routinely collected data.
Methods We used an ontological method to maximise the reliability and prevalence of ethnicity information in the Royal College of General Practitioner’s Research and Surveillance database. Clinical codes were either directly mapped to ethnicity group or utilised as proxy markers (such as language spoken) from which ethnicity could be inferred. We compared the performance of our method with the recording rates that would be identified by code lists utilised by the UK pay for the performance system, with the help of the Quality and Outcomes Framework (QOF).
Results Data from 2,059,453 patients across 110 practices were included. The overall categorisable ethnicity using QOF codes was 36.26% (95% confidence interval (CI): 36.20%–36.33%). This rose to 48.57% (CI:48.50%–48.64%) using the described ethnicity mapping process. Mapping increased across all ethnic groups. The largest increase was seen in the white ethnicity category (30.61%; CI: 30.55%–30.67% to 40.24%; CI: 40.17%–40.30%). The highest relative increase was in the ethnic group categorised as the other (0.04%; CI: 0.03%–0.04% to 0.92%; CI: 0.91%–0.93%).
Conclusions This mapping method substantially increases the prevalence of known ethnicity in CMR data and may aid future epidemiological research based on routine data.
- epidemiology
- ethnicity
- primary care
Commons license http://creativecommons.org/licenses/by/4.0/
Statistics from Altmetric.com
INTRODUCTION
Ethnicity is an important determinant of healthcare inequality worldwide. Disease pattern and presentation,1 alongside uptake and utilisation of healthcare services,2 varies across ethnic groups.
Ethnicity recording within primary care health records was introduced in 1991, followed by the introduction into Hospital Episode Statistics in England in 1995.3 Despite its prolonged inclusion time ethnicity recording within primary care data remains suboptimal.4 This has been attributed to an oversimplification of classifying hierarchies,5 practical and administrative difficulties in data collection,6–8 alongside inaccuracies in the data recorded. The use of surname recognition software alongside estimations of ethnic makeup according to census data, as a means of inferring ethnicity, has been attributed as the reason for these inaccuracies.9,10 These methods have limitations and run significant risks of misclassifying individuals compared to the gold standard measure of self-reported ethnicity.11,12
The Quality and Outcomes Framework (QOF) is a pay-for-performance system introduced in 2004 to improve chronic disease management in primary care. It has included incentivising the recording of ethnicity since 2006, resulting in more comprehensive recordings.3 Although QOF payments may distort coding,13 overall they have probably improved data quality. However, inconsistencies persist, with low concordance of multiple ethnicities recorded in some minority groups.11
The UK coding system for primary care is the Read Classification.14 Diagnostic codes obtained using differing coding structures can vary in their inference and interpretation.8,15 The taxonomies for recording ethnicity within this classification are complex and tangled;16 different ethnicity classifications, language, country or origin codes and religion all convey some information about ethnicity with differing levels of granularity. Published literature has predominantly focused on two principal groups of ethnicity codes, ‘9i… Ethnic Category-2001 census’ and ‘9S…ethnic group’ codes, within the UK Read code system,14 which have been mapped onto the Office for National Statistics (ONS) Census.
Ontologies allow the description of key concepts and their relationships within a domain,17 with a view to explicitly defining data when utilising it for chronic disease management18 and integrated care.19 An ontological approach, allowing identification and classification of a number of varying coding hierarchies within primary care data, would allow identification of ethnicity of patients from a number of differing inferences.
We carried out this study to explore whether we could increase the number of appropriately coded ethnicities recorded in primary care data while taking a more ontological approach to ethnicity data. Developing this ontological approach should allow an extended and more defined mapping of ethnicity within healthcare datasets and improve epidemiological studies of disease progression and service utilisation within ethnic groups.
METHODOLOGY
The objective of this study is to maximise the number of cases for which we can reliably report ethnicity by mapping relevant clinical codes onto the 2011 census categories through use of language and interpreter codes. This approach is an extension of an existing mapping method.20 In addition, we have looked at whether other codes could be used as a proxy measure of ethnicity.
The ontological process takes place in three steps: (1) the conceptual or ontological layer that groups concepts and is coding system independent so could be applied to any computerised medical record (CMR) systems that had one or more of the data categories; (2) the coding layer (specific to the coding system); and (3) the logical data extract model.14
This analysis was conducted using data from the Royal College of General Practitioners’ Research and Surveillance database, comprising 110 practices across England and Wales.
Ontological process
Ontological and coding layer
The ontological layer requires the definition of the relevant concepts, in this case of ethnicity, and their relationships. A number of ethnicity related concepts, such as ethnicity, nationality and language, were reviewed in a number of clinical terminologies including Read2, Clinical Terms version 3 (CTv3) and Systematized Nomenclature of Medicine-Clinical Terms (SNOMED-CT) to develop an overarching semantic information model (Figure 1).
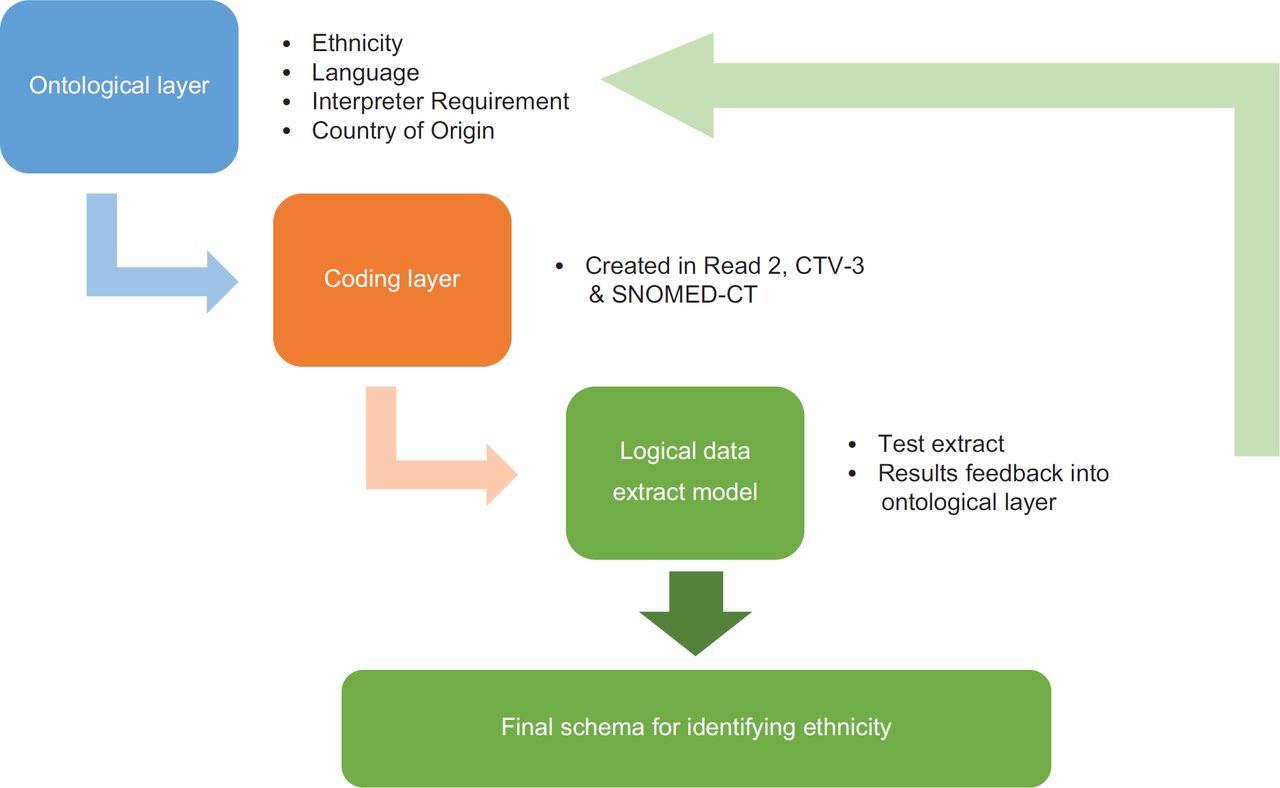
NHS Browser derived Read 2 codes, CTv3 and SNOMED-CT were used to derive relevant coding hierarchies. Relevant coding hierarchies are highlighted (Table 1). Codes were divided into definite (coding hierarchies directly coding an identifiable ethnicity), probable (coding hierarchies which have a high probability of inferring an ethnicity), and possible (coding hierarchies which were deemed possible to infer an ethnicity from) layers.
Rates of code accuracy, other than census derived ethnicity codes, were measured in an attempt to determine whether they could be effective proxies for ethnicity. Utilising ontologically defined valid read codes, data extraction queries were developed, allowing the identification of the proportion of patients within the dataset that had ethnicity coded, as per each of the coding layers of the ontology (Table 1). The validity of probable or possible coding hierarchies as proxy markers for ethnicity was determined by a mapping of greater or equal than 80% to definite codes. If less than 80% of patients with a probable or possible code did not also have a corresponding definite code, then the probable or possible code was discarded as a not suitable proxy for ethnicity. For example, use of specific language and interpreter codes was seen to have a greater than 80% mapping to codes that definitively inferred a Bangladeshi ethnicity and could be used as proxy measures (Table 2).
Logical data extraction model
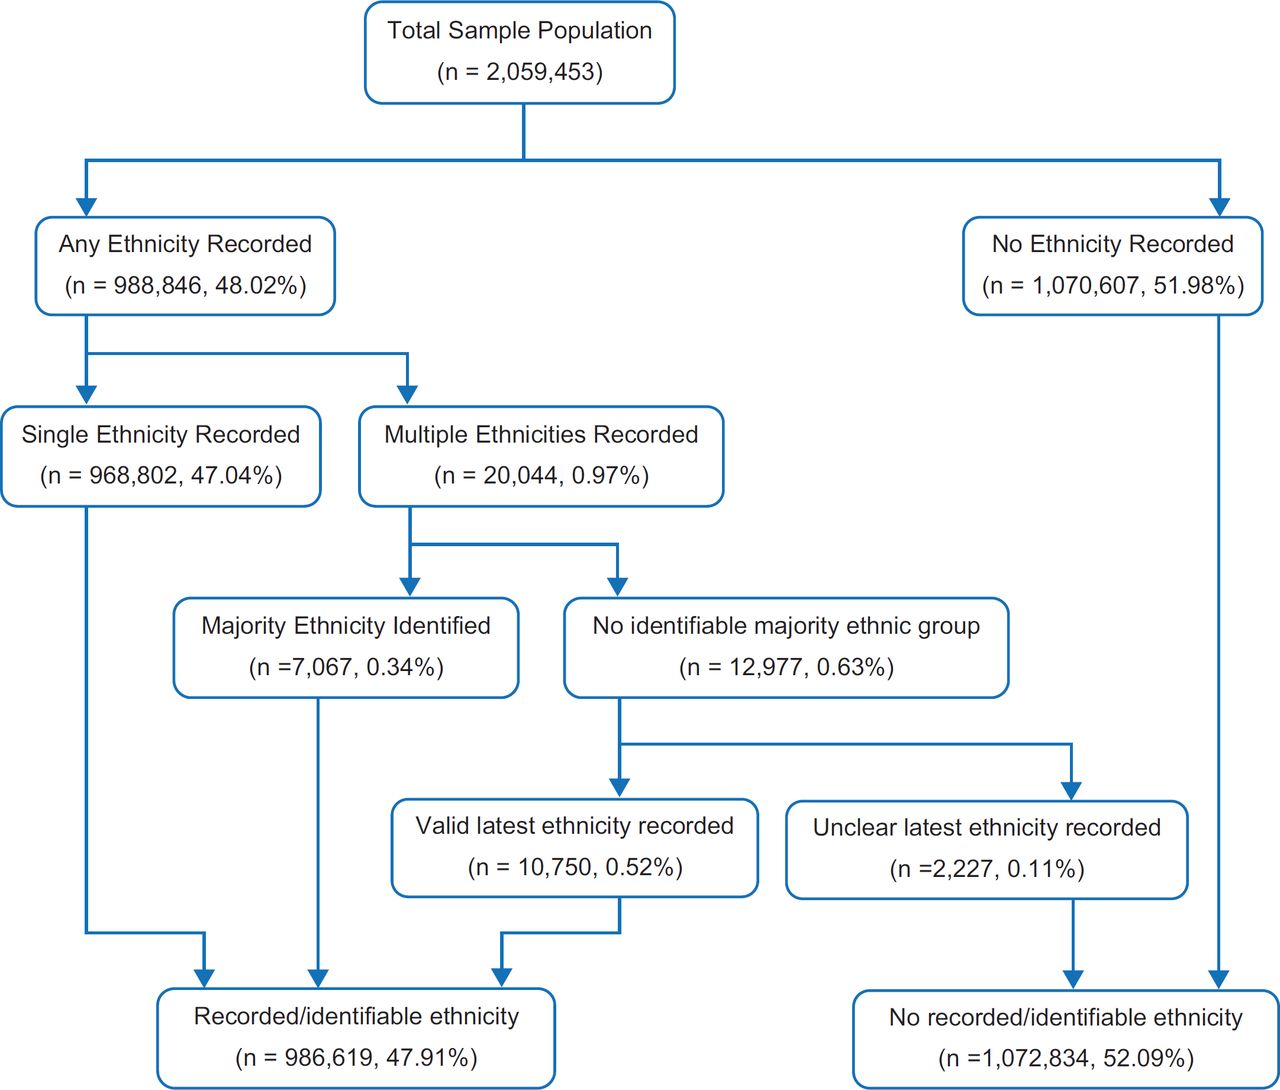
An algorithm was developed for the classification of patients into a 2011 Census ethnic group (Figure 2). Patients with a single ethnicity were easily classified, with preference given to definite codes followed by the proxy codes (probable and possible), if available. Those patients with multiple ethnicity codes recorded over time were classified according to the most common ethnicity recorded, using the same hierarchy of preferred codes described above. In those patients for whom there was no majority ethnicity recorded, the most recent coded ethnicity was utilised. Some patients had multiple ethnicities recorded on their latest consultation; if there was no clear majority on the latest coded encounter, patients were deemed to have no identifiable usable ethnicity.
We report the inter-practice variability and geographic variation in ethnicity identification using this ethnicity classification method using descriptive statistics (mean and quartiles).
Rates of recording were assessed across both age and gender, allowing a determination of demographic trends in ethnicity recording within primary care. Further data extraction for demographic variable determines any inconsistencies in the ontological approach employed.
As a final assessment of the granularity of the extended coding hierarchies utilised, the ontologically derived codes were compared against the national code list recommended for primary care in the QOF,21 for a definitive determination of the extended data capture enabled utilising an ontological approach.
Data extraction was undertaken in SQL server management studio, with statistical analysis subsequently performed in the statistical software R.
RESULTS
Data was available for 2,059,453 patients across 110 practices in England and Wales, utilising the Read 2 classification.
Mean valid ethnicity recording was 48.97% (n =1,008,667) across the sample population. Of those identified with a valid ethnicity recording, 96.14% (n = 969,740) were recorded to have a definite code. 3.71% (n = 37,443) and 0.15% (n = 1,487) had possible and probable codes, respectively.
Just under 1% (0.97%) were noted to have multiple ethnicities recorded over time. Of those with multiple ethnicity codes, 35.26% had a clearly identifiable majority ethnic group recorded and were classified accordingly. Of those who had no clear determined majority ethnicity code recorded, 82.83% were classified according to a valid single most recent ethnicity code within the dataset. 0.11% of the population had an underterminable ethnicity coded and were thus excluded from the dataset. Of the patient population, 52.09% had no definitive ethnicity code mapped and were excluded from the analysis. Figure 2 describes the logical data model used for ethnicity classification.
The median ethnicity identification rate across the dataset was 55.20% (inter quartile range: 35.6%). Considerable variations were noted between practices, with minimum and maximum ethnicity identification rates being 1.5% and 91.6%, respectively (Figure 3). Six practices were seen to have ethnicity identification proportions greater than 80%, two of which had a greater than 90% recording.Ten practices had less than 10% of the patient population coded with a recognisable ethnicity identifier.

Geographical variations exist within the dataset. Ethnicity identification was greatest in London-based practices (n = 30), mean 58.59%, with the identification lowest in those practices based in the South of the country (n = 25), mean 39.14%. Ethnicity identification was highest in practices with the highest proportions of non-white people; a 0.16% increase in the total ethnicity identified per percent increase in the proportion of non-white people. However, the correlation was poor (R2= 0.016).
Ethnicity identification was highest in children aged between 5 and 9 years (n = 64,432/99,232, 64.93%). In the adult population, ethnicity recording was consistent between age bands, with higher recording levels in young adults, 54.67% (n = 97,587/178,493) for 25–29 years and 53.53% (n = 106,335/198,654) for 30–34 years. For those greater than 40 years, ethnicity recording was 46.51% (n = 463,203/996,013), and for those greater than 65 years, this was 46.33% (n =175,286/378,323). Ethnicity recording in females was greater than that observed in males, 50.81% (n = 537,293/1,057,559) and 47.05% (n = 471,374/1,001,874) respectively.
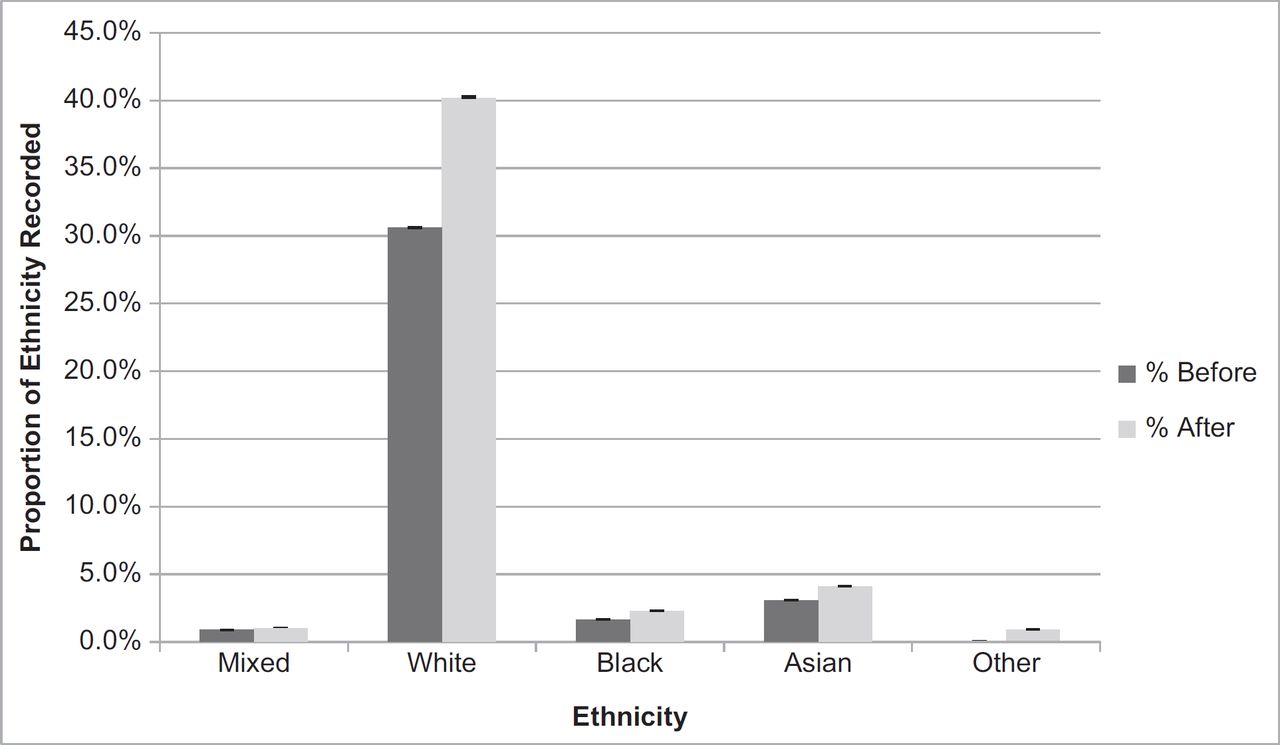
The QOF highlights the use of the ‘9i…’ coding hierarchy for ethnicity within primary care datases. Utilising iterated proxy markers for ethnicity, inclusive of language spoken and read, and requirement for an interpreter, identification was increased across each respective ethnic group (Figure 4), compared to using the QOF codes. Across the whole database, the detection of white ethnicity increased from 30.61% (CI:30.55%–30.67%) to 40.24% (CI:40.17%–40.30%); for black, from 1.65% (CI:1.63%–1.67%) to 2.29% (CI:2.27%–2.32%); for Asian, from 3.08% (CI:3.06%–3.11%) to 4.11% (CI:4.08%–4.14%); for those of a mixed ethnicity, from 0.89% (CI:0.88%–0.90%) to 1.01% (CI: 0.99%–1.02%); and those from other ethnic groups from 0.04% (CI:0.03%–0.04%) to 0.92% (0.91%–0.93%).
Discussion
Main findings of this study
Utilising an ontological approach, we have created updated method for mapping ethnicity related codes to the 2011 Office for National Statistics (ONS) Census major ethnicity categories. This mapping allows the use of iterated Read codes, which do not directly infer an ethnicity to act as proxy markers and substantially improved ethnicity identification in the tested primary care dataset.
In providing an update to the paper by Kumarapeli et al,20 our study demonstrates that utilising iterated proxy markers of ethnicity improved the identification of ethnicity recording within primary care CMR systems (46.85% to 55.20%). Using limited coding hierarchies can result in an underrepresentation of individuals with ethnicity recorded within the dataset. In comparison with the QOF-endorsed ‘9i…’ hierarchy, the ontology-based method developed in this paper has resulted in increased ethnicity identification across all major ONS ethnic groups (Figure 4). Utilising an algorithmic approach in those that have conflicting ethnicity codes, a further 0.87% (n = 17,817) were mapped to one of the ONS defined ethnic groups, allowing for clear identification and classification of these individuals.
There is considerable inter-practice variability in ethnicity recording, with higher mean ethnicity recordings within London-based practices (58.59%). Practices with a higher proportion of minority ethnicities had higher ethnicity coding rates. This suggests that a greater ethnic diversity amongst registered patients at these practices results in a greater tendency for clinicians to code ethnicity; the correlationwas, however, poor.
What is already known on this topic
The recording of ethnicity utilising traditional coding hierarchies within primary care datasets is known to be sub-optimal. This has resulted in restrictions in the use of ethnicity in monitoring disease presentation, prevalence, pattern, and management amongst differing ethnic sub-groups.22 Incentivisation of coding ethnicity through the QOF from 2006 to 2007 has resulted in significant improvements in the completeness of ethnicity data within primary care, but this financial incentivisation has been removed from the business rules as of 2011/2012. The existence of multiple ethnicity coding hierarchies, with no clear inter-relationships or inferences, has resulted in inconsistencies in recording ethnicity within primary care datasets.
What this study adds
This paper provides an updated method to ethnicity identification from records within a large primary care dataset. This study is the first to utilise an ontological approach to maximise data capture for ethnicity in primary care data. Utilising iterated proxy markers, ethnicity recording was seen to increase across all ONS defined ethnic groups. Published literature has focused on two traditional coding hierarchies ‘9i…’ and ‘9S…’ codes.3,20 The use of these limited codes can result in poor capture of ethnicity data,5 further propagating its underutilisation in analysing trends in healthcare outcomes amongst differing ethnic groups. The use of limited coding hierarchies poorly reflect the numerous variables that infer a patients ethnicity; multiple inferences affords greater flexibility in determining an individual’s ethnicity.5 The use of a mapping structure allowed identification of codes which definitively infer an ethnicity, expanding on previous ethnicity codes utilised. The process of iteration of non-directly mapped codes justifies the use of proxy markers.
Since defining this ontological process we have since applied the method to ethnicity identification in a population with diabetes.23 In this group the data quality was sufficiently higher and ethnicity identification using the ontological process set out here was 82.1%. Accurate ethnicity identification from real world data is of particular importance in this group given the high diabetes prevalence in those of Asian and black ethnicities.24
This paper provides a clear ontology for classification of those patients with conflicting ethnicity codes within the dataset. Similar to previous studies, we use the most commonly recorded ethnicity group as means of classification into an ethnic group,3 preferentially using those codes which directly infer an ethnicity, followed by the proxy codes. Further, in those patients with no clear majority, the use of the latest recorded ethnicity provides a mechanism with which ethnicity can be classified.
Limitations of this study
This paper was unable to establish the underlying reasons as to why individuals within the dataset did not have a recognisable ethnicity recorded. The authors are aware that those without an ethnicity recorded may be an important negative, as a result of underutilisation of healthcare services or difficulties in communication.
Due to the nature of our dataset, there is a reliance on the accuracy of coding. In those patients with multiple differing ethnicity codes, inferences were made in regard to ethnicity (based on most common or latest code), which run the risk of misclassification. The use of an algorithmic approach for these patients, who represent a small proportion of our dataset, minimises the risk of this misclassification.
As the UK coding system for primary care uses the Read classification, CTv3 and SNOMED-CT coding hierarchies could not be utilised in the logical data extract model. Extraction in the coding layer demonstrates that these coding hierarchies exist, and inclusion within both the ontological and coding layers means that this ontology remains viable on the introduction of these codes.
Conclusion
An ontological approach to ethnicity codes allows for more accurate and extensive identification of ethnicity of people, and hence, we obtained a substantially higher proportion of ethnicities.
Widespread inter-practice variations in ethnicity coding still persist; with the removal of incentives from the QOF frameworks in 2011/2012, these disparities may widen. We encourage clinicians and healthcare researchers to actively code ethnicity within encounters.