Article Text

Statistics from Altmetric.com
The difficulty of drawing conclusions without a control population
Burke et al.1 draw conclusions about the impact of using a computerised medical record (CMR) system. However, we recommend exercising caution about the 5-year finding as there was no comparator group. There is therefore no means of establishing what would have happened to glycated haemoglobin (HbA1c) in patients in this group. We feel, however, that their 6-month conclusion is sound and that there may be important lessons about the possible detrimental impact of implementing a CMR system.
Decline in pancreas β-cell function may account for why diabetes control deteriorates over time
There are other elements that may have contributed to glycaemic control in these patients. β-cells are cells in the pancreas that produce the insulin required to control blood glucose. We know that β-cells function declines over time. In addition, the tissues of body become resistant to one of the primary actions of insulin – to facilitate the transport of glucose into cells from the bloodstream. The combination of declining β-cell function and insulin resistance leads to an inexorable decline in glycaemic control and a rise in blood glucose over time.
The decline in β-cell function in Type 2 diabetes starts a decade or more before diagnosis and continues throughout the course of the disease itself. Homeostasis model assessment has been used to quantify the decline in β-cell function. The U.K. Prospective Diabetes Study (UKPDS) demonstrated that β-cell function continued to deteriorate in association with progressively increasing hyperglycaemia despite treatment with glucose lowering agents.2
Attempts to quantify β-cell failure include the work of Wallace and Matthews,3 who demonstrated HbA1c changes with time (Figure 1, reproduction from Wallace and Matthews). In UKPDS, the mean, the rate of change reported with one of the commonest used glucose lowering medication (glibenclamide), was 0.5% HbA1%/year (they more precisely termed this coefficient of decline in β-cell function).3
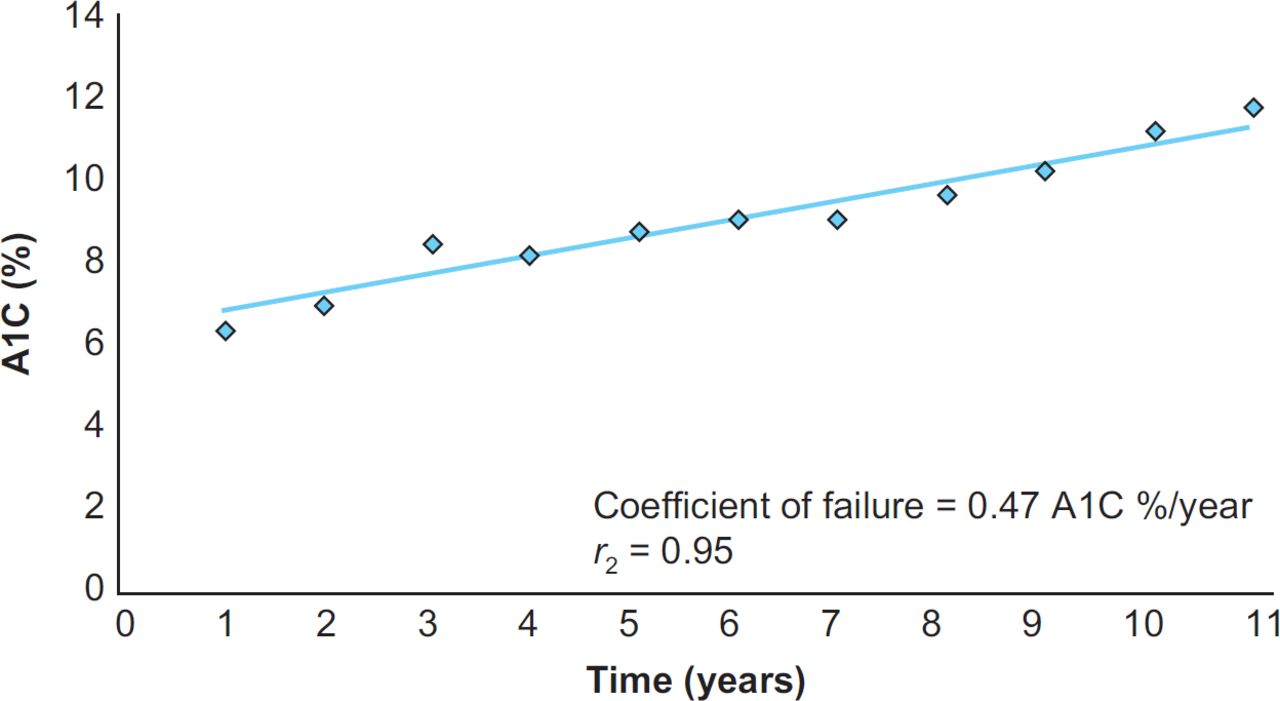
Over 5 years, the overall change in mean HbA1c reported by the authors of the current study was around 0.12%. This would appear to be much lower than the rate of decline observed in Wallace and Matthew’s work3.
Comparing the overall change in HbA1c with the rate of change in the royal college of general practitioners research and surveillance centre database
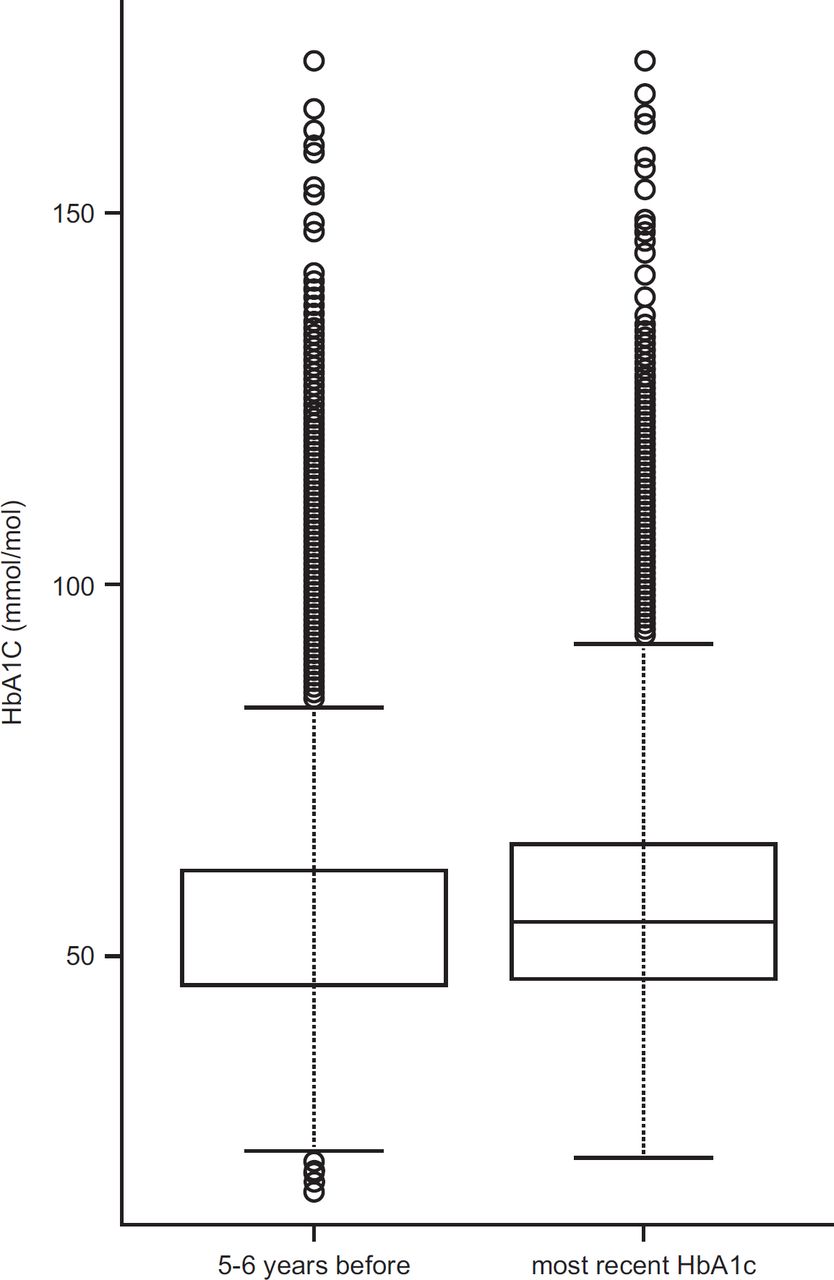
To test whether this was a reasonable change in HbA1c, we explored the Royal College of General Practitioners (RCGP) Research and Surveillance Centre (RSC) database (www.rcpg.org.uk).4 We identified 28,126 people with Type 2 diabetes. Over a 5-year period, we found that the mean change in HbA1c (2010 to 2015) was from 7.3% to 7.5% and the median change was 7.0% to 7.2% (Table 1 and Figure 2). A Wilcoxon signed rank test with continuity correction shows the difference to be highly significant (p<0.001). Given the confidence intervals in both sets of data, we see no evidence in difference in rate of change between this USA-based military- based population and the U.K. primary care population. However, further research would be required to be certain that there were no differences.

Summary – The process of adoption of a computerised record system may be associated with a temporary decline in quality of care
The process of implementation of CMR may well have been associated with a dip in the quality of care of people with diabetes. This difference is reported in this paper at all levels of glycaemic control. Among the primary care informatics community, there is a lack of consensus about how to get CMR system implementation right, in a way that there is not about other core areas of informatics theory.5
Our conclusion is that the importance of this paper is primarily in flagging the ‘blip’, the deterioration in control that appears to occur after the implementation of a CMR system. New implementation strategies could be tested against this benchmark.