Article Text

Abstract
Background Modelling is an important part of information science. Models are abstractions of reality. We use models in the following contexts: (1) to describe the data and information flows in clinical practice to information scientists, (2) to compare health systems and care pathways, (3) to understand how clinical cases are recorded in record systems and (4) to model health care business models.
Asthma is an important condition associated with a substantial mortality and morbidity. However, there are difficulties in determining who has the condition, making both its incidence and prevalence uncertain.
Objective To demonstrate an approach for modelling complexity in health using asthma prevalence and incidence as an exemplar.
Method The four steps in our process are:
Drawing a rich picture, following Checkland’s soft systems methodology;
Constructing data flow diagrams (DFDs);
Creating Unified Modelling Language (UML) use case diagrams to describe the interaction of the key actors with the system;
Activity diagrams, either UML activity diagram or business process modelling notation diagram.
Results Our rich picture flagged the complexity of factors that might impact on asthma diagnosis. There was consensus that the principle issue was that there were undiagnosed and misdiagnosed cases as well as correctly diagnosed. Genetic predisposition to atopy; exposure to environmental triggers; impact of respiratory health on earnings or ability to attend education or participate in sport, charities, pressure groups and the pharmaceutical industry all increased the likelihood of a diagnosis of asthma. Stigma and some factors within the health system diminished the likelihood of a diagnosis. The DFDs and other elements focused on better case finding.
Conclusions This approach flagged the factors that might impact on the reported prevalence or incidence of asthma. The models suggested that applying selection criteria may improve the specificity of new or confirmed diagnosis.
- health information exchange
- informatics
- information systems
- interdisciplinary communication
- systems analysis
Commons license http://creativecommons.org/licenses/by/4.0/
Statistics from Altmetric.com
- health information exchange
- informatics
- information systems
- interdisciplinary communication
- systems analysis
Introduction
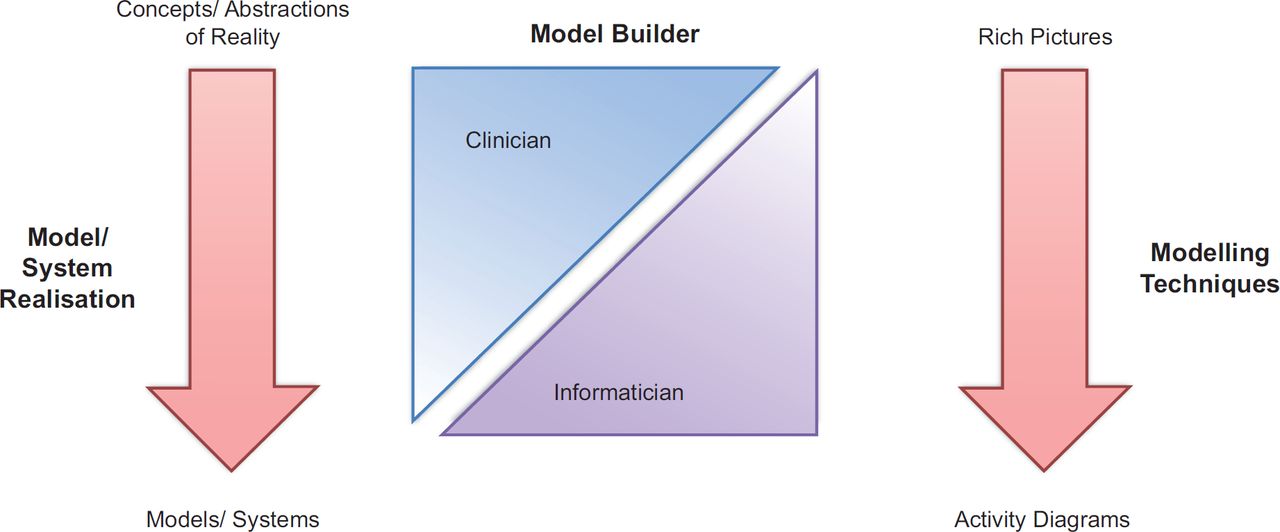
Models allow abstraction of real-world phenomena based on our information needs.1 The nature of the abstracted reality largely depends on who builds the model and which technique is used. Abstraction is necessary to elucidate key issues an otherwise complex and fuzzy reality. Increasingly, the health care sector uses and relys on information technology. As new computerised systems are developed to aid clinicians, there is a tendency for difficulties to arise in the interface between clinicians and information scientists. Modelling is a potential technique to reduce such problems. Currently, we use modelling in several ways: (1) to describe the data and information flows in clinical practice to information scientists, so that we can make better use of information technology in health care,2 and (2) to create generic models to enable comparisons between different health systems.3 This is particularly useful when there are differences between the design of the health system, how a patient interacts with it, and how such data are recorded and fee structures are different. We also use modelling to understand how clinical cases are recorded in record systems and to model health care business processes.4–6
Asthma is an important condition affecting around 1.5 million people in Europe a fifth of whom may have severe asthma.7 The global burden may be as much as 300 million, though the precise prevalence is hard to define because of the lack of a precise objective test to diagnose the condition and differences in methods of classification.8 However, alongside extensive concerns that detection and management are inadequate, others are concerns there may be overdiagnosis.9
We carried out this study to demonstrate the applicability of our accessible approach to modelling to how we might determine the incidence and prevalence of asthma in the English population.
Method
Introduction
Our approach is called Accessible Modelling of Complexity in Health (AMoCH). This method enables modelling to be conducted from multiple perspectives and involves a wider range of stakeholders. Its goal is to generate deeper insights into the complexity of real-world scenarios. This is particularly important when elucidating the technical requirements that will lead to specifying and building health IT, or creating datasets that will eventually be used in health care. The overall design of the methodology is multi-layered (Figure 1) to facilitate engagement of the diverse range of stakeholders.
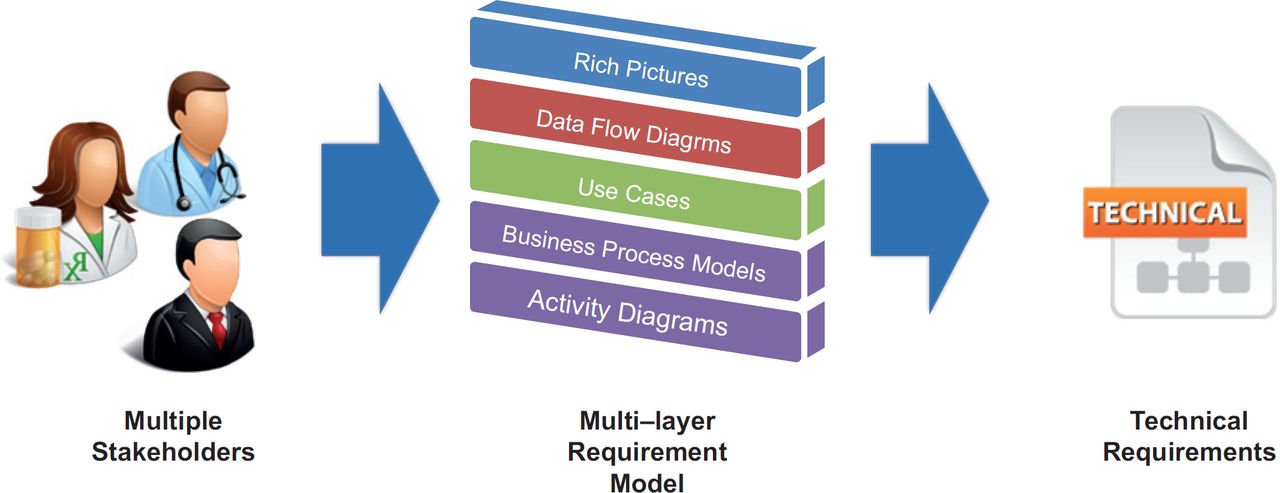
The process of building the multi-layered model begins by creating a ‘rich picture’ followed by a ‘data flow diagram (DFD)’. This is then followed by a ‘use case diagram’, a ‘business process model’ and finally ‘activity diagrams’ (Figure 2). The emphasis is on the ‘accessibility’ of the process to a wider range of stakeholders. Techniques can be selected based on stakeholder technical competence. We provide alternative techniques where needed. For example, when use cases are developed, we provide an option of developing graphical use case models or a narrative equivalent (or both) based on the preference and capability of the stakeholder.
System thinking and rich pictures
Health care has been described as a complex adaptive system within which information technology has an important role to play.10 ‘System thinking’ approaches such as the soft systems methodology (SSM) provide an appropriate approach to modelling health care because they lend themselves to the complexity seen in health care.11 SSM readily incorporates the complexities of the socio-technical nature of health care per se,12 as well as with technology.13 SSM is a holistic approach to system development and requires the combined effort of experts from different domains. At this stage, the artefacts developed are less technical in nature. However, as we progress along the modelling process, the informaticians involved will increase their contribution by increasing the technical complexity of the artefacts produced (Figure 1).
Rich pictures facilitate exploration of the dynamics within a particular system scope. This technique of modelling a broader view of a situation was initially introduced by Peter Checkland as a part of SSM. Rich pictures are used to encourage ‘system thinking’: the process of understanding how systems influence one another within a larger system. This is pertinent given the complexities of the present information ecosystem in health care.14 The key characteristic of this method is that there are no formal rules for drawing these pictures. This offers maximum flexibility to the modeller to describe the context and issues surrounding the model. When considering complex systems, the rich picture may be developed by interviewing people who operate in different parts of the system. Rich pictures also allow collaborative experts from diverse domains to work together on a common model. The key function of a rich picture is to capture the issues.
The development of rich pictures (and use cases) was carried out by informaticians, health care professional and others involved in primary health care. They collectively had a thorough understanding of operationalising health care services and policies that are governing the system.
Data flow diagram
A DFD uses graphical notations to demonstrate the main data flows within a system.15 This technique is used to understand the data flows, data stores and associated processes within a system. The graphical notations used for DFDs are easy to comprehend for those with limited technical competences. This is particularly important to validate critical data flows within the system by interviewing the system users and operators. The data flows can be cascaded into multiple levels in order to manage the complexity. Individual nodes of high-level diagrams can be elaborated into detailed diagrams to capture specific details of the data flow.
Unified Modelling Language use case diagram
A use case describes a way in which real-world actors interacts with the system. The most difficult aspect of developing a system is the precise conceptualisation and specification of the system to be built. We use a notation specified in the Unified Modelling Language (UML).16 UML use case diagrams are useful to formulate a blueprint to understand the system requirements, particularly when the domain information is acquired through multidisciplinary teams having varying levels of technical aptitudes. We are also able to nest use cases at several levels to decompose large complex systems. A typical use case comprises actors (entities that interact with the system for the purpose of completing events), functional requirements (intended behaviours of the system) and goals (activities and variants involved in attaining the goal).
Narrative use cases
Narrative use cases can be used to complement or enrich UML use case diagrams. While this is not a standard artefact provided in UML, this has proven to be effective when capturing requirements from health professionals or extracting requirements from the literature.
Activity diagrams and business process models
Following the UML methodology, we are able to describe each use case in a more detailed level using the UML activity diagram that highlights the sequence of activities performed and messages exchanged by different actors as well as triggering conditions of a set of activities within a specific part of the model. The diagram allows embedding a procedural flow of actions within a larger activity/process. The activity diagrams can also be used to model logical functionality of business processes that execute within the system (Figure 8).

Business process models are graphical representations of business oriented processes within an organisation. This is helpful to model collaborations and business transactions within health systems.3 Business processes are typically modelled using the Business Process Modelling Notation (BPMN). BPMN depicts the end-to-end flow of a business process. The notation has been specifically designed to coordinate the sequence of processes and the messages that flow between different process participants in a related set of business activities.17
Results
Overview
A large number of factors were identified that might impact on the diagnosis of asthma; these are illustrated on the first rich picture (Figure 3). After some discussion, there was consensus that factors are best classified into those that mainly impact on increased or decreased diagnosis (Figure 4). We next developed a high-level DFD of how databases of routine health data might be used to identify the case of asthma (Figure 5) in the context of the English National Health Service (NHS). The UML use case diagram (Figure 6) depicts the actors involved in asthma diagnosis (case identification). The business process model is based on guidance provided for asthma diagnosis (Figure 6). Finally, the activity diagram demonstrated the patient perspective of their involvement in asthma management, which may not include questioning their diagnosis (Figure 7).


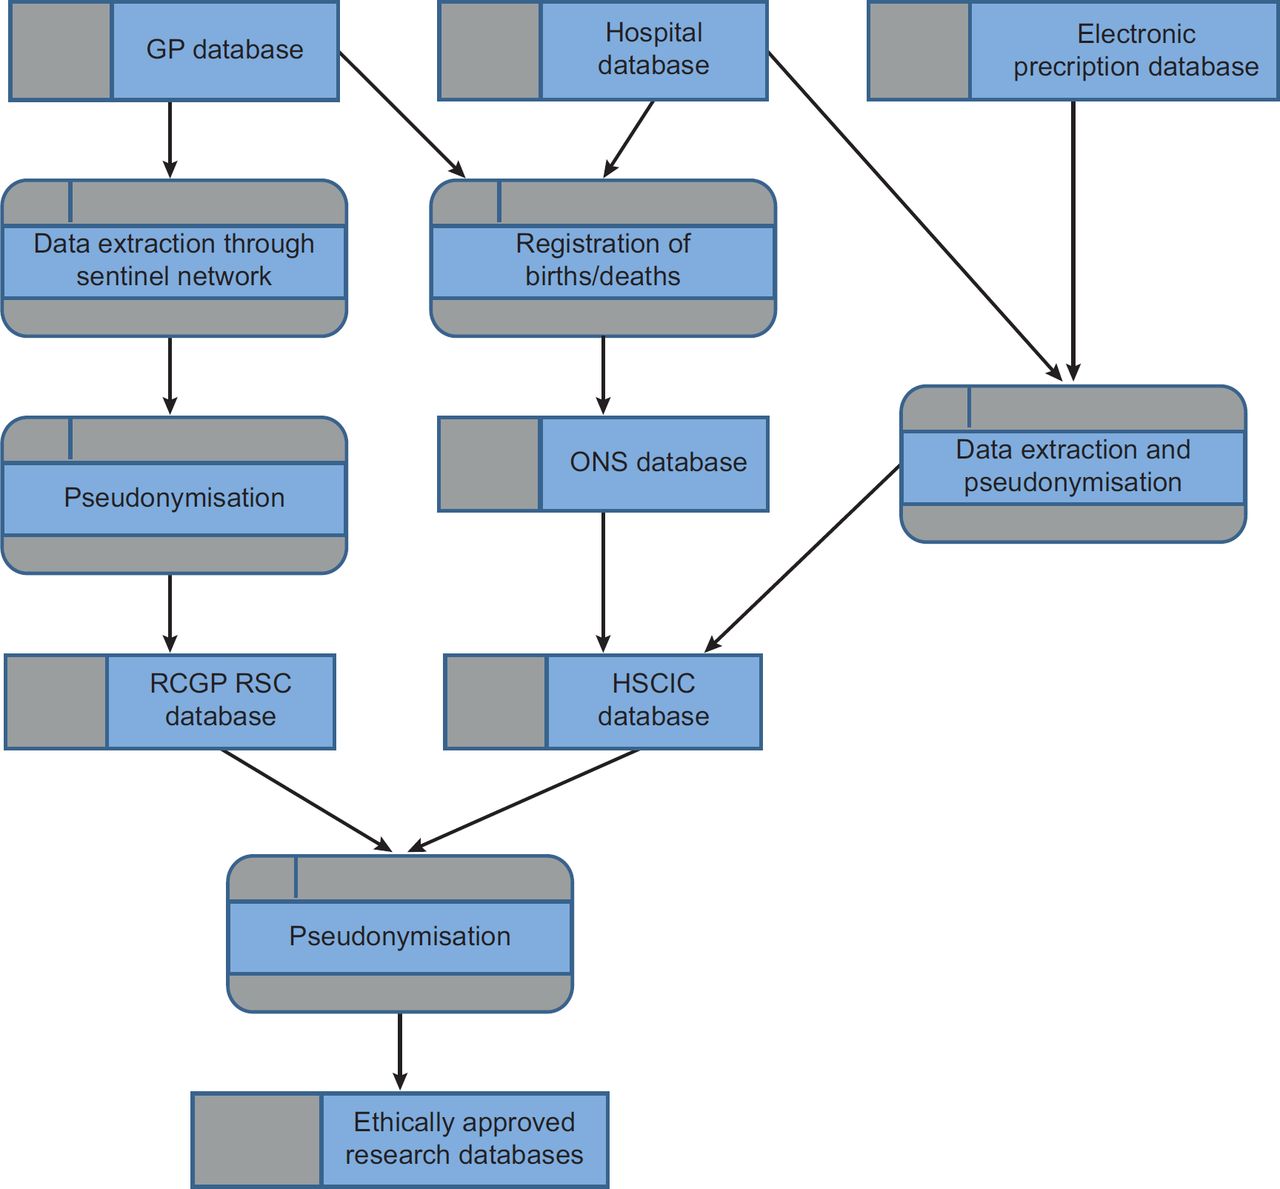
RCGP RSC – Royal College of General Practitioners Research and Surveillance Centre
HSCIC – an English National Health Data Repository of Hospital and other health data
ONS – provides details of cause of death from death certificates

Rich picture
A long debate took place about the factors that contribute to the identification of a case of asthma. In particular, we discussed how it may not be clear at the time when a person (particularly a child of an age where respiratory test are not feasible) presents with a night and morning cough, with or without wheeze if this is asthma or not. There are many factors: genetic and familial, environmental and educational, from charities and pressure groups, the pharmaceutical industry and government and from within health care, which impact on changing perceptions of asthma and its diagnosis. In a second rich picture, these were grouped into those that the authors felt predominantly increased asthma diagnosis and those that decreased rates of diagnosis. Though some of these, particularly health service guidance, may increase as well as decrease diagnosis.
Data flow diagram and use case diagrams
The DFD provided insight into how asthma cases might be identified from routine data in the English NHS. The Royal College of General Practitioners Research and Surveillance Centre (RCGP RSC) network of practices has its primary care data linked to hospital data, held by the Health and Social Care Information Centre (HSCIC) with data about deaths coming from the Office for National Statistics (ONS). From these data, it should be possible to assess levels of diagnosed asthma. Pseudonymisation processes reduce the risk of breaching individual privacy.
The use case diagram illustrates some of the actors involved in making a diagnosis of asthma. Much of the interaction, other than objective change in lung function measured by a technician or pneumologist, is likely to be completely objective. Diagnosis often relies on history and clinical judgement.
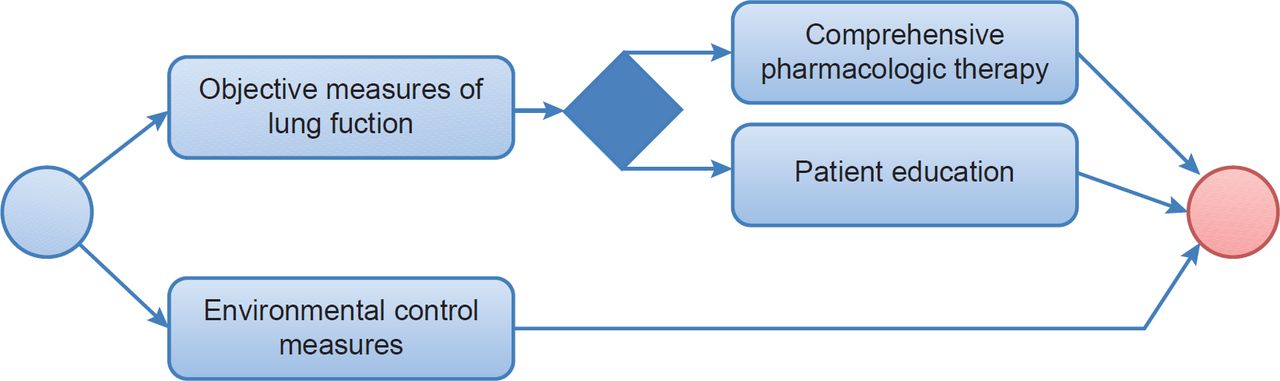
Business process model and activity diagram
The BPM sets out how the only route to completely objective diagnosis is through lung function testing, particularly variation in peak flow. The activity diagram illustrates how the patient may be involved in managing their treatment and be oblivious of the possibility of misdiagnosis.
Discussion
Principal findings
This approach allows multiple stakeholders to participate in a modelling process that provided insights into a complex issue. The methodology was used to build a multi-layer requirement model required to capture the complexities of real-world socio-technical systems. The multiple perspectives supported in the modelling approach provide opportunities for increased engagement of a diverse group of experts, resulting in the construction of models, which could be used to develop methods to identify asthma cases.
Strengths and weaknesses
The strength of this process is that it enabled complex situations to be described rapidly and shared; its weakness is that the perspectives are not purposively sampled and there may be bias or a lack of sufficient range of stakeholders. Others have chosen to use other methods for modelling system complexity using visual and other representations.18 Further research is needed to test the reliability and validity of this approach. We intend to further develop this method within the Models of Child Health Appraised (MOCHA) research project19, which is conducting a European-wide assessment of child health service models.
Conclusions
AMoCH provides a straightforward approach to modelling complexity. It moves from free-form representations (rich pictures) to exploring where relevant data comes from (data flows) and to how key stakeholders interact with the system (use cases) and finishes looking at activity flows, sequence over time and business models. This approach to modelling has provided some insights into the challenges around defining a case of asthma within routine data and what data to start exploring and in what way.
Acknowledgments
This collaborative work as part of the Horizon 2020 MOCHA project19 and this group has come together to share expertise to produce high-level models that will help a common classification of case-based comparisons of child health care.