Article Text

Abstract
Background Clinical information systems in the National Health Service do not need to conform to any explicit usability requirements. Poor usability can increase the mental workload experienced by clinicians and cause fatigue, increase error rates and impact the overall patient safety. Mental workload can be used as a measure of usability.
Objective To assess the subjective cognitive workload experienced by general practitioners (GPs) with their systems. To raise awareness of the importance of usability in system design among users, designers, developers and policymakers.
Methods We used a modified version of the NASA Task Load Index, adapted for web. We developed a set of common clinical scenarios and computer tasks on an online survey. We emailed the study link to 199 clinical commissioning groups and 1,646 GP practices in England.
Results Sixty-seven responders completed the survey. The respondents had spent an average of 17 years in general practice, had experience of using a mean of 1.5 GP computer systems and had used their current system for a mean time of 6.7 years. The mental workload score was not different among systems. There were significant differences among the task scores, but these differences were not specific to particular systems. The overall score and task scores were related to the length of experience with their present system.
Conclusion Four tasks imposed a higher mental workload on GPs: ‘repeat prescribing’, ‘find episode’, ‘drug management’ and ‘overview records’. Further usability studies on GP systems should focus on these tasks. Users, policymakers, designers and developers should remain aware of the importance of usability in system design.
What does this study add?
Current GP systems in England do not need to conform to explicit usability requirements. Poor usability can increase the mental workload of clinicians and lead to errors.
Some clinical computer tasks incur more cognitive workload than others and should be considered carefully during the design of a system.
GPs did not report overall very high levels of subjective cognitive workload when undertaking common clinical tasks with their systems.
Further usability studies on GP systems should focus on the tasks incurring higher cognitive workload.
Users, policymakers, and designers and developers should remain aware of the importance of usability in system design.
- cognitive science
- computerized medical record systems
- general practice
- human engineering
- medical informatics
- primary health care
- user–computer interface
Commons license http://creativecommons.org/licenses/by/4.0/
Statistics from Altmetric.com
- cognitive science
- computerized medical record systems
- general practice
- human engineering
- medical informatics
- primary health care
- user–computer interface
Introduction
Modern computer information systems have a proven record in supporting information management tasks in healthcare.1,2 However, clinical information systems lacking usable designs may increase the mental workload imposed on their users and negatively impact on patient safety.3–5 Today, with the nearly universal computerization of general practice in the UK,6 general practitioners (GPs) are faced with the challenge of working with computer systems that could be potentially adding to their cognitive workload.7
GP Systems of Choice (GPSoC) in England (Table 1) do not have to conform to any specified usability requirements, although there have been initiatives to promote usability supported by the National Health Service (NHS), including the Microsoft Health Common User Interface.8 Usability has been defined as ‘the capacity of a system to allow users to carry out their tasks safely, effectively, efficiently and enjoyably’.9 It largely relates to the quality of the information design and system navigability, and has a lot to do with user interfaces.10,11 Usability is a very important aspect in system design12 and may impact user satisfaction, user fatigue, clinical productivity, error rates, and overall patient safety.
Clinical care is a complex and mentally demanding activity. It usually involves multitasking, where communication skills13 are combined with pattern recognition, clinical reasoning and problem solving skills.14 In primary care, the high levels of uncertainty,15 the variety of clinical presentations seen16 and need to deal with vast amounts of information routinely received from other care settings17 add to this complexity. All of these contribute to the mental workload experienced in general practice.18
Mental workload has been defined as the mental effort involved in performing any given task.19 Excessive simultaneous tasks or very demanding individual tasks may cause cognitive overload.20 In healthcare, multitasking may lead to errors.21 Information systems should help users complete tasks with ease. Their user interfaces should be carefully designed to ensure that the way information is displayed does not negatively affect the cognitive workload experienced by healthcare professionals.22 Improved user interfaces should reduce medical errors and improve patient care.23
Scottish GPs have expressed reservations about the usability of their computer systems.24 Usability issues in healthcare have been noted elsewhere. Examples cited are fixed sequences of steps and tasks, poorly supported documentation and retrieval of information,25 problems relating to the efficiency of use, intuitiveness, and poor fit for multiprofessional needs,26 and poor integration into workflow.27 In healthcare information technology, the main challenge today appears to lie on the design of convenient, efficient and acceptable interfaces.28 Failure of many clinical information systems has been attributed to the lack of human-centered design approaches.29,30 Problems with usability have been linked to patient safety elsewhere.31–33 In the UK, poor usability has also been identified as a safety issue.34,35
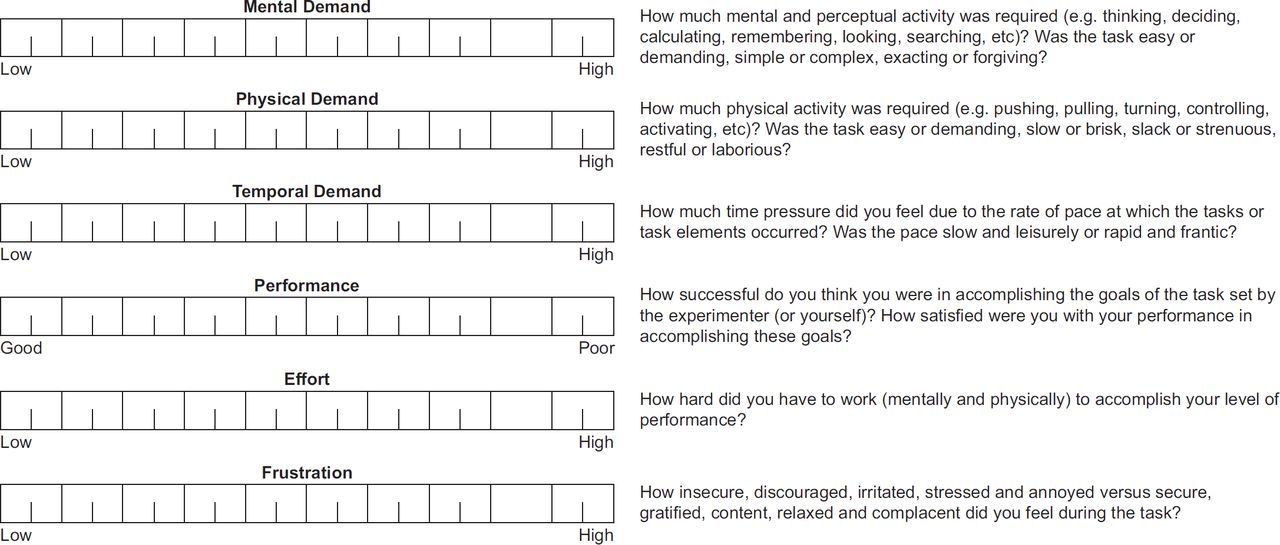
Guidelines for the evaluation of the usability of electronic record systems in primary care exist.36 Among several existing validated subjective mental workload tools,37 NASA-TLX38 has been commonly used in health care. This is a multidimensional scale consisting of two parts: 1) six 20-point visual analogue sub-scales that measure contributing factors to the overall cognitive load (measures of workload): mental demand, physical demand, temporal demand, performance, effort and frustration; and 2) a set of pairings combining the different factors to be rated according to relevance, in order to weight the subjective importance given to the difference factors (sources of workload). This has been used in a variety of health information and communication technology evaluations such as nursing intensive care,39 anesthetic work,19 surgical training and surgery,40,41 and electronic white boards.42
This study looks to identify where potential usability issues with current existing GP systems in the NHS in England may exist, by exploring the subjective cognitive workload experienced by GPs when they carry out common clinical tasks with their computer systems. The study hopes to raise awareness of the influence of usability on safety among system users, developers and policy makers.
Methods
The study presented participants with 10 stories each describing a clinical scenario with a related computer task. GPs rated the subjective mental workload experienced with their system for that task, using the tool described below.
Setting
The study was carried out in the primary care setting in England.
Population
Eligible participants were GPs who at the time of the study: 1) were working or had worked within the past 6 months, for the NHS or the Ministry of Defence in England and 2) were using or had used one or more of the currently existing GP systems in a paperless or paper-light practice/setting. Participation in the study was voluntary. Data were anonymously collected through an online survey.
Materials
NASA Task Load Index (NASA-TLX)43,44 is a tool designed to undertake subjective workload assessments and is free to use. We used a modified version (known as Raw TLX38), consisting of six 20-point visual analog sub-scales that measure six contributing factors to the overall cognitive load (measures of workload): mental demand, physical demand, temporal demand, performance, effort and frustration (Figure 1). For this study, we dropped off the physical demand scale that we judged irrelevant.
We transformed the tool for a web-based form using Google Forms. The survey contained instructions for the study, demographic questions, clinical scenarios and tasks requested and rating scales with descriptions of the measure. It also included a space for free comments after each task (Figure 2).

In order to enable participants to complete the study at a time of their convenience, we presented them with a set of common clinical scenarios and tasks and asked them to recall (rather than perform) how they use their systems to complete these tasks. This approach ensured that time involvement was minimized and prevented interference with work.
We collected a number of demographic variables (time in general practice, time using the system and the number of systems used) in order to identify if any of these factors have an impact on cognitive load.
Measures
Each questionnaire returned 50 scores in total: five scores corresponding to five sub-scales ratings for each of the 10 tasks. We refer to the average of these 50 scores as the ‘survey score’. For each task, we computed a single average score, which we refer to as the ‘task score’. Scores are given in a scale 0–100. Additional measures were the number of years in general practice, the number of years the system had been used and the number of other systems used.
Selection, design and validation of clinical scenarios and tasks
We made a selection of tasks using Laerum and Faxvaag’s task list,45 with some additions judged to be relevant to GP clinical information systems. The tasks selected belong to the generic following activity groups: retrieving information, entering information, prescribing and managing prescriptions and dealing with laboratory results. Following Laerum and Faxvaag,45 we use ‘task’ here as a high-level description. Each task involves multiple actions, each of which contributes to the overall cognitive workload. These will involve the user interacting with the information system using keyboard and mouse (or equivalent) and making various decisions.
We adapted the clinical scenarios from real cases, taking into account the available data on the most frequent presenting complaint groups and most frequently prescribed drugs.46 We ensured the final validity of the scenarios by asking participants about the representatives of the cases during a pilot test. The final list of clinical scenarios and tasks is available in Table 2.
Survey design
An initial version of the survey was piloted by eight GPs. They confirmed the correct functioning of the online survey and appropriateness of the clinical scenarios. They made comments on the understanding of the scales and the scoring system, the clarity and level of detail of the clinical scenarios and the general design of the survey. The changes introduced resulted in a survey with 10 simplified clinical scenarios and three demographic questions for ‘time in general practice’, ‘time using the system’ and ‘number of systems used’.
Sampling method and participants’ recruitment
The target population included an estimated 40,000 GPs in England.47 Due to funding limitations, we used existing electronic communication channels to try reaching the largest number of GPs possible and maximize responses rates. During late May and June 2013, we submitted an electronic request to 199 clinical commissioning groups, who are responsible for organising the delivery of NHS services in England, requesting assistance with the survey distribution. We also emailed directly 1,646 GP practices with an invitation to participate in the study.
Methods of analysis
We used SPSS for the statistical analysis. We looked at the correlation between all 50 variables obtained for each questionnaire, followed by dimension reduction by factor analysis. We computed 12 additional scores: 10 task scores, an average score for all tasks (referred to as survey score), and a score for the number of additional systems used.
We obtained means with confidence intervals for the survey scores and the tasks scores. We looked for statistical differences between the tasks and the systems using ANOVA for repeated measures. We also looked at the influence of the variables, ‘time in general practice’, ‘time using system’, and ‘number of other systems used’.
Results
Sixty-seven respondents completed the online survey. A precise estimate of the responses rate was not possible because we did not know the number of GPs who received the invitation. However, a gross estimate could be between 0.5 and 1%, based on a possible number of GPs receiving the survey of 5,000–10,000.
The distribution of systems used by participants was 55.2% for all combined EMIS systems (25.4% LV, 10.4% PCS and 19.4% Web), 29.9% for SystmOne, 9.0% for INPS Vision, 3.0 % for iSoft Synergy, 1.5% for Microtest Evolution and 1.5% for other systems not in the GPSoC approved list. The mean time the system had been used was 6.7 years, the average time in general practice 17.8 years and the average number of other systems used 1.5 (Table 3).
According to a report from 2011,48 the market share of GP systems in England was 55% for EMIS, 19% for INPS Vision, 17% for TTP SytstmOne, 7% iSoft and 2% Microtest. More recent data suggested an EMIS market share of 54.8% and iSoft share of 5.6%;49 also, TTP SystmOne was set to become the second biggest supplier.50 Based on these details, we projected a possible current market distribution of the systems as follows: 54.8% for EMIS, 19.6% for TTP SytstmOne, 18% for INPS Vision, 5.6% iSoft and 2% Microtest. According to these figures, the system distribution of our sample was not significantly different from the population distribution, χ2 (4) = 7.64, p > 0.10.
Although we did not have population data on the average time for GPs in general practice, the average time the system had been used and the average number of other systems used, a qualitative study in Scotland investigating the views of GPs on their medical records (n = 25 GPs) reported an average time in general practice of 16.5 years,24 which is similar to the number found in our study.
We identified a potential problem with the ‘performance’ scale, which appeared to have been marked in the wrong direction in a number of cases. Some participants also indicated this in the free-text section. The NASA-TLX user guide document highlights a possible confusion with this scale. This has been reported in other studies.23 We carried out a correlation analysis that also showed a problem with the scale for performance. Therefore, we dropped out this scale for the analysis. Otherwise, this showed that all the scores were highly correlated.
A dimension reduction by factor analysis showed one factor accounting for around 67% of the variance, where all the scales where highly and equally correlated within the factor. Other studies have previously reported that scales are often significantly correlated with each other.38 Since all the scales and tasks correlated well, we created a single aggregated score with the average of all 40 remaining ratings (after dropping the performance scale). We also computed a total score for each task, from averaging the scores of the four scales.
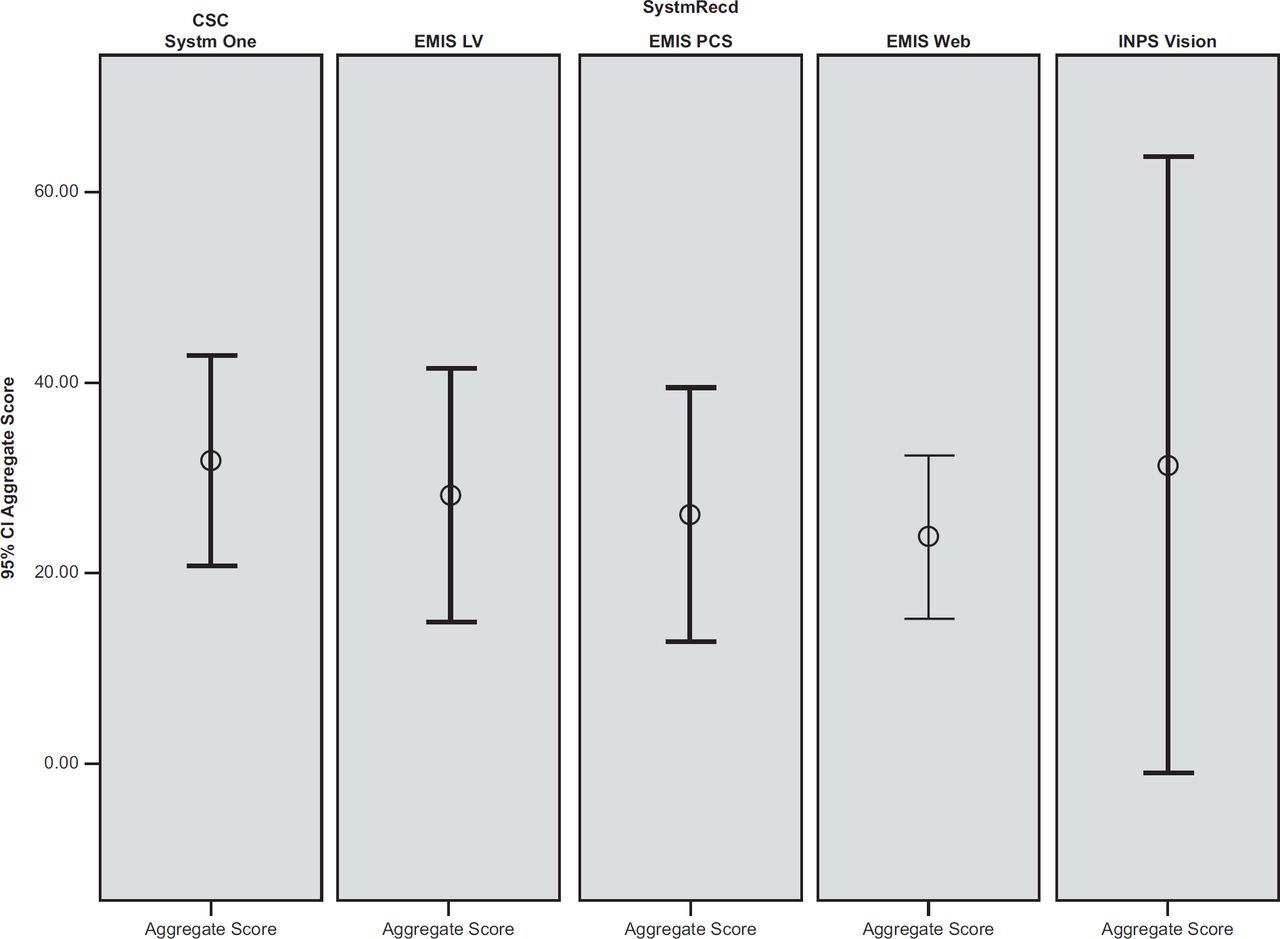
The overall cognitive workload score was 28.7 [23. 3–34.0, 95% confidence interval (CI)]. This score was not significantly different among systems (F (4, 58) = 0.3, p = 0.88) (Microtest and iSoft were excluded due to small numbers) (Figure 3).

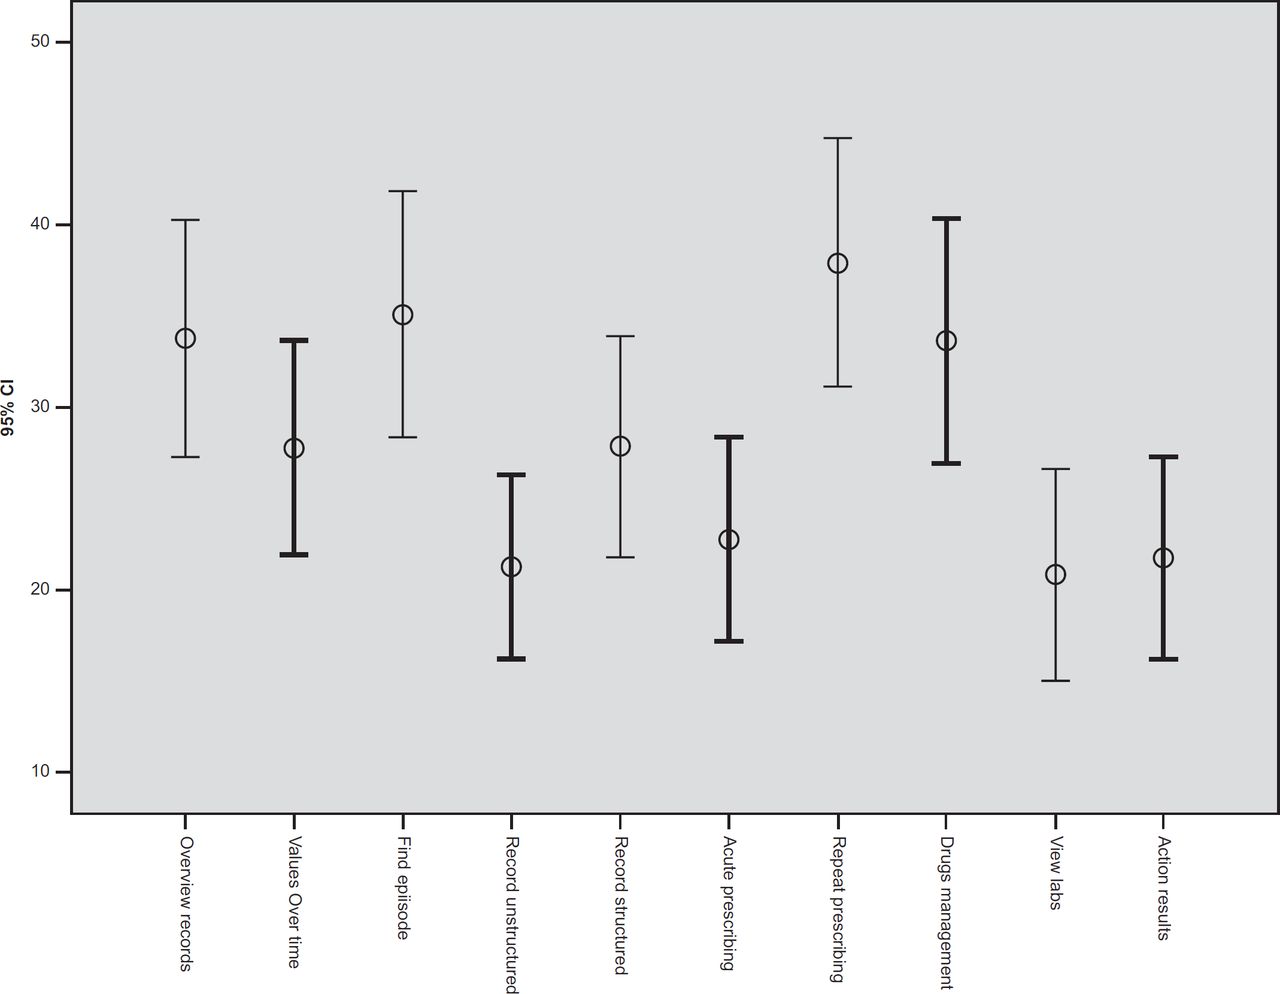
A repeated measures ANOVA of the total scores for each task revealed statistically significant differences between them (F (9, 58) = 6.1, p = 0.001). The data in Table 4 and the graph in Figure 4 show that the tasks ‘overview records’, ‘find episode’, ‘repeat prescribing’ and ‘drugs management’ scored significantly higher than the tasks ‘record unstructured’, ‘view labs’ and ‘action results’. The tasks ‘find episode’ and ‘repeat prescribing’ also scored significantly higher than the task ‘acute prescribing’. Finally, ‘the values over time’ and ‘the record structured’ did not score significantly different from any of the other tasks.
The tasks, however, were not significantly different among the different systems in a repeated measures ANOVA; test for interaction between system and task: (F (36, 189.1) = 0.7, p = 0.9). The difficulty of the tasks was not related to the time the GPs had been in general practice when that was included as a covariate in a repeated measures ANOVA (F (1, 55) = 0.3, p =0.58). The same was true of the number of other systems used (F (1, 55) = 0.03, p =0.87), but difficulty was related to the time the system had been used for (F (1, 55) = 5.4, p =0.024).
In summary, the overall aggregate workload score was not different among systems. There were significant differences among the task workload scores, but these differences were not seen among the different systems. The overall aggregate score and average task scores were not related to the time the GPs had been in general practice or the number of other systems used, but they were related to the time the system had been used.
Discussion
Interpretation of results
With the lack of consensus on what should be considered as a threshold for a high or excessive workload38 – the scores appear to be most useful when used to make comparisons, we looked at the scores in other studies;22,23,51 compared to these, the workload score found in this study (28.7) appears to sit on the low side, although lower scores have been noticed in some. This probably reflects the familiarity of GPs with their systems and could lead to conclude that no major issues exist.
The tasks evaluated were chosen to represent common tasks routinely carried out by GPs. Tasks with a higher cognitive workload score belonged to the categories ‘retrieving information’ (‘overview records’ and ‘find episode’) and ‘prescribing’ (‘repeat prescribing’ and ‘medications management’). The task ‘overview records’ is made of a number of subtasks, but its definition makes sense as a conceptually unique, identifiable task routinely carried out. However, it could be arguably expected that it would incur higher scores than single, smaller tasks. Likewise, the tasks ‘repeat prescribing’ and ‘drugs management’ are also composites of smaller subtasks and their higher scores may not come as a surprise either. Prescribing has been an area of high concern in medical errors, and mistakes have been related to the use of computer systems: selecting the wrong drug or dosage instructions from pick lists, overriding drug-drug interaction alerts, unnecessary/ inappropriate alerts, the need to maintain an accurate electronic health record and excessive expectations from the computer system.52 Finally, ‘find episode’ is a task whose difficulty may indeed be influenced, as many responders pointed out, by the quality and consistency of the recording of the previous episode.
The study did not find any differences on the cognitive workload among the different systems. However, it is likely that the study has been underpowered to detect these. This is discussed further in the following section.
Study limitations
In the study, we introduced a few modifications to NASA-TLX. First, we asked the GPs to recall instead of performing the tasks rather than using alternative methods directly assessing that performance. We considered this logistically necessary to prevent the study interfering with participants’ work and negatively impacting responses rates. A study in a nonclinical setting showed that little information is lost when the ratings are obtained retrospectively using a visual recreation of a task,53 and we found recall worked well in a separate clinical study.54 Our results should be interpreted in the context of other research that does directly assess performance.55, 56
Second, we dropped off the physical demand scale. Modifications involving adding or deleting sub-scales or redefining them have been used in several studies.38 The specific irrelevance of the physical demand scale when assessing electronic health records has been observed in other studies.23,54 We proposed that this modification should not have a significant impact on the validity of this study, but undertaking a validity assessment was not within the possibilities of this study.
Finally, we also removed the weighting part. This has been the most common modification made when using NASATLX, followed by averaging or adding the scores to compute an estimate of the overall workload (which has been referred to Raw TLX) or analyze sub-scales separately. Studies comparing TLX with Raw TLX have demonstrated the latter to be less, more or equally sensitive; both approaches, however, have demonstrated the diagnostic value of the sub-scales.38,57
Like in any survey study where participation is voluntary, this study was subject to a self-selection bias.58 Also, responses rates in survey studies with physicians are often very low,59 and electronic means are only of limited utility.60 The sample we obtained, however, did not appear to differ from the population on a number of variables we had available for comparison. Considering the means and standard deviations observed, sample sizes of around 100 responses per system could have been enough to detect potential existing differences among systems.
Conclusions and implications of the study
Since cognitive workload is only one among many measures of a system’s usability, no conclusions on the current GP system’s usability quality can be drawn from this study. Also, because of the lack of existence of an acceptable cognitive workload threshold for NASA-TLX in electronic health record evaluations, a sound statement on weather current system’s mental workload is acceptable is not possible. Nevertheless, two things can be inferred: first, on the whole, probably no major usability issues exist and second, for some tasks there is probably room for improvement.
The study has identified four GP systems tasks attracting a higher workload score: ‘repeat prescribing’, ‘drugs management’, ‘overview records’ and ‘find episode’. Further usability studies could focus further on these tasks, using existing guidance on usability evaluations in primary care.3,36
NHS policymakers should remain aware of the importance of usability in system design and might consider following steps in other countries to develop policies around usability requirements.36