Article Text

Abstract
Background Family medicine practices (FMPs) make the basis for the Croatian health care system. Use of electronic health record (EHR) software is mandatory and it plays an important role in running these practices, but important functional features still remain uneven and largely left to the will of the software developers.
Objective The objective of this study was to develop a novel and comprehensive model for functional evaluation of the EHR software in FMPs, based on current world standards, models and projects, as well as on actual user satisfaction and requirements.
Methods Based on previous theoretical and experimental research in this area, we made the initial framework model consisting of six basic categories as a base for online survey questionnaire. Family doctors assessed perceived software quality by using a five-point Likert-type scale. Using exploratory factor analysis and appropriate statistical methods over the collected data, the final optimal structure of the novel model was formed. Special attention was focused on the validity and quality of the novel model.
Results The online survey collected a total of 384 cases. The obtained results indicate both the quality of the assessed software and the quality in use of the novel model. The intense ergonomic orientation of the novel measurement model was particularly emphasised.
Conclusions The resulting novel model is multiple validated, comprehensive and universal. It could be used to assess the user-perceived quality of almost all forms of the ambulatory EHR software and therefore useful to all stakeholders in this area of the health care informatisation.
- electronic health records (EHRs)
- ergonomics
- family medicine practices (FMPs)
- quality evaluation
- user satisfaction
Commons license http://creativecommons.org/licenses/by/4.0/
Statistics from Altmetric.com
- electronic health records (EHRs)
- ergonomics
- family medicine practices (FMPs)
- quality evaluation
- user satisfaction
Introduction
Family medicine practices (FMPs) make the basis for the health care systems in numerous countries, including the Croatian health care system as well. Although in the literature in the field of health informatics we may usually find terms general practice and general practitioner, here we deliberately introduce terms FMP and family doctor (FD). Family medicine (FM) is the official name of this basic segment of the Croatian primary health care (PHC). FDs focus on meeting the needs of the entire family, they are uniquely trained to care for the whole person throughout his or her life, from birth to old age and often receive training outside of general medicine in the areas of pediatrics, obstetrics and gynecology and geriatrics.1 They solve most of the population’s health problems and collect an important amount of health data with the smallest facility cost. Electronic health record (EHR) software plays an important role in running these practices in the context of modern medicine. Croatian Health Insurance Fund (CHIF) forms the current certification criteria for the selection of the software support to Croatian FMPs since it is an executive and regulatory body of the Ministry of Health.2 Unfortunately, these certification criteria are still based solely on the necessary legislative or communication criteria and capabilities,3,4 while other important functional features of this type of software support remain uneven and largely left to the will of the software developers. According to the current criteria, the CHIF chose eight versions of EHR software that are presently used in Croatian FMPs. Today, worldwide we can find a few measurement models for assessing the quality of the EHR systems. Particularly prominent are American certification programs5,6 and European framework model for certification and quality assessment of the EHR systems.7 However, due to the fact that this area is extremely fast changing, a need for creating a novel model for evaluation of the quality of EHR software used in FMPs has arisen. It would include modern world achievements as well as the uniqueness of the Croatian health care system and FDs’ requirements. We assumed that during the past five years of mandatory use of EHR software, Croatian FDs have mastered the use of information technology in daily operations, have become aware of the necessity of having an advanced and functional software support used in everyday work, and can recognise the needs that are not being met at the present stage of the development of this type of software. We also assumed that by applying the appropriate assessment model, their qualitatively expressed satisfaction with the use of selected EHR software can be transformed into a quantitative assessment of the user-perceived quality of the software functionalities. Thus, the ultimate goal of this study is to design a novel model for fast and easy evaluation and comparison of quality of the EHR software versions. Based on the quality rates gathered this way, the existing and future customers could more easily choose a better software solution, and health authorities can obtain feedback on the quality of the actual certification criteria, and manufacturers can get information about the directions for the improvement of their products.
Methods
In order to achieve the set objective, we created a methodology which among others includes theoretical study, designing, implementing and multiple evaluation of a novel measurement model.
Theoretical study
Within theoretical study, we analysed and contrasted the current world models for certification and quality assessment of EHR systems5–7 as well as world-renowned projects,8–15 standards,16–18 and initiatives.19,20 Special attention was paid to the European research papers and studies in the field of information technology (IT) adoption,21 quality evaluation22–27 and usability28–30 of the ambulatory EHR systems. Trying to assess the situation and the specifics of Croatian health system, we analysed the significant results of research on the health information system in the Republic of Croatia.3,4,31–37 We also tried to keep to basic guidelines for good evaluation practice in health informatics38 and statement on reporting of evaluation studies in the health informatics.39
Initial framework model
Based on the previously explained theoretical study and experiences from our past research projects, we have designed the initial framework model (IFM). We decided that in the first level of categorisation, this model consists of six main categories, representing the key functionality groups of the respective software support. Using the same principle, for each of six main categories we formed six units, i.e. pools of statements which are in fact quality indicators. The unit by the name of ‘A-Business ( administrative) functionality’ contains 28 statements covering: patient protocol, management of administrative data and prescribed nomenclatures, legal rights and obligations and business and financial quality indicators. The unit ‘B-Privacy and data security’ contains 19 statements covering: unauthorised data access protection, user responsibility and role management and applications of data protection methods. The unit ‘C-Domain (health) functionality’ contains 37 statements covering: domain workflow in FMP, inbuilt medical standards and classifications, inbuilt diagnostic and pharmacological guidelines, medical information management, indication of critical and chronic conditions and advanced functionalities for the improvement of FDs’ work. The unit ‘D-Organisational and communicational functionality’ consists of 14 statements covering: health data exchange with other health care providers, institutions and patients. The unit ‘E-Ergonomic functionality’ has 19 statements covering: ease of use, intuitiveness of user interface, user interface customisation, remote support and software version improving, formatting of display messages and personal reminders, help system quality, quality of user guides and overall user satisfaction. The unit ‘F-Additional services’ contains 10 statements covering: various forms of services for improving the patient’s life quality according to personal profile of the treatment (diet, exercise, medication plans and health summaries), automatic forming of call lists for check-ups for targeted risk groups and advanced EHR data analysis for the purpose of medical–scientific research. The complete content and organisation of the IFM is shown in Appendix A.
Content validity
A verification of the content validity40–42 of the IFM was carried out in three steps. In the first step, we compared the basic quality indicators of our IFM with the contents of the recognised international certification and quality labeling models.5–7 In the second step, the IFM was given for the assessment procedure to the professional association of FDs ‘Croatian Association of Family Medicine’ [hrv. Koordinacija Hrvatske Obiteljske Medicine, (KoHOM)]. In the third step, we conducted a process of content validation by three groups of independent prominent professionals. Twenty-eight of fifty addressed professionals accepted the call, 10 of which were health care professionals, 10 were IT professionals in health informatics and eight were administrative professionals in health care. Average ratings obtained for all categories from all three groups were between 4 and 5 assessed on an equidistant scale from 1 to 5. According to the overall results of the content validity verification, we concluded that our IFM is valid and ready for further procedures. The sources of references for the process of content validation are listed in square brackets after each statement in Appendix A.
Experimental research
Following the IFM, we have designed the measurement tool (questionnaire), consisting of two main parts. The first part has 14 questions and includes general information about the FMP, FD and currently used software version. The complete content is presented in Appendix B. This part is important for a description of measured population. The second part contains a total of 127 questions on EHR software inbuilt functionalities deployed within six major categories, i.e. six units of the IFM shown in Appendix A. Each statement from the IFM was shaped as a question about the level of user satisfaction with the applied software functionality. The survey was carried out during the period from October 2012 to January 2013. The questionnaire was designed in electronic format using the ‘SurveyMonkey’43 online service and offered to the population of 2335 Croatian FDs through official mailing lists and websites of FDs’ professional associations. The collection of cases was solely based on the discretion of a doctor to accept and fill in the questionnaire. Each case entered this way is considered as independent of the others. The applicants were asked to assess the quality of application of certain software functionality by using five-point Likert-type scale40–42 with degrees: 1 – not applied or is unusable, 2 – poorly applied, 3 – moderately applied, 4 – successfully applied and 5 – very successfully applied. In fact, one can say that it is a hybrid scale between applications yes/no and satisfaction. We chose it in line with the key principles of research, which are:
If some of the functionality exists, and the doctor cannot recognise it or it is not documented in user guide, it is considered that it has never been applied.
The answer ‘do not know’ deliberately is not offered in order to encourage doctors to better explore their EHR software versions to be more familiar with them.
Spacings between adjacent points of the scale are considered to be equal.
At the beginning of the questionnaire, the candidates were acquainted with the method and principles of testing. The average estimated time needed to complete the questionnaire was 45 min.
Face validity test
For the purposes of the so-called ‘face validity’ testing,40–42 at the end of the questionnaire, we added two more questions for the assessment of the quality and intelligibility of the questionnaire, as well as a free text field for doctors’ comments. For the assessment, an equidistant five-point scale is also applied.
Statistical methods and procedures
In order to determine the correct statistical methods and tests that could be applied in further analysis depending on the actual circumstances, we used appropriate methods and procedures of descriptive statistics for testing the collected data distribution properties. For the purpose of extracting the key subcategories in the main categories of the final form of the novel measurement model, we have implemented procedures of exploratory factor analysis (EFA) or principal component analysis (PCA) over the sets of observed variables, i.e. quality indicators that describe the main categories.44 In parallel with these procedures, we also tested the construct validity and the value in use. In order to confirm value in use and compare quality ratings among all software versions, it was necessary to calculate the scale scores of the individual ranking subcategories in a simple and usable way. For that purpose, we doubted among: different applications of weighted sums,42,45 using of U-statistics46 and the simple application of the mean values of normalised scale scores. We dropped U-statistics because the calculation is very complicated, and, after all, our model is not applied in the field of clinical testing. According to Nunnally,42 weighting schemes are very complicated and usually produce a measurement that is highly correlated with the unweighted measurement, and there is no statistical advantage to the weighting. So, we decided to analyse the properties of the measured sample (normality and dependencies of the distribution) at the level of each individual Likert item as an ordinal scale (in accordance with Steven’s teaching47) and, in the spirit of the modern psychometrics,40–42 to use equally weighted scale scores with assumed unidimensionality of the constructs. In order to gain value in use and to simplify the combination of scale scores of the individual subcategories into the complex quality indicators, we normalised scale scores X within the range from 0 to 100 by using Formula 1.
 (1)
(1)The ‘SPSS Statistics 17.0’ software was used for all statistical calculations.48,49 Implied confidence interval in all statistical procedures is 95%, and hence the significance level is 0.05.
Results
Primary result analysis
The survey collected 399 cases and 384 (16.4% of 2335 FDs) remained after the cleaning process. The cleaning was carried out by complete removal of 15 (3.8 % of 399 cases) incomplete or incorrect records. The sample included the applicants from all 20 counties of the Republic of Croatia and the City of Zagreb and consisted of 315 (82%) females and 69 (18%) males. By applying the chi-square test, we found statistically significant differences between the observed and expected distributions by age, gender and specialist degree in FM. For distribution by age groups χ2 (4, n = 384) = 13.431, p = 0.009 and for distribution by gender χ2 (1, n = 384) = 5.484, p =0.019, while for distribution according to specialist degree in FM χ2 (1, n = 384) = 28.568, p < 0.001.50 The sample included members of all eight officially approved software versions, where one collected only one case and was therefore dismissed as statistically irrelevant. The distribution of sample cases for seven further analysed software versions was 133, 124, 63, 33, 17, 8 and 5, respectively. Kolmogorov–Smirnov and Shapiro–Wilk tests50 indicated significant statistical deviation from the normal distribution at the level of p < 0.001 (α = 0.05) among all measured categories. After these tests, we carried out the tests on the diversity of collected results with respect to two key independent variables: the gender of a doctor and EHR software version. The non-normal distribution and unbalanced sample point to the use of non-parametric statistical methods and additional caution in applying further statistical procedures. So, we used the Kruskal–Wallis test50 to test the differences between these groups. Based on the results of these tests, we concluded that there are no statistically significant differences in the distribution of the collected results with regard to gender (0.97 ≥ p > 0.05, α = 0.05), while at the same time, there are significant differences in the distribution of the collected results with regard to the used software version (p < 0.001 and α = 0.05). This means that there are no additional complications during further analysis and reporting due to different gender sensibilities and that is possible to make a comparison of perceived software quality among present software versions.
Face validity
Obtained average ratings were 3.95 for quality and 3.89 for intelligibility of the IFM and questionnaire, assessed on an equidistant scale from 1 to 5. Doctors were generally commented on the shortcomings of EHR software they use, 11% of doctors have complained of the length of the questionnaire and 14% praised the concept of the questionnaire, while 19% expressed problems in knowing the software they use.
Design of the novel model structure
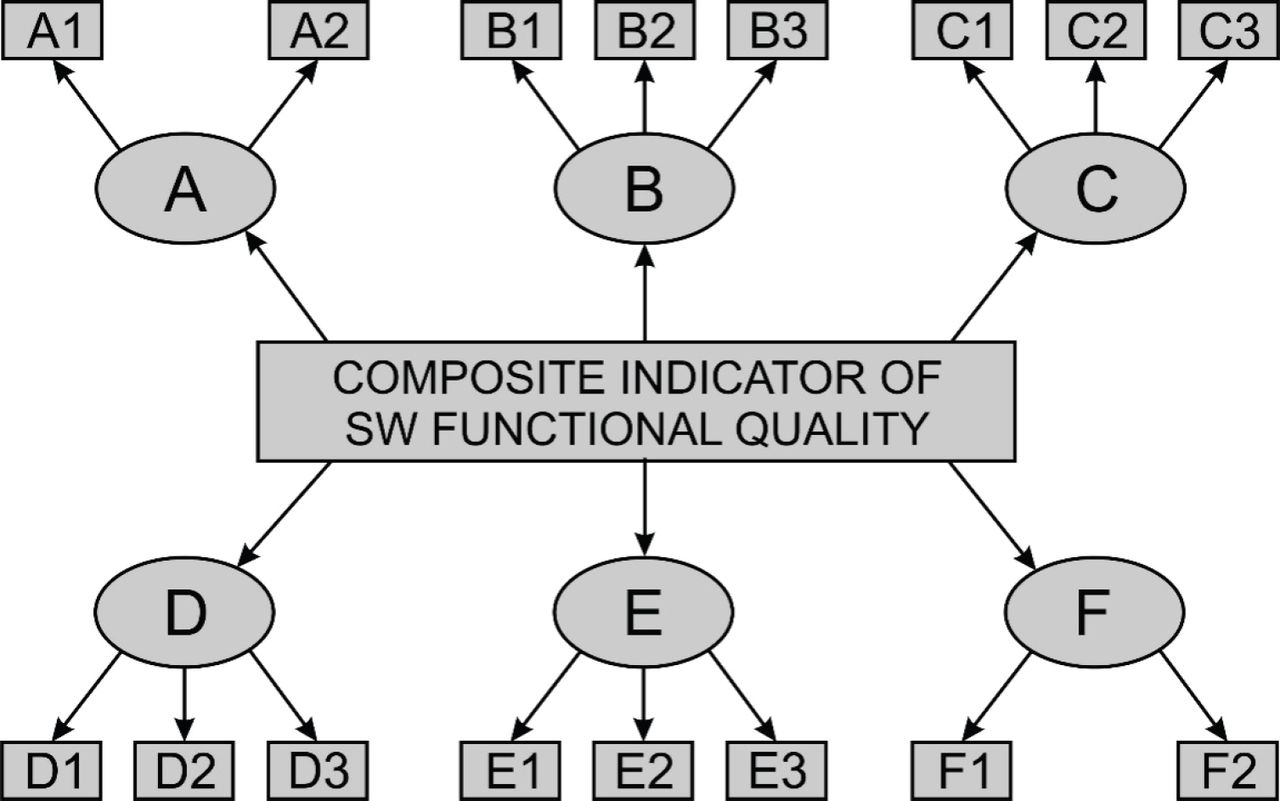
In order to design subcategories of the novel measurement model, we carried out certain procedures of PCA or EFA. To check the suitability of a particular sample, we conducted the Kaiser–Meyer–Olkin (KMO) test of sampling adequacy and Bartlett’s test of sphericity.44,48,49 The values of the KMO test were very high in all cases, ranging from 0.857 to 0.962, while the values of Bartlett’s test were in all cases statistically significant at p < 0.001. So, the sample was valid in all cases and the results of sample factor analysis may be useful.43,44 To single out the optimal number of factors in every category, a triple criterion was applied: Kaiser’s criteria, Cattel’s diagrams and parallel analysis of the actual distribution of values with a set of normally distributed random numbers obtained by applying the so-called ‘Monte Carlo’ simulation was used.51 Tabular presentation of the novel model structure is shown in Table 1. Table 1 also shows the key values of test parameters of the FA. Observed variables which describe their related latent variables (subcategories), i.e. statements shown in Appendix A, have appropriate marks of subcategories in round brackets in the first column. The structural diagram of the novel model is shown in Figure 1.

Construct validity
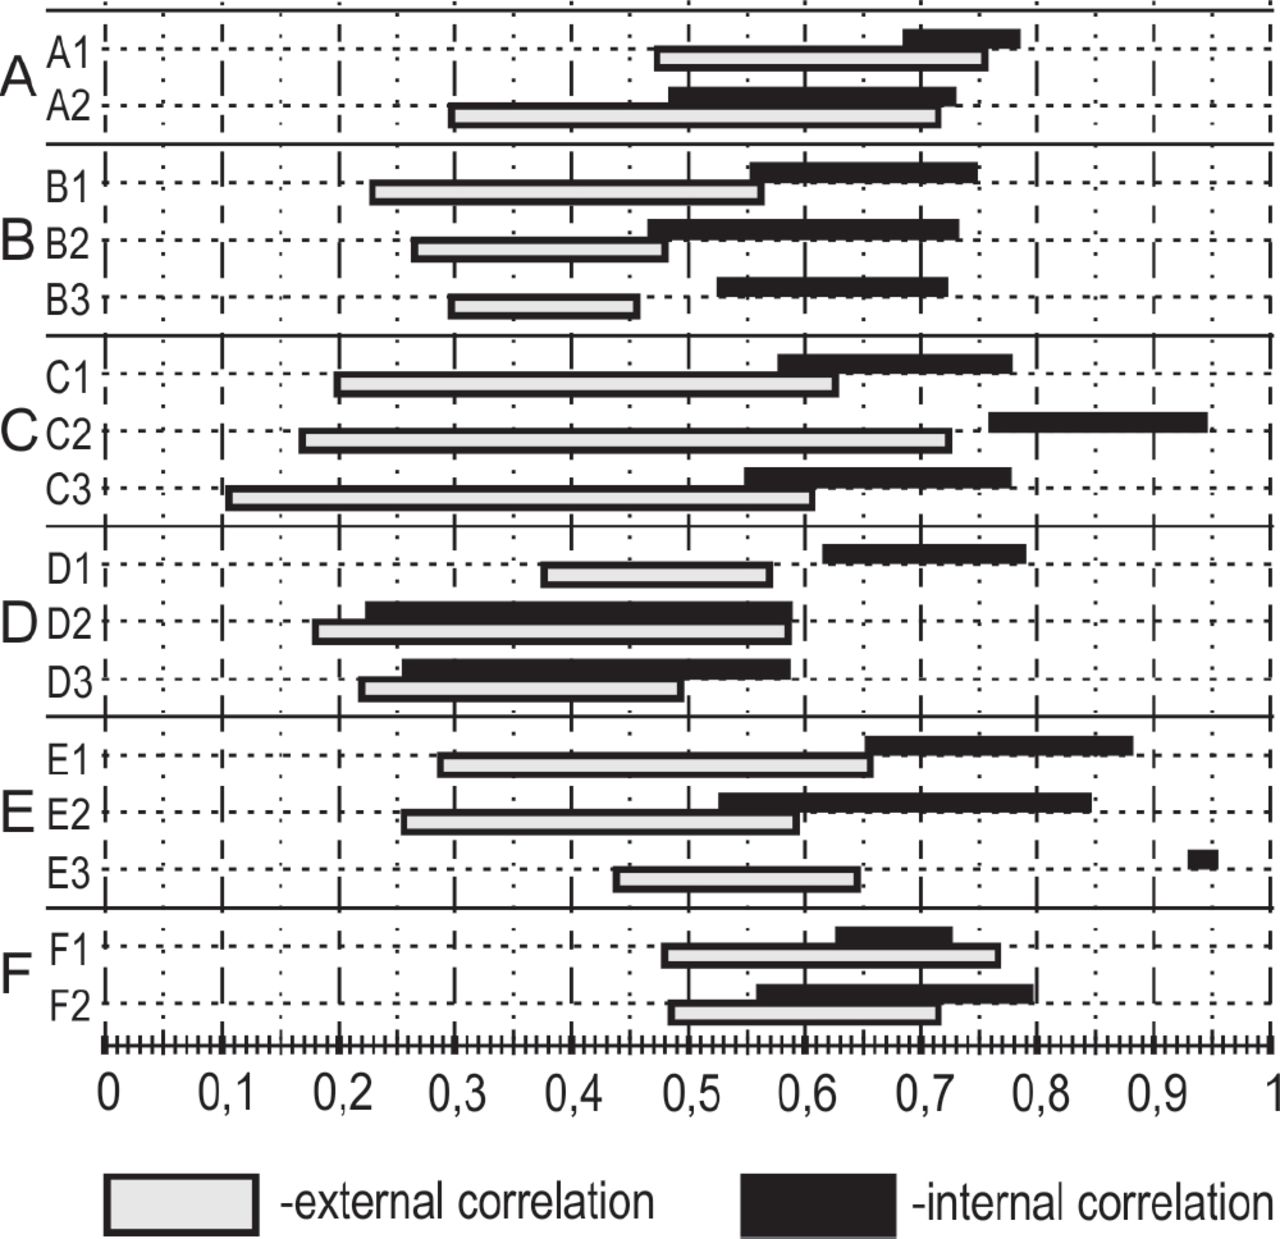
In order to assess the construct validity, we considered the extent the variables inside particular category, i.e. construct have the same object of measurement or so-called convergent validity, as well as the ratio between this values and the degree of association of these variables with neighboring constructs (which are considered independent) or so-called discriminative validity or discriminativity.41,52 The convergent validity was confirmed by successfully implemented procedure of FA and calculation of the Cronbach α reliability coefficient for each of models category and subcategory scale. As shown in Table 2, the calculations of Cronbach α coefficient53 are mostly significantly higher than 7 for all subcategories, except in the case of a subcategories D2 and D3, where we can say that it is satisfactory for the field of application.42 It is desirable that values of internal correlation factors are as higher as possible (>0.3) and values of external correlation factors as less as possible (<0.3).
Graphical presentation of the ratio between the ranges of internal and external correlation of certain subcategory is shown in Figure 2. Significantly smaller discriminativity was determined within subcategories D2 and F1. Greater overlapping between internal and external correlation ranges indicates a higher degree of correlation with the neighboring constructs.
Value in use
Table 3 shows the user-perceived quality ratings of categories and subcategories in normalised mean values ranging from 0 to 100 for seven out of eight approved software versions (SV1– SV7) in total. The overall score named as ‘Composite indicator of software functional quality’ is highest for software version SV2 and amounts 54.32±1.10, while the lowest of 29.27±3.02 was given to SV7. The highest rated subcategory was ‘A1-The management of legally prescribed content’ for software version SV2 (89.04±1.04) and the lowest rated subcategory for all software versions was ‘C2-Advanced systems for control and work support’. Software version SV2 has significantly higher ratings than other versions within mostly all categories and subcategories. By far, the lowest total ratings for all versions goes to the subcategory ‘C2-Advanced systems for control and work support’ and ranges from 0.00 (obviously this functionality does not exist or it is not perceived by users at all) for SV7 (n=5), over 8.96 ±1.90 for SV2 (n=115), up to 15.00±6.27 for SV6 (n=8). The results in Table 3 are here presented mainly to demonstrate value in use of the novel model. Serious analysis and interpretation of the results requires much more space and should be the subject of a separate paper. The quality ratings presented with normalised mean values, their standard errors of mean, and standard deviation are shown in APA style table in Appendix C.
Discussion
Principal findings
We found that in accordance with the set objective, it is possible to realise a novel model for the assessment of the inbuilt functionalities of the EHR software in FMPs, which is based on user satisfaction. Moreover, it is possible to assess and compare the user-perceived quality ratings among different EHR software versions available on the market.
As can be seen from the results in Table 3, there are a lot of room for functional improvement of the EHR software for FMPs available in Croatian market. Generally speaking, we can say that the highest rated functionalities are those that have long been present in the local market, while the new and advanced functionalities, yet to be introduced and encouraged. Comparing with the results of some of our previous research,34 Croatian FDs are still not enough motivated and the local health authorities are still not enough interested in this kind of study.
Implications of the findings
Considering the assessment categories and application of the standardised measurement scale, the novel evaluation model could be used to assess the user-perceived functional quality of almost all forms of EHR software in ambulatory settings within the PHC as well as in various specialist clinics within the polyclinic or health care consulting. Its value in use has been demonstrated through a simple and understandable presentation of measured results. Based on the quantitative and qualitative results of this study, manufacturers of EHR software, competent health authorities and other stakeholders, in the coming period, could draw the conclusions that could help them to solve identified problems and improving the functionalities of the targeted EHR software. Inclusion of ergonomic categories moves the focus of the functional quality assessment of EHR software from a strictly institutional assessment of elementary functions, common in preceding periods, towards new concepts, based on usability and its key element – user satisfaction. The importance of such an approach is also confirmed by the recent actions of the US non-profit agencies HIMSS and the recent expansion of the CCHIT certification programs to the area of usability testing as a key factor of the effectiveness of health care delivery and patient safety in the treatment.54
Comparisons with the literature
The situation observed in this study is partially supported by the results of our research conducted during the past five years.4,34,35 There are also several European studies that deal with the issue of functional quality and advanced functionalities of this type of EHR software. The most similar to our research are OECD’s cross European e-Health benchmarking among general practitioners15 and Italian nationwide study about the state and possibilities of improvement of the EHR software in general practice.27 These studies reach similar conclusions relating to the application of advanced functionalities within their scope of observation. However, in both the cases, observed situations are expressed as overall ratings of perceived functional quality, and the categorisation of indicators is not clear enough to be used by stakeholders present in the e-Health market. We believe that our model provides a better categorisation of quality indicators, i.e. it better follows the workflow in FMPs and provides a concrete comparison between different software versions. In this way, stakeholders can clearly perceive which products raise and which reduce the functional quality of this segment of e-Health. The concurrent US study about optimizing EHR usage in PHC30 approaches the problem of the EHR software functionality in the context of harmonisation of the standardisation of the EHR processes with the PHC teams’ demand for EHR customisation. It is a situation that also requires a close cooperation between key stakeholders and requires an assessment of user satisfaction with inbuilt standard functionalities of EHR software.
Limitations of the method
One of the first potential limitations of the here presented research is the limitation on the area of Croatian FM. However, the number of localisation parameters is relatively small, so this evaluation model is generally applicable beyond the Croatian borders. The localisation is mainly expressed in administrative and domain functionalities that are directly regulated by various rules and regulations stipulated by Croatian health authorities. Other categories and the methodology itself are generally applicable.
Another potential limitation is related to the problem of sampling.50 Collected sample is stratified into seven unbalanced strata representing users of the seven EHR software versions. In principle, we are not interested so much in the actual distribution of the EHR software versions, but we are interested in comparison of their perceived quality. In this regard, it would be better to randomly collect equal number of cases in each stratum and evaluate software versions on a more equal basis.
Length of the questionnaire can also be a limiting factor, because, first of all, it looks repulsive to potential applicants and they may refuse to even begin to fill out a questionnaire. Estimated time to complete the questionnaire in practice may be considerably longer if doctors are not enough familiar with their EHR software.
Call for further research
Further research is of key importance for improving this kind of software support. In the next period, we will certainly try to test our model in other types of practices in PHC as well as in the case of various specialist practices within the polyclinic or health care consulting. We hope that based on collected results, these tests will contribute to: improvement and possible corrections of our model, better preparation of the measured population, and better support from competent health authority. It is necessary in order to achieve more accurate and objective procedure of evaluation.
Conclusions
The quality assessment model of EHR software in FMPs presented in this study is multiple validated, comprehensive and universal. Considering clear and understandable measuring categories and the application of standardised measurement scale ranging from 0 to 100, it could be used for easy and fast evaluation and comparison of the user-perceived functional quality of almost all the forms of EHR software in different practices within the PHC as well as in the case of various specialist clinics within the polyclinic or health care consulting. True, we reported a certain number of limitations, but these limitations are difficult to avoid, and regularly, we can find them in almost all similar concurrent research projects. In the forthcoming period, it is essential to thoroughly present our study to all stakeholders. In the first step, this will contribute to the improvement of our model, while in further steps, it will contribute to the improvement of the quality of the considered EHR software.
Acknowledgments
We are very grateful on the support provided by the professional association ‘Croatian Association of Family Medicine’ (KoHOM). They recognised the importance and value of this research and provide significant professional and technical support for its realisation.
APPENDICES
APPENDIX A
IFM – Combined view
The following table contains the statements of initial framework model, which are in the same time questions asked in the second part of the survey questionnaire. Abbreviations of references for content validation are listed in square brackets at the end of each statement. Column ‘Cat.(Subcat.)’ contains marks of main categories and statements, and marks of subcategories of final model to which particular statement belongs are given in round brackets.
APPENDIX B
First part of the questionnaire
The first part of the questionnaire contains general data about tested population divided in three groups:
APPENDIX C
Results obtained by using the novel quality assessment model
References
Footnotes
Conflict of interest The authors have no conflict of interest to disclose.