Article Text

Abstract
Introduction Renal function is reported using the estimates of glomerular filtration rate (eGFR). However, eGFR values are recorded without reference to the particular serum creatinine (SCr) assays used to derive them, and newer assays were introduced at different time points across the laboratories in the United Kingdom. These changes may cause systematic bias in eGFR reported in routinely collected data, even though laboratory-reported eGFR values have a correction factor applied.
Design An algorithm to detect changes in SCr that in turn affect eGFR calculation method was developed. It compares the mapping of SCr values on to eGFR values across a time series of paired eGFR and SCr measurements.
Setting Routinely collected primary care data from 20,000 people with the richest renal function data from the quality improvement in chronic kidney disease trial.
Results The algorithm identified a change in eGFR calculation method in 114 (90%) of the 127 included practices. This change was identified in 4736 (23.7%) patient time series analysed. This change in calibration method was found to cause a significant step change in the reported eGFR values, producing a systematic bias. The eGFR values could not be recalibrated by applying the Modification of Diet in Renal Disease equation to the laboratory reported SCr values.
Conclusions This algorithm can identify laboratory changes in eGFR calculation methods and changes in SCr assay. Failure to account for these changes may misconstrue renal function changes over time. Researchers using routine eGFR data should account for these effects.
- assay methods
- estimates of glomerular filtration rate (eGFR)
- serum creatinine (SCr)
Commons license http://creativecommons.org/licenses/by/4.0/
Statistics from Altmetric.com
Introduction
Chronic kidney disease (CKD) is a significant public health problem and is becoming more common with the ageing population and increasing disease burden from diabetes.1,2 There is a complex relationship between CKD, diabetes, and hypertension resulting in increased risk of mortality and cardiovascular disease in people with these commonly comorbid conditions.3 Recent estimates of the prevalence of CKD in the United Kingdom are around 7.3%–8.5%.4,5 This is associated with substantial financial burden: in 2009–2010, the cost of CKD to the English National Health Service (NHS) was estimated at £1.44–£1.45 billion, approximately 1.3% of the total NHS spending during this period.6 Over half of this was spent on renal replacement therapy for people with end-stage renal disease, which accounts for only 2% of the CKD population.6 Early identification, appropriate referral, and intervention in CKD are therefore critically important.
Estimation of renal function has been routine in clinical practice since the publication of the Cockcroft–Gault equation for estimating creatinine clearance in 1976.7 Categorisation of CKD and clinical decisions are currently based on the estimated glomerular filtration rate (eGFR)8,9 although the Cockcroft–Gault equation is still widely used to calculate drug dosing.10,11 The eGFR can be calculated from serum creatinine (SCr) measurements using the Modification of Diet in Renal Disease (MDRD) equation first published in 199912 and later simplified in 2003.13 However, the MDRD equation underestimates GFR in people with mild renal impairment14,15 and in some subgroups, such as kidney donors and people with diabetes.16,17 More recently, the CKD Epidemiology Collaboration (CKD-EPI) equation was developed to tackle these limitations and has been demonstrated to have improved performance in mild renal impairment and across patient subgroups.18–21
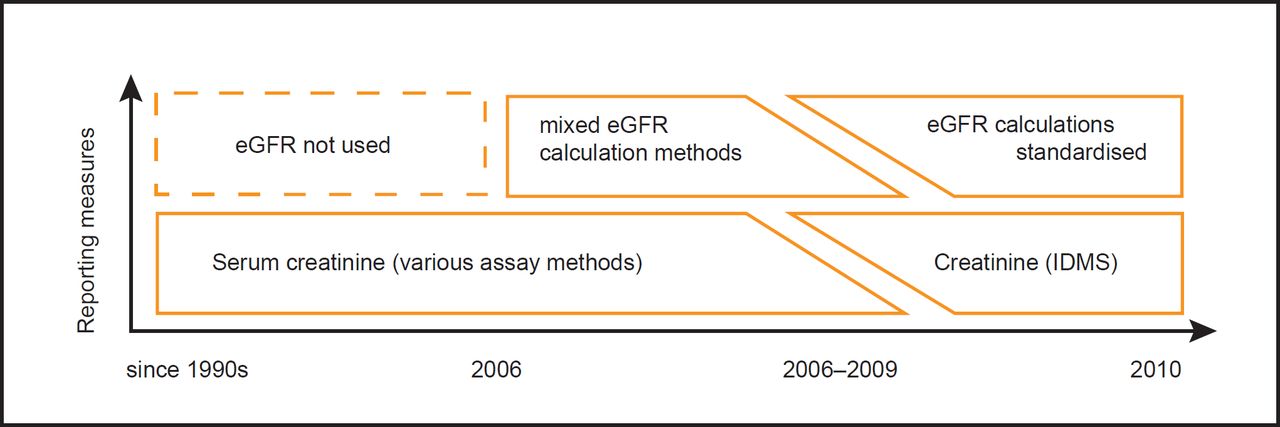
Continuously changing methods for calculating renal function present a problem for both clinicians and researchers. Changing methods of eGFR calculation affect trends in renal function over a period of years. This problem is further compounded by differing creatinine assays between laboratories.22,23 The UK National External Quality Assessment Scheme (UKNEQAS) recommends that each clinical laboratory calculate eGFR using isotope dilution mass spectrometry (IDMS) creatinine assay, a standardisation program that was initiated in 2007,24,25 with different laboratories achieving standardisation at different times (Figure 1). In clinical practice, laboratory-calculated eGFR values are reported without reference to the equations or creatinine assays that were used to derive them. Records will also contain eGFR results derived in practice possibly using one of the many online calculators.25 In our experience, this practice was most common when primary care first became aware of CKD, but is now rare, with the automatic reporting of eGFR and creatinine.
Current clinical guidelines recommend early referral of patients with declining GFR to specialist services. While standardisation of current eGFR values has been achieved, there is a need for retrospective calibration both in the research and the clinical settings to allow accurate monitoring of renal function trends. If the CKD-EPI equation is widely adopted in primary care, this will be of renewed importance.26 Here, we describe a method for identifying changes in eGFR calculation method (which includes correction factors for the creatinine assay used) in routinely collected data. Identification of these changes is the first step towards backward calibration of the entire eGFR time series for a given patient – that is, making all of the patient’s eGFR measurements compatible. Without such a method, trends in renal function are misleading. Our algorithm identifies the date of change from one method eGFR calculation method to the next for each patient and primary care practice. While this has little immediate clinical importance or relevance, there are substantial implications for longitudinal research utilising these historical data.
Method
The UK electronic patient record is currently coded using the read coding system.27 This enables coding of the eGFR equation used, although eGFR can be coded with no reference to the equation used. We investigated the range of codes available to record eGFR to explore if there was scope to improve the provenance of these data.
We devised an algorithm that is able to identify the changes in the calculation method of eGFR for any time series of eGFR and SCr measurements for a given patient. This method requires a time series of paired eGFR and SCr values for each patient, i.e. SCr and eGFR values are recorded simultaneously. We shall call this paired time series the renal function time series of the patient.
The eGFR method change finding algorithm
Each laboratory uses a function (Mlab) to convert SCr measurements (c) into eGFR values (glab). Thus
 (1)
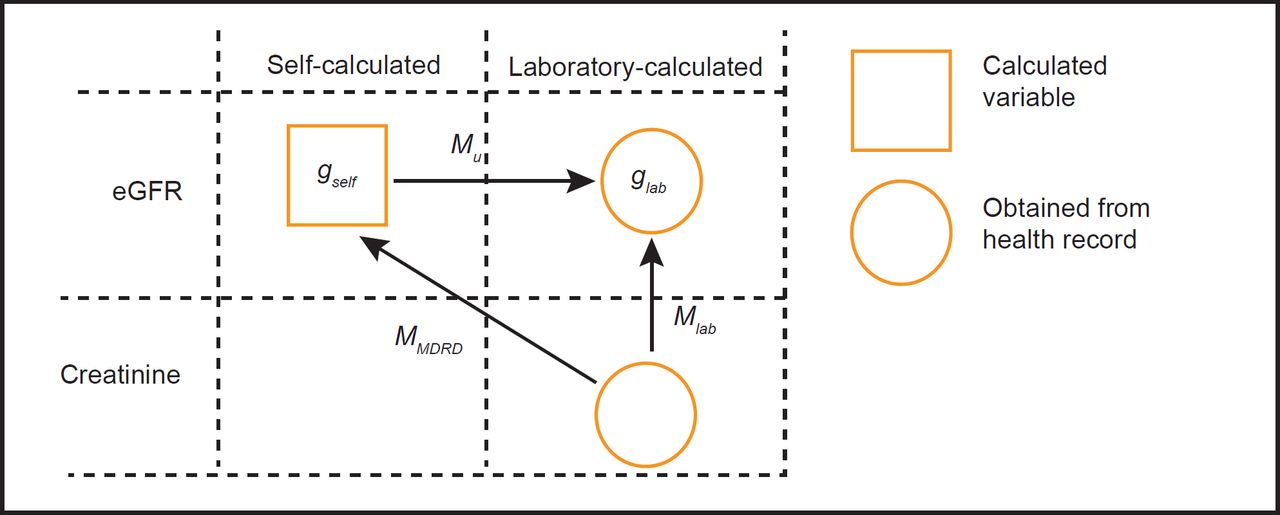
(1)where CF represents the patient-specific adjustment based on patient characteristics (age, gender and ethnicity). To identify the changes in Mlab, we defined a self-calculated eGFR (gself) generated using the MDRD equation (MMDRD) and using patient characteristics (CF) taken from the patient record
 (2)
(2)We then defined a mapping function (Mu) that maps the selfcalculated eGFR onto the laboratory-calculated eGFR (Figure 2). The laboratory-calculated eGFR can, therefore, also be written as
 (3)
(3)
The mapping function Mu will vary from the laboratory eGFR calculation function, Mlab. It is therefore possible to determine the number of laboratory Mlab functions by determining how many Mu functions are required to map the entire renal function time series. We identified that Mu is a linear function in the logarithmic domain of its argument, glab and gself. Let us define the mapping function from log(glab) to log(gself) be Mu′. This function must be linear1, taking the form of
 (4)
(4)where the parameters w1 and w0 can be found by the method of least square regression in the case of a single assay method and a mixture of regression28 in the case of multiple assay methods. By a mixture of regression, we mean that several regression lines are fitted to the data simultaneously. Thus, if an eGFR series is composed of two different assay methods, two regression lines are needed to fit the data. The laboratory-calculated eGFR can therefore be obtained by
 (5)
(5)Performing this mapping from gself onto glab for a series of two or more measurements enables w1 and w0 to be calculated.
SUBJECTS AND SETTING
We generated and tested the algorithm using anonymised patient records collected from 127 primary care practices across England; a total of nearly a million patient records (n = 951,764). These data were obtained for the quality intervention in chronic kidney disease (QICKD) trial (clinical trials registration: ISRCTN56023731).4 These primary care samples comprise a nationally representative sample of urban, suburban and rural practices in localities within London, Surrey, Sussex, Leicester, Birmingham and Cambridge. The complete protocol used for sampling and data collection from these practices for the QICKD trial has been previously described. 29 In brief, routine clinical records were collected between June 2008 and December 2010. All practices had the final data collection in December 2010. All patients registered with the included practices at the time of the first sampling period (June 2008) were included in the data sample. Complete historical records were obtained for all these patients for a number of clinical variables, including that data relating to renal function. All data were anonymised at the point of data extraction. Data from each practice were labelled with an anonymised practice ID number.
To analyse the usage of eGFR codes we counted the total number of eGFR codes used in the primary care records of all 951,764 people included in the QICKD database.
To test our eGFR calculation change finding algorithm, we selected 20,000 patients with the most complete renal function time series in terms of the number of paired laboratory eGFR and SCr.
From the initial patient set, we excluded laboratoryreported values of eGFR readings exactly equal to 60 or 90 ml/min because these values correspond to the capped thresholds chosen by certain laboratories. For example a laboratory using the 90 ml/min cap would report an eGFR of 93 ml/min as >90 ml/min; however, the ‘>’ sign can be lost in how the primary care computer system processes these data.
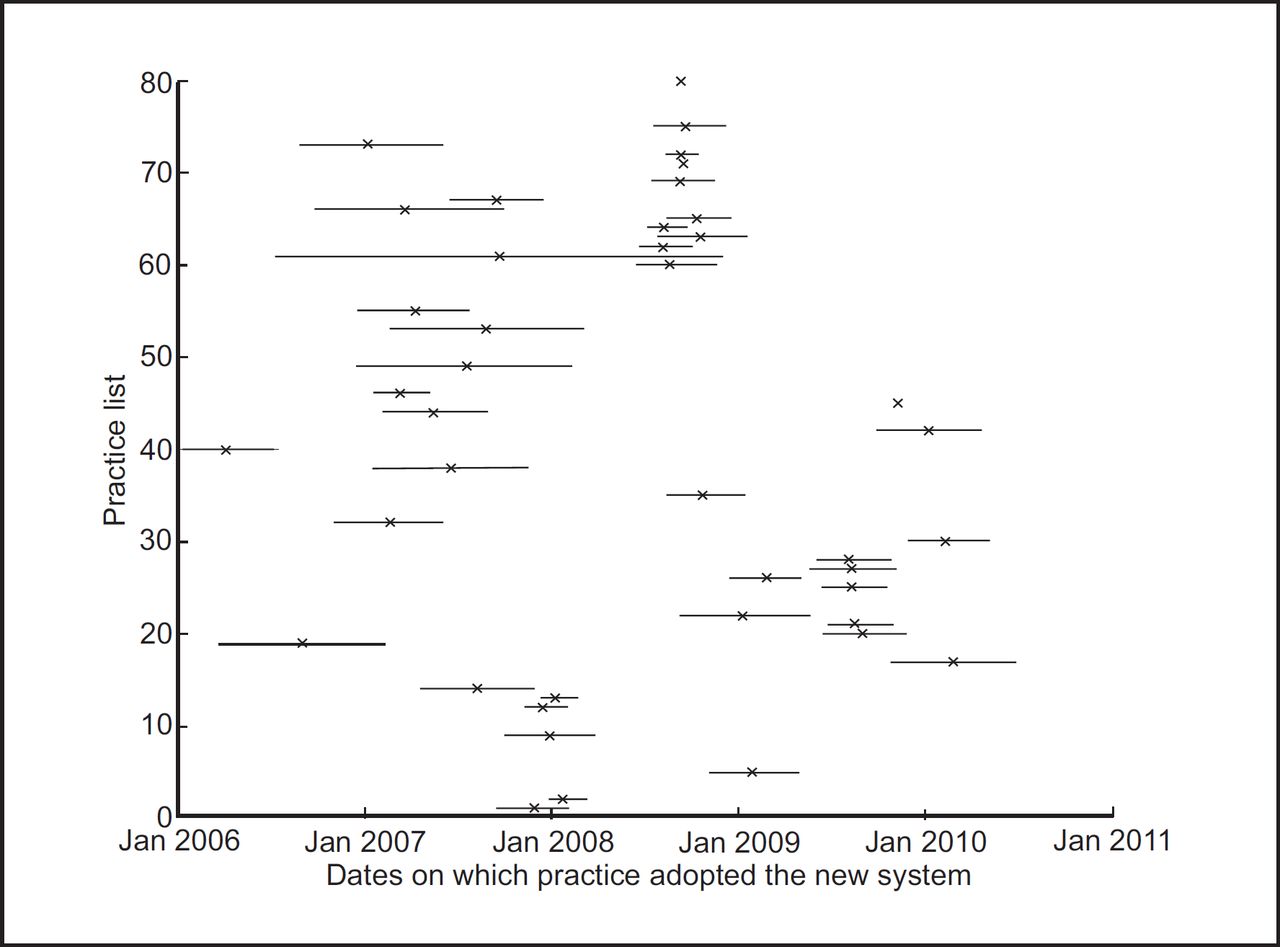
We used an anonymised practice identification number to group patients by practice. As all practices sent laboratory samples to a single laboratory, this change will affect all eGFR measurements reported by that practice, other than patients who move practice and have electronic transfer of their records. The latest identified value of the first calculation method and the earliest identified value of the second method in each practice were used to define the interval in which the change in method occurred. This is shown in Figure 3.

Ethical considerations
No patient identifiable data was used in the analysis presented here. All the data were anonymised at the point of data extraction. The QICKD trial was approved by the Oxford Research Ethics Committee (Committee C). This ethics approval included authorisation for secondary analysis of the QICKD data set.
Results
A total of 1,309,337 unique eGFR measurements were identified in the QICKD database. The majority (98.7%) of eGFR values were recorded using an equation specific code (Table 1). No codes were identified in the read code system that enable recording of creatinine assay method.
The 951,764 patient records obtained from the QICKD trial database were available for analysis. For this study, we used the top 20,000 patients who have the renal function time series with the highest number of paired eGFR and SCr values. These 20,000 people included had a median age of 74 (interquartile range; IQR 64–81). 10,931 (54.7%) people were female. The median number of SCr measurements per person was 22 (IQR 19–28) and the median number of eGFR estimates 16 (IQR 13–20). 13,563 (67.8%) people had five or more SCr and laboratory-calculated eGFR values recorded simultaneously.
4736 (23.7%) people had two distinct detectable methods of calculation of eGFR from SCr. These methods always occurred sequentially with laboratories converting from one method to the other. We did not identify any patients with more than two methods of calculating eGFR.
By grouping patients by their anonymised practice ID, we identified the range of dates between which the change in eGFR calculation method occurred for each practice (Figure 3). We identified a change in method in 114 (90%) of 127 included practices.
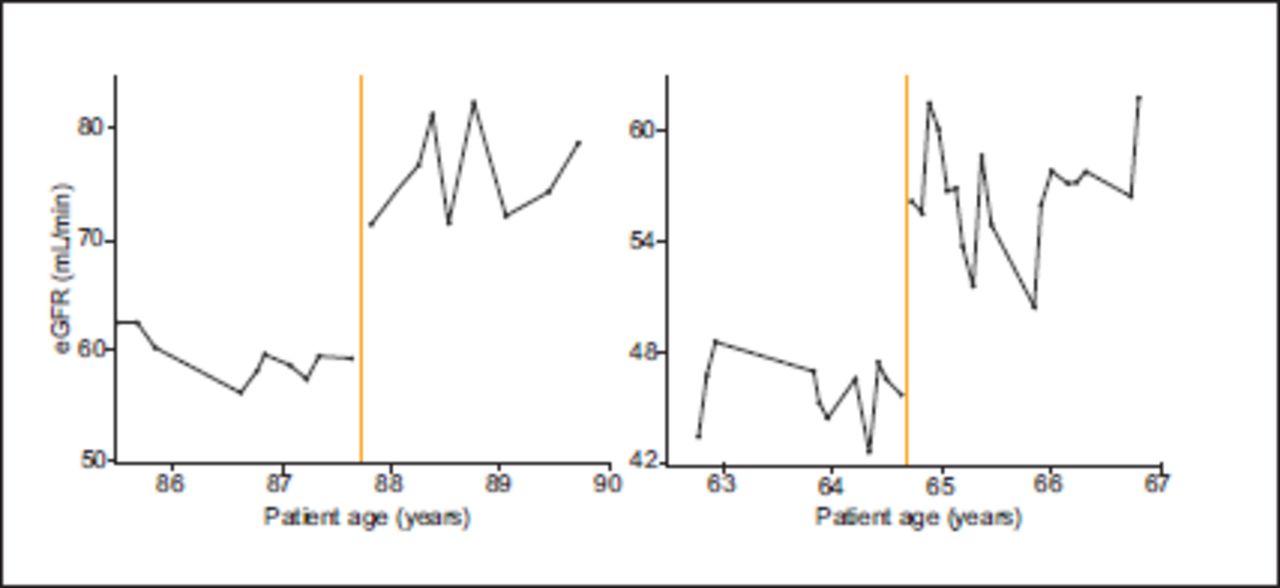
The eGFR time series from patients who had stable renal function both before and after the change in laboratory eGFR calculation method demonstrate a substantial step change at the time of the change in method (Figure 4). Using the MDRD to calculate eGFR from the reported SCr measurements similarly demonstrates a discontinuity (Figure 5). Almost all of the step changes were an improvement in renal function. All of these changes occurred exactly at the time of change in eGFR calculation method. Both of these factors make this observation highly unlikely to be due to an actual physiological change in these patients.
Discussion
Principal findings
Our algorithm is able to detect changes in eGFR calculation method from a time series of eGFR and SCr measurements for any given patient. This change was detected in 23.7% of the people with the highest number of recorded renal function measurements. From these patient records, we identified a change in eGFR calculation method in 63% of the included practices occurred between January 2006 and December 2010. There were no practices with more than two eGFR calculation methods identified.
Changes in eGFR calculation method create a substantial spurious step change in patient’s renal function at the time of change in method. However, recalculating eGFR from SCr measurements does not remove this spurious step change. This suggests that the change in eGFR calculation method is also associated with a change in creatinine assay. This is consistent with laboratories responding to the UKNEQAS recommendations to standardise to use the IDMS creatinine assay. 25
The type of equation used to calculate eGFR was generally well documented in the literature but there is currently no way of recording the creatinine assay method using the Read code system.
Implications of the findings
Both clinical decisions, such as when to refer to specialist services, 8,9 are often based on renal function trends. Furthermore, there is an increasing amount of research utilising the routinely collected data. We have demonstrated that just under a quarter of renal function time series are subject to spurious step changes in renal function as a result of changes in laboratory eGFR calculation methods and creatinine assay changes. If these artefactual changes in renal function are not considered in research or clinical decisions utilising longitudinal data of this type there is substantial potential for systematic error.
If the information on the type of equation and creatinine assay was required by the eGFR coding structure, these artefactual changes would be easy to identify and correct. However, although the current primary care coding system in the United Kingdom (Read codes) does allow this information to be recorded, this is rarely used. Future recording of eGFR should make use of such features to maximise the clinical and research utility of eGFR measurement and prevent spurious data from impacting on patient care.
Alternative coding schemes also have similar problems. For example, the Logical Observation Identifiers Names and Codes system for coding laboratory information, encodes results utilising a multi-dimensional approach with six major axes to define the clinical test.30 However the most commonly used creatinine codes (2160-0 and 38483-4) do not indicate which creatinine assay was used.31,32
While we have focused primarily on the UK data here, the global use of an inhomogeneous mixture of creatinine assays prior to standardisation33 leads us to suggest that the spurious step changes identified here are globally ubiquitous in historic data.
Comparison with the literature
To the best of our knowledge, there have been no previous attempts to detect the time series artefacts we report using large-scale population data. The high level of background noise in eGFR measurements34 mean that these artefacts are not easily identified when observing the data using standard methods.
The importance of coding the context of blood glucose measurements has been previously noted although this call to improve standards has gone unheeded.35 Recording the context of eGFR measurements presents a similar problem. To effectively tackle this issue may require a change in the coding structure of existing coding systems.
Limitations of the method
The algorithm requires a minimum of two paired eGFR and SCr measurements before a change in eGFR calculation method and two after to correctly identify the change. This limits the population to which the method can be applied. However, in the data set in which additional information is known, such as the hospital or primary care centre where the test was performed, data from a few patients with a complete renal function time series can be used to predict eGFR calculation method changes in the rest of the population.
In addition, this method cannot be applied to people with normal renal function as their exact eGFR values are not reported (reported as either >60 or >90 ml/min). In practices, where a change in eGFR calculation method has been detected this change can be assumed to affect all members of that practice and could be used to calculate and calibrate these capped values retrospectively. Furthermore, the exact value of eGFR for this population is of less importance given the poor reliability of eGFR in people with good renal function. Nevertheless, it is still of interest to understand the trends in eGFR over time for these patients in order to detect early stages of CKD progression.
The data used here are now over four years old, limiting the clinical utility of this method. However, this method is still important for research using longitudinal data. In addition, as laboratories change from using the MDRD equation to the CKD-EPI equation there will be another period of laboratory eGFR calculation changes. Detection and elimination of the artefacts generated by this new change will be important both clinically and for future epidemiological research with a focus on renal function.
Call for further research
Our method is the first step to generating a back-calibration algorithm that can correct for different eGFR calculation methods used by different laboratories (Figure 6). Although direct application of the MDRD equation (or other equations) to recorded SCr measurements does not correct the measurements (primary due to changes in creatinine assays used) this does not preclude the possibility of successfully calibrating these data.

Conclusions
This algorithm can identify laboratory changes in eGFR calculation methods. Failure to identify these changes in method may cause misclassification of CKD and misconstrue renal function changes over time. While there is scope to improve clinical coding this can only be prospective, and flagging the limitations of data at the time is important for future researchers if they are to derive most meaning from these data. Researchers using longitudinal routinely collected renal function data should account for these effects.
References
Footnotes
↵1 The proof is omitted, but can be easily deduced from MDRD equations in the log domain.