Article Text

Abstract
Background Innovation spread is a key policy objective for health systems world-wide, but adoption success varies enormously. We have developed a set of short generic user-reported measures to help understand how and why healthcare innovations spread. This work builds on the literature and on practical experience in developing and using patient-reported outcome measures.
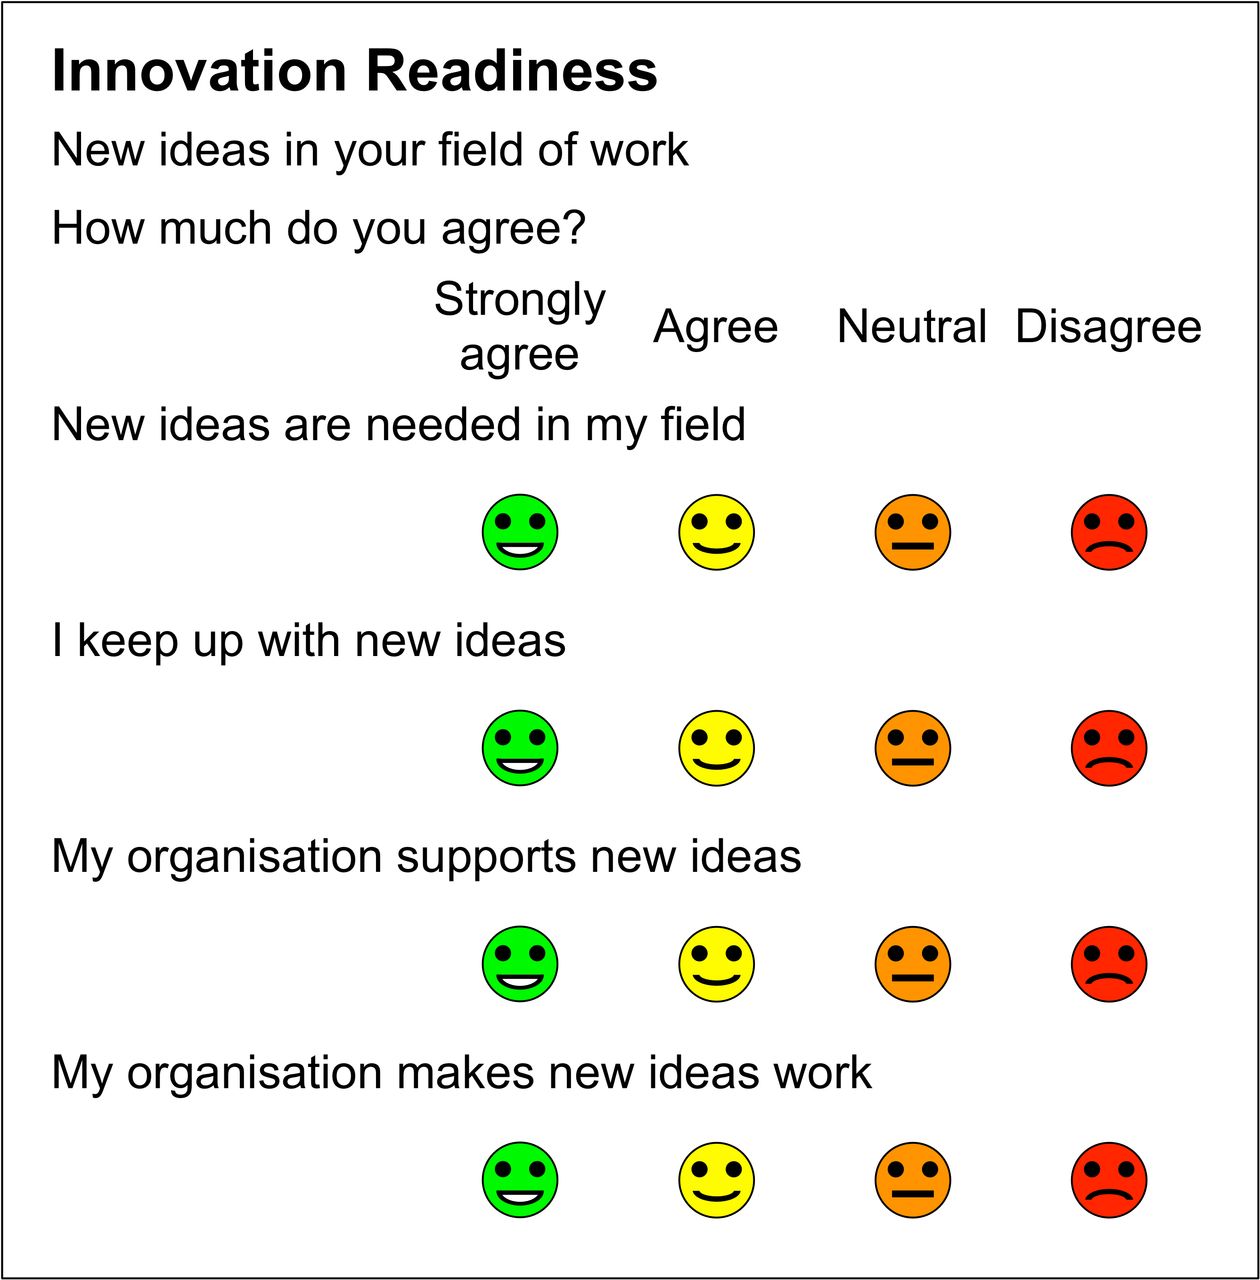
Measures The Innovation Readiness Score measures user perceptions of how much they are open to and up-to-date with new ideas, and whether their organisations are receptive to and capable of innovation. It is based on Rogers’ classification of innovativeness (innovator, early adopter, early majority, etc).
The Digital Confidence Score rates users’ digital literacy and confidence to use digital products, with dimensions of familiarity, social pressure, support and digital self-efficacy.
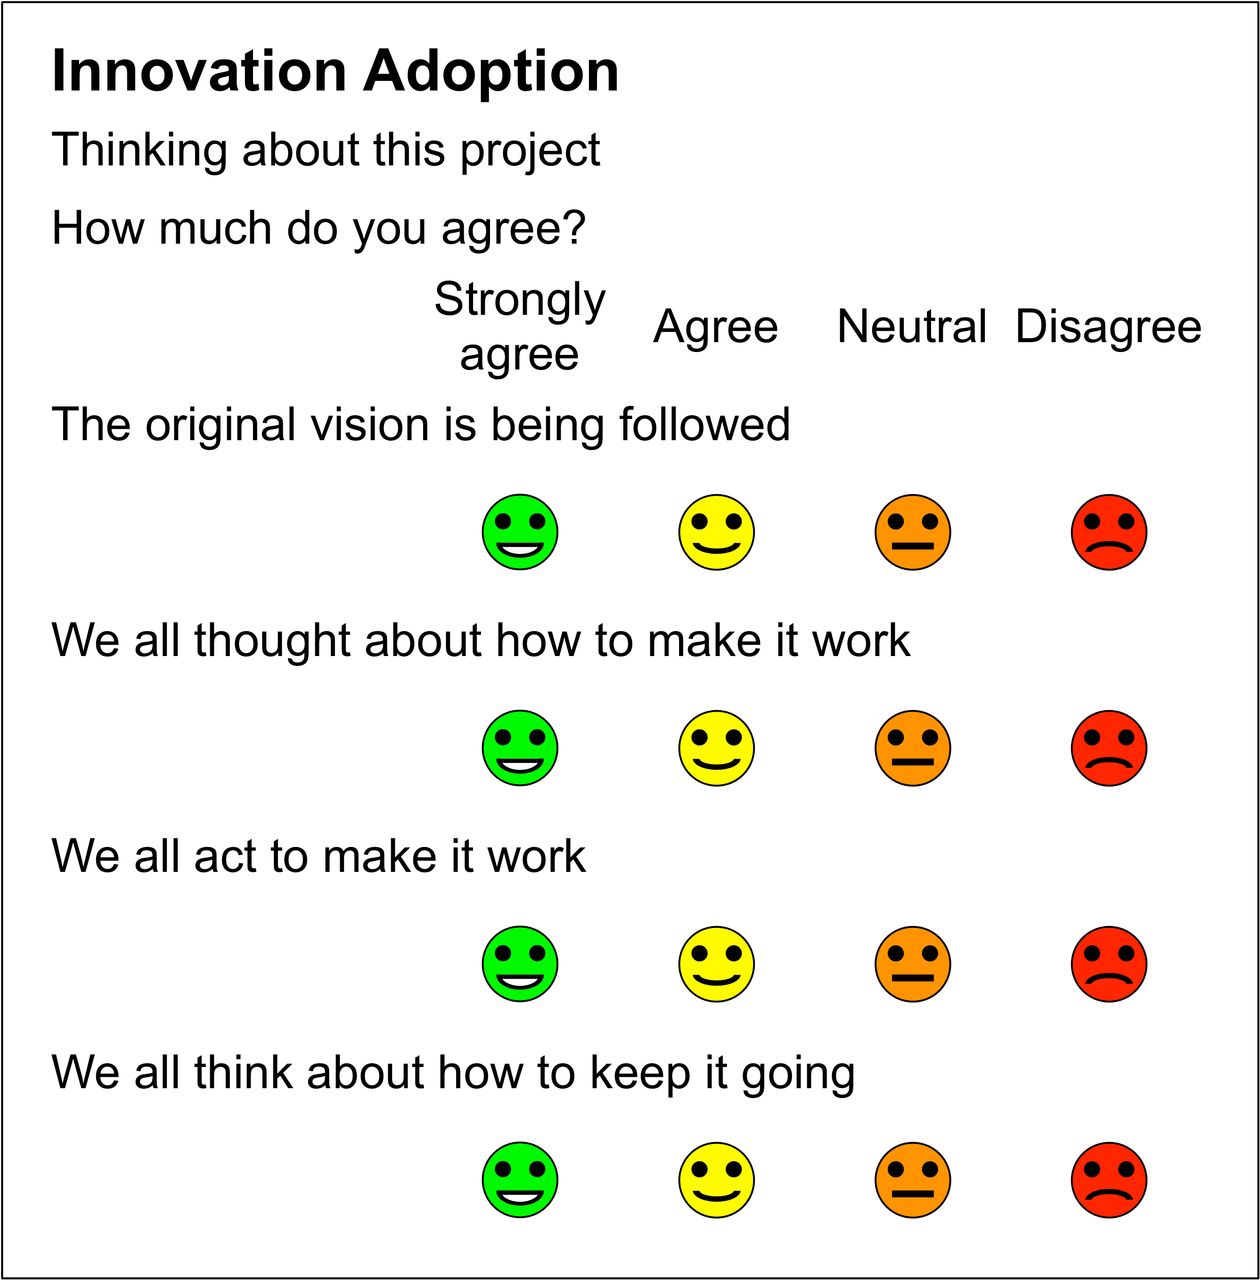
The Innovation Adoption Score rates the adoption process in terms of coherence and reflective thought before, during and after implementation. It is based on Normalisation Process Theory.
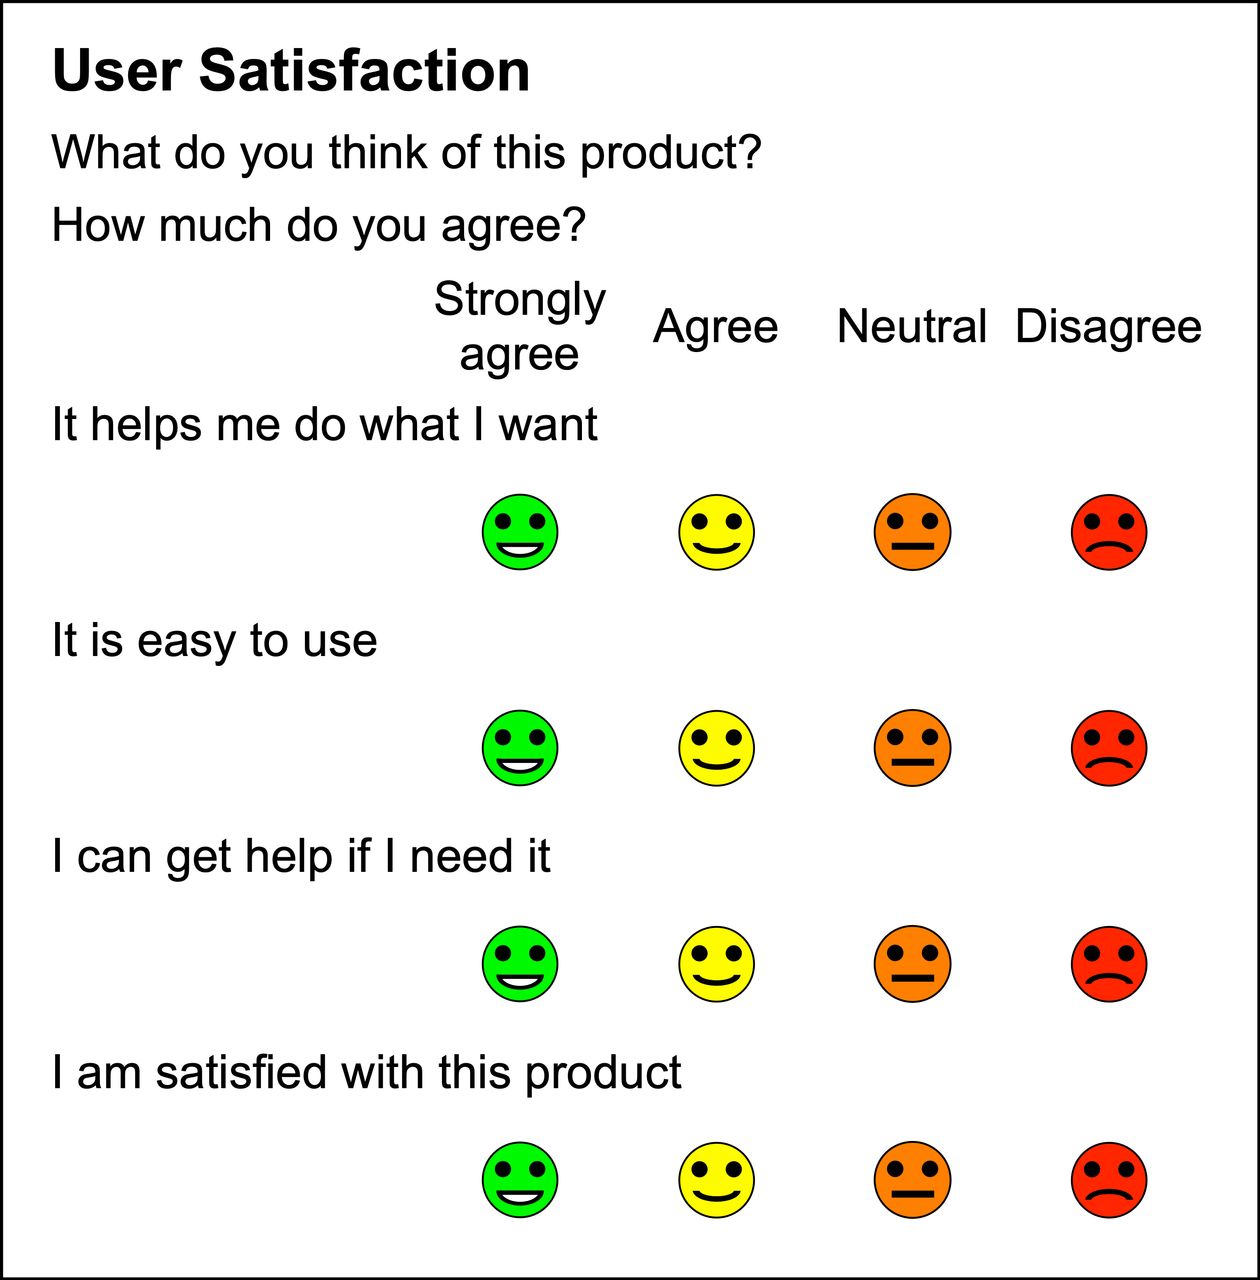
The User Satisfaction measure assesses a digital product in terms of usefulness, ease of use, support and satisfaction.
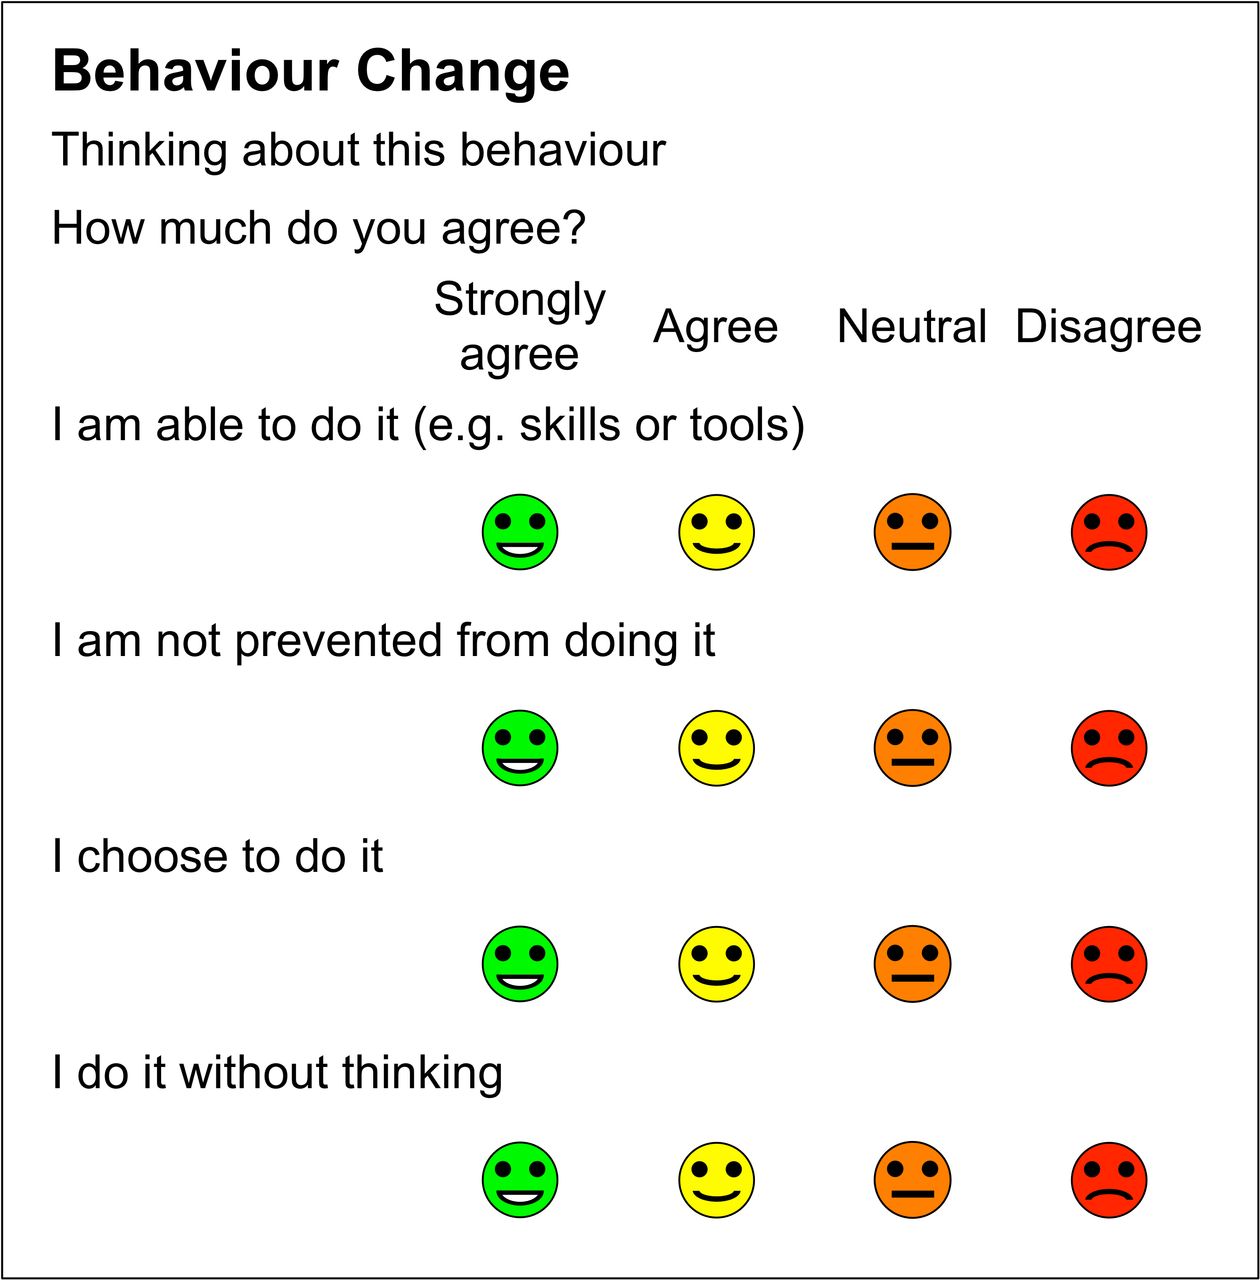
The Behaviour Change measure covers user perceptions of their capability, opportunity and motivation to change behaviour, based on the COM-B model.
These measures have been mapped onto Greenhalgh’s NASSS Framework (non-adoption, abandonment and challenges to scale-up, spread and sustainability of health and care technologies).
Conclusion These tools measure different aspects of digital health innovations and may help predict the success of innovation dissemination, diffusion and spread programmes.
- innovation diffusion
- computer literacy
- consumer behaviour
- program evaluation
- behaviour change
This is an open access article distributed in accordance with the Creative Commons Attribution Non Commercial (CC BY-NC 4.0) license, which permits others to distribute, remix, adapt, build upon this work non-commercially, and license their derivative works on different terms, provided the original work is properly cited, appropriate credit is given, any changes made indicated, and the use is non-commercial. See: http://creativecommons.org/licenses/by-nc/4.0
Statistics from Altmetric.com
Introduction
Innovation is defined in different ways: as a product such as a new idea, method or device; as a process, such as the introduction and adoption of new ideas, discoveries and inventions; and as an outcome, such as significant measurable change. Here our focus is on innovation as a process.
In the NHS, annual spending on research and development, including the National Institute of Health Research (NIHR), was £1.2 billion in 2014–15, but over the same period annual spending to support innovation spread through the Academic Health Science Networks (AHSNs) was much less (£50 million).1
Evaluators seek to understand how and why healthcare innovations do or do not spread. The focus is often the innovation itself (technology), although other factors are often critical in determining success or failure.2 Healthcare innovation is seldom a simple linear process but involves a complex adaptive system in which unpredictability and uncertainty are normal.3
The NASSS (non-adoption, abandonment, scale-up, spread, and sustainability) framework helps us understand the reasons for non-adoption, abandonment and challenges to scale-up, spread and sustainability of patient-facing health and care technologies using seven dimensions: the clinical condition(s) being treated; the technologies used; the value proposition; the adopter system (staff, patients, carers); the organisation(s); the wider context; and interaction between domains and adaptation over time.4
The work described here was prompted by evaluation of digital innovations in health and care services, in particular, evaluation of digital innovations and new care models led by Wessex AHSN and the Diabetes Digital Coach NHS Testbed led by West of England AHSN.
We looked for short simple generic survey tools to meet our evaluation needs but could not find what we sought. As a result, we developed a set of related measures, based on reviewing the innovation literature and earlier experience of developing person-reported outcome measures (PROMs) and person-reported experience measures (PREMs). These measures are described here:
Innovation Readiness Score helps rate where users and organisations lie on the innovativeness spectrum (based on Rogers’ categories of innovator, early adopter, early majority, etc).5
Digital Confidence Score helps rate user’s digital literacy and confidence to use digital products, to distinguish between digital natives and digital immigrants.6
Innovation Adoption Score is based on May’s Normalisation Process Theory (NPT),7 to rate the process of adoption before, during and after implementation.
User Satisfaction rates user’s assessment of a specific digital product, as a combination of customer satisfaction and user experience (in its widest sense).8
Behaviour Change helps identify factors such as capability, opportunity and motivation that enable or prevent us from doing what is being proposed, based on Michie’s COM-B model.9
These measures share the look and feel of R-Outcomes family of short generic PROMs and PREMs.10 11
Design criteria include being clear, brief, suitable for frequent use, multi-modal (suitable for use with multiple data collection modalities including smart-phones), responsive, good psychometric properties and easily understood scores and data visualisation. Scores generated need to be easy to interpret and action by all stakeholders, and be comparable for benchmarking.
The measures are short with a low reading age and are generic, applicable for any condition in any setting. Each has four items, although exceptions are allowed, with four response options each. Options are labelled, colour-coded and use emojis, with the best option on the left and the least desirable on the right. For scoring, each option is allocated a score on a 0 to 3 scale, where: Strongly agree=3, Agree=2, Neutral=1, and Disagree=0. A higher score is always better.
A summary score for a group of four items is calculated by adding the scores for each item, giving a 13-point scale with a range from 0 (4×disagree) to 12 (4×strongly agree). When reporting results for a cohort, the mean score is transformed linearly to a scale from 0 to 100, where 0 indicates that all respondents chose the lowest score and 100 that all chose the highest. The 0–100 scale is familiar and enables comparison of item and summary mean scores on the same scale.
Each measure was developed in a similar way. We identified the need for a measure, reviewed the literature, consulted with colleagues and users, designed prototypes and the measures evolved through a series of iterations with input from users and colleagues over several months or years.
Measures
Innovation readiness
The concept of innovation readiness or innovativeness is based on Everett Rogers’ classic text on innovation diffusion.5 Innovativeness is the degree to which an individual or organisation is relatively earlier in adopting new ideas than other members of the system. At the individual level, members of a social system may be classified into adopter categories on the basis of their innovativeness. The numbers in parenthesis show the expected percentage of a population found in each group, based on normal distribution.
Innovators, who are typically venturesome and outward looking individuals (2.5%)
Early adopters, typically locally respected (13.5%)
Early majority, who deliberate before choosing (34%)
Late majority, who are generally sceptical of change (34%)
Laggards, traditionalists (16%).
For individuals, the innovation-decision process is an information-seeking and information-processing activity to understand the advantages and disadvantages of the innovation. It starts once a need has been recognised and includes:
Knowledge acquisition
Persuasion
Decision (adopt or reject)
Implementation, including reinvention, and routine use
Confirmation, evaluation and promotion.
The rate of adoption is measured by how long it takes for a certain proportion of the members of a system to use the innovation. Innovators and early adopters have shorter innovation-decision periods than late adopters and laggards. Aspects of innovations that help explain different rates of adoption include:
Relative advantage—is it better than what it replaces?
Compatibility—consistent with values, needs and past experience
Complexity—ease of understanding
Trialability—easy to test or pilot
Observability or visibility
Adaptability to local context
Evidence base.
Diffusion and dissemination of innovations are complementary concepts. Diffusion is horizontal, usually unplanned and subjective, through peer networks. Dissemination is vertical, planned and targeted top-down from the centre, and is usually based on experts’ recommendations. Spread covers both diffusion and dissemination.
Within organisations, the innovation process has five stages:
Agenda—identify a need
Match—fit a solution with a problem
Redefine/restructure—adapt the organisation and/or the innovation to each other
Clarify—the meaning of the innovation becomes clearer to the organisation’s members
Routinise—the innovation is widely used and sustainable. It becomes the way we do things here.
We set out to develop a short generic measure to assess the level of innovation readiness of individuals and the organisation within which they work.
For individuals, each adopter type on the innovativeness spectrum has characteristic differences in terms of socioeconomic status, personality values and communication behaviour. Attributes of early adopters and innovators are optimism, openness and being well informed about new ideas.
New ideas are needed in my field (openness)
I keep up to date on new ideas (well-informed).
In organisations, innovation often involves adaptive change, which puts pressure on staff at all levels.12 Attributes for success include a culture of receptiveness to new ideas and the organisation’s capability, capacity and perseverance to make changes work.
My organisation supports new ideas (receptiveness)
My organisation makes new ideas work (capability).
The Innovation Readiness measure (figure 1) is used by staff working in organisations.

Innovation Readiness measure.
Digital confidence
The digital divide6 is a problem especially in health and social care, where many patients are old, infirm and may suffer from cognitive challenges such as dementia.13
Digital literacy overs the capabilities that fit someone for living, learning, working, participating and thriving in a digital society.14 It includes computer, network, information and social media literacy and computer self-efficacy.15
The Computer Self-Efficacy measure focuses on a computer software package designed to make your life easier that you have not used before.16 It has 10 question items, rated using a 10-point scale, and is focused on computer systems used at work.
Our initial focus was on older people’s confidence to use digital devices in their own time, but it also applies to staff, who may be expected to use digital devices at work for the first time. The purpose of a digital confidence score is to self-rate people for their level of digital literacy, so that people who need more help can get it.
The Digital Confidence Score (figure 2) has four items:

Digital Confidence Score.
I use a digital device frequently—this is about familiarity
Most of my friends use digital devices—this is about social pressure
I can usually get help if I am stuck—this is about support
I feel confident using most digital devices—this is about overall digital self-efficacy.
We have also developed a composite measure for service users such as patients, which we call the Digital Innovation Score, with two items from the Digital Confidence Score and two items from the Innovation Readiness Score:
I use a digital device frequently
I feel confident using most digital devices
New ideas are needed in this field (openness)
I keep up to date on new ideas (well-informed).
Innovation adoption
An important aspect of top-down innovation dissemination is the way it is done (process). NPT was developed by May and others to help understand the dynamics of implementation of complex interventions in healthcare.7 It helps explain how new methods and processes become routinely embedded in their contexts, based on four mechanisms:
Coherence of the original vision
Cognitive participation and planning
Collective action to make it work
Reflexive monitoring to make it better.
NPT focuses on the work that people do at each stage. NPT has been used successfully alongside R-Outcomes in several evaluations of new models of care. Traditionally, NPT has been used by trained interviewers with staff collecting qualitative (narrative) answers to 16 questions (NoMAD).17
Working with NPT practitioners, we looked at the feasibility of creating a staff-reported module related to NPT to help evaluate specific innovations, consistent with R-Outcomes look and feel. This is shown in figure 3. This uses an agree/disagree structure, with four items to be asked of staff about their experience in working on a specific project:

R-Outcomes Innovation Adoption measure.
Is the original vision being followed? (coherence)
Did staff plan in advance how to make it work? (cognitive participation)
Are all staff working together to make it work? (collective action)
Does everyone reflect on how best to keep it working? (reflexive monitoring).
User satisfaction
Evaluators need a tool to measure user’s experience of a digital tool or product, which can be used either soon after starting to use a product or after several months of use. The scope should cover all software products, not only apps used on mobile devices. Applications have many purposes, and a generic rating tool needs to cope with a very wide range of use cases. Some such tools exist; one is the Mobile App Rating Scale (MARS), although it is not designed for end users (MARS has 2092 words and has a reading age of 14).18
The User Satisfaction measure is a short generic questionnaire to allow end users to rate their perceptions of a specific software application or product (figure 4).

User Satisfaction measure.
The four items are rated on a 4-point scale from strongly agree to disagree:
It helps me do what I want—this captures whether the product is useful in helping you achieve your aims
It is easy to use—this rates user experience
I can get help if I need it—this rates the availability of support either from other people or online
I am satisfied with this product—this rates overall satisfaction with the product. This is intended to be a broader concept than the previous items.
Behaviour change
Many innovations are intended to promote or require behaviour change. For behaviour to take place, each user must have the capability, opportunity and sufficiently strong motivation to do it.9
Capability The person or people must have the physical strength, knowledge, skills, stamina, etc, to perform the behaviour.
Opportunity The behaviour must be physically accessible, affordable, socially acceptable and given sufficient time.
Motivation People must be more strongly motivated to do the behaviour at the relevant time than not to do it, or do something else. Motivation includes both unconscious habits (automatic) and conscious (reflective) thoughts and goals, corresponding to fast automatic thinking (Kahneman’s System 1) and slow reflective thinking (Kahneman's System 2).19
Capability and opportunity impact motivation; these impact behaviour and, in turn, are impacted by behaviour change. To change behaviour, you must be clear about what behaviour you seek as well as the context in which it can be achieved. Then think about what must change, by and with whom, where, when and how often. For one type of behaviour change it may be best to remove a perceived barrier by enabling capability, while for another it may be better to deter behaviour by restricting the opportunity to do it.
The COM-B model is essentially bottom-up, focusing on those whose behaviour is targeted, and why and how people change their behaviour. It helps us understand how to introduce changes in behaviour and culture successfully at the level of individuals, communities and populations, or why the behaviour change that was expected did not occur.
The Behaviour Change measure contains one item on capability, one on opportunity and two about motivation (reflective and automatic) (figure 5).

Behaviour Change measure.
Discussion
These short survey measures have been developed for use in evaluation of health and care innovations. They can be used individually or in combination or with other outcome and experience measures.
This discussion considers how these measures relate to Greenhalgh’s NASSS (non-adoption, abandonment, scale-up, spread, and sustainability) framework for understanding the adoption or non-adoption of digital health innovations. The NASSS framework was developed in the context of understanding why technology innovations in health and social care have often failed.4 20
The NASSS framework has seven domains, further broken down into 22 qualitative questions. Challenges in each domain are classified as being either Simple, Complicated (multiple interacting issues) or Complex (dynamic and unpredictable). In case studies, programmes characterised as Complicated proved difficult to implement, while those characterised as Complex in multiple NASSS domains may be impossible to implement successfully and seldom become mainstream.
Condition or illness, including comorbidities and socio-technical aspects. There needs to be a good fit between the innovation and patients’ clinical conditions.
Technology, including usability (ease of use and reliability), data quality, support needs and procurement issues.
Value proposition for suppliers’ business models and cost-effectiveness for users.
Adopter system including impact and expectations of how professional staff, patients and lay caregivers will adopt and use the technology.
Organisations’ capability, capacity and readiness to support the innovation including adequacy of funding and staff time and to adapt local processes to fit.
Wider institutional and societal context outside local control, including national policies, payment schemes, professional (medicolegal) regulations and information governance.
Interaction between these domains, evolution and adaptation to changes in case-mix, technology or policy over time.
This framework can help explain, understand and learn from programme failures and successes. For example, some projects, which are fully specified before funding, fail because the protocols or contracts are not flexible enough to adapt to emergent changes that were not predicted nor knowable at the outset.21 22
Table 1 shows our understanding of the expected relationship between NASSS domains and the five R-Outcomes measures. In this table, the number of stars indicates the expected strength of the relationship between the NASSS domain and the measures described here.
Relationship between NASSS domains and R-Outcomes measures
The relationship between NASSS domains and these measures is nuanced. For example, innovations in long term conditions such as diabetes, which are complicated or complex, may give rise to different responses than those in ‘simpler’ conditions where the outcome is predictable or immediate. Similarly, technologies which are inherently complicated or complex may produce different responses than those that are simple to learn, use or implement.
R-Outcomes measures are designed to be used together using a pick and mix approach, depending on local needs. The measures described here are focused on specific innovation adoptions and can be used in combination with other measures which address patient outcomes (such as health status, well-being and health confidence), experience of care within and across providers, wider determinants of health and properties of the locality.
We hope that these tools can also be used prospectively to identify people and organisations that are ready to adopt innovations and to help those less ready to become more prepared.
We expect that testing will identify some new issues that need to be fixed, so they should not be regarded as being final. We are seeking collaborators who are interested in collaborating with us to test and validate these measures in practical applications.
One of the first large-scale examples of the use of these measures is to evaluate staff perceptions of the AHSN Network’s programme to spread the use of portable electrocardiogram (ECG) devices to detect undiagnosed atrial fibrillation (AF) in order to prevent strokes.23 The target is to detect and treat over 100 000 people with AF, to prevent 4000 strokes and save 1000 lives.24
Conclusions
These tools, which cover innovation readiness, digital confidence, innovation adoption, user satisfaction and behaviour change, are designed to help with the evaluation of the spread and adoption of new technologies in health and care. They have been influenced by and are mapped to the NASSS framework.
Acknowledgments
I wish to acknowledge the help and suggestions from many people in developing these measures, including colleagues at R-Outcomes Ltd, Philippa Darnton and David Kryl at Wessex AHSN (http://wessexahsn.org.uk), Liz Dymond and other contributors to the Diabetes Digital Coach NHS Testbed project at the West of England AHSN (https://www.weahsn.net).
Footnotes
Contributorship statement The author designed the questionnaires and takes full responsibility for the final manuscript.
Funding The authors have not declared a specific grant for this research from any funding agency in the public, commercial or not-for-profit sectors.
Competing interests Tim Benson is a director and shareholder in R-Outcomes Ltd, which provides survey and evaluation services using these measures.
Patient consent for publication Not required.
Provenance and peer review Not commissioned; externally peer reviewed.