Article Text

Abstract
Background Patient safety is vital to well-functioning health systems. A key component is safe prescribing, particularly in primary care where most medications are prescribed. Previous research has demonstrated that the number of patients exposed to potentially hazardous prescribing can be reduced by interrogating the electronic health record (EHR) database of general practices and providing feedback to general practitioners (GPs) in a pharmacist-led intervention. We aimed to develop and roll out an online dashboard application that delivers this audit and feedback intervention in a continuous fashion.
Method Based on initial system requirements, we designed the dashboard’s user interface over three iterations with six GPs, seven pharmacists and a member of the public. Prescribing safety indicators from previous work were implemented in the dashboard. Pharmacists were trained to use the intervention and deliver it to general practices.
Results A web-based electronic dashboard was developed and linked to shared care records in Salford, UK. The completed dashboard was deployed in all but one (n = 43) general practices in the region. By November 2017, 36 pharmacists had been trained in delivering the intervention to practices. There were 135 registered users of the dashboard, with an average of 91 user sessions a week.
Conclusion We have developed and successfully rolled out of a complex, pharmacist-led dashboard intervention in Salford, UK. System usage statistics indicate broad and sustained uptake of the intervention. The use of systems that provide regularly updated audit information may be an important contributor towards medication safety in primary care.
- patient safety
- drug prescriptions
- electronic audit and feedback
- dashboard
Commons license http://creativecommons.org/licenses/by/4.0/
Statistics from Altmetric.com
INTRODUCTION
Patient safety has become an integral part of quality management in healthcare systems worldwide. While patient safety research has traditionally focused on secondary care,1–3 primary care, as the cornerstone of modern healthcare systems,4 is increasingly recognised as an area where major improvements in patient safety can be achieved,5,6 especially due to the large numbers of medications that are prescribed on a daily basis.7 It has been shown that one in 20 prescriptions in primary care contain errors, and one in 550 contain potentially life threatening errors.7 One in 25 hospital admissions are the result of prescribing errors in primary care,8 and adverse drug reactions, of which most are avoidable, cost the NHS an estimated £500 million per year.9
The potential for Information Technology (IT) systems to improve safety within healthcare is large and well documented.10,11 For prescribing safety, there are examples where IT systems have had positive12 and negative13,14 effects. IT-based interventions for improving prescribing safety fall broadly into two categories: clinical decision support (CDS) and electronic audit and feedback (eA&F). CDS systems, such as pop-up alerts, attempt to influence behaviour at the point of care and while some studies have shown benefits,15 others have shown that clinicians can suffer from ‘alert fatigue’ where poorly targeted alerts lead to their routine dismissal.16,17 eA&F systems, such as dashboards, provide feedback away from the point of care, usually at a population level, to allow for clinicians to review, and potentially change, their practice retrospectively.18 A systematic review of eA&F systems found a wide degree of heterogeneity in both the identified studies and their effects.19 Another literature review, specifically focusing on dashboards, had similar findings and called for more research to be undertaken to help influence the design of such systems.20 Despite the widespread usage of such dashboards, there exists little evidence as to what factors contribute to their success or failure.21
A common limitation of both types of intervention is that they often only indicate problems, without necessarily providing solutions. Even when specific actions are recommended, clinicians do not necessarily have the time or skills to act appropriately.22 The University of Nottingham, therefore, developed the pharmacist-led information technology intervention for reducing medication errors (PINCER) in primary care. The PINCER intervention is based on computer-generated feedback that identifies patients for whom potentially hazardous prescribing practices are present, but crucially adds educational outreach visits by trained pharmacists23 to general practices where they work with the local staff to resolve any confirmed hazardous prescribing incidents and to prevent their reoccurrence. The intervention was shown to be more effective at reducing numbers of at-risk patients than computer-generated feedback alone24; proving the pharmacist visit plays a crucial role in effectively solving prescribing errors. It was also shown to be likely (59% chance) cost-effective in reducing prescription errors.24,25
There are indications that the reduction in risk due to PINCER is only temporary because it does not always reduce the incident erroneous prescribing behaviour.24 This is in part because the PINCER feedback mechanism relies on snapshots of data extracted from the electronic health record (EHR) database, while feedback is known to be more effective when it is provided more than once.26 Therefore, we aimed to build upon PINCER in order to create a continuous feedback loop for cycles of quality improvement. Our objectives were to develop an application that identifies patients exposed to potentially hazardous prescribing to end users and is updated on a daily basis, and roll out the system across Salford, UK, where our previous research has shown the prevalence of potentially hazardous prescribing is greater than 5%.27
METHODS
System requirements
Based on an initial scope definition created by a senior clinical pharmacy researcher (Darren M. Ashcroft) and the principal investigator of the PINCER study (Anthony J. Avery), it was decided that a front-end dashboard application and the associated back end was required that would:
receive, validate and process data extracts of patient records from general practitioner (GP) systems on a daily basis, via an existing shared care record infrastructure – the Salford Integrated Record (SIR);
execute queries to the GP system data, based on pre-defined indicators, to identify patients at risk of adverse medication events;
present lists of at-risk patients to GPs and pharmacists, in a secure environment, restricting the visibility of patient identifying information to those clinicians that are responsible for that patient’s care;
provide the results in a timely, user friendly and actionable manner.
The indicators to be used in the dashboard were selected from the set of 56 prescribing safety indicators for GPs identified by Spencer et al.28 Indicators were selected based on their severity and the practicality of extracting the relevant information from clinical records. They aim to prevent: gastrointestinal bleeding; asthma exacerbations; acute kidney injury; liver damage and neutropenia; hypo and hyperthyroidism and thrombotic risks. The list of indicators in the dashboard is available in Table 1 in the Supplementary Material. Computable representations of the indicators were required which would involve creating clinical code sets29 for each component, and determining whether a patient was prescribed to take a medication at a given point in time. This last requirement is not simple as although prescription events in UK primary care are always recorded electronically, there is usually no coded record when a medication is stopped, so instead the termination of the medication must be inferred by the lack of a repeat prescription.
It was also decided that the system’s feedback regarding each indicator would consist of a numerator (also known as the affected or ‘at-risk’ patients), and a denominator (also known as the eligible patients). The ‘affected patients’ are those who have breached the conditions of the indicator and are therefore those patients at risk from potentially hazardous prescribing who need corrective action. The ‘eligible patients’ are those who meet a particular subset of the conditions of the indicator and are the population of patients against which the affected patients can be measured. The terms numerator and denominator are used as the proportion of eligible patients who are also affected patients can be used to compare between practices of different sizes and demographics.
Engineering methods
The initial design of the dashboard’s user interface was created following an iterative process which was informed by short interviews with key stakeholders involving six GPs, seven clinical commissioning group (CCG) pharmacists and one member of our patient and public involvement group. Prototype dashboard designs were reviewed by the stakeholders during interview and feedback sought. This feedback was incorporated into the design for the next dashboard iteration.30
The software architecture of the dashboard, the user interface and all the associated back-end processes were designed by the lead author Richard Williams. The software development was undertaken by Richard Williams and Colin Davies. Where possible open-source technologies were used to ensure that the system could be made publically available in the future if required. Operating systems and server architecture were designed in order to meet the requirements of the secure server hosting within the Salford Royal Foundation Trust (SRFT) data centre.
System usage monitoring
A final requirement was that the system should track usage, and record all interactions with the dashboard down to individual mouse clicks, hovers and non-sensitive key strokes, that is, not passwords. A large volume of usage tracking data will therefore be collected enabling us to report on the frequency and duration with which the dashboard is used, who its primary users are (e.g. pharmacists or GPs), and how this varies between practices and over time. It will also allow us to assess which feedback modalities provided by the dashboard (table, benchmark charts, trend charts and patient lists) are typically accessed by users, and under which circumstances. Finally, we can analyse which areas of medication safety (i.e. which indicators) users tend to focus on when they access the dashboard.
Implementation and roll-out
Any general practice in Salford was eligible for receiving the intervention provided they had access to SIR. Research team members met with Salford CCG leads and GP quality leads to identify practices for recruitment. Once identified, the CCG pharmacy team (supported by the research team) provided practice managers/senior partners with an information sheet about the intervention for distribution amongst practice staff and an invitation to take part.
If practices decided to take part, their staff received online access to the dashboard. No physical installation at the practice level is necessary. In addition, trained NHS clinical pharmacists will visit the practices regularly for at least 12 weeks, access the dashboard, and advise on changes in medication prescribing/monitoring in collaboration with practice staff.
Pharmacist time was resourced by Salford CCG and by the NIHR Greater Manchester Patient Safety Translational Research Centre (http://www.patientsafety.manchester.ac.uk/). Pharmacists were recruited and trained to help deliver the intervention. The training was based on the original PINCER trial pharmacist training23 and involved: introducing the prescribing safety indicators included in the dashboard and the risk they pose to patients; the importance of academic detailing and causation analysis/systems thinking; describing the SMASH dashboard and clinical pharmacist intervention and developing the understanding of how to respond to potentially hazardous prescribing in practice. Each pharmacist was assigned to one or more practices with whom they arranged an initial meeting during which they talked to the practice about the indicators and showed them how to use the dashboard. Pharmacists and GPs were encouraged to focus on resolving cases of potentially hazardous prescribing identified by the dashboard during an initial 12-week ‘intensive’ period. From the date of the initial meeting with each general practice, we followed up that practice for 12 months to discover: whether the numbers of at risk patients reduce; whether any reduction is sustained; how people use the system and how their use affects patient outcomes.
RESULTS
Architecture
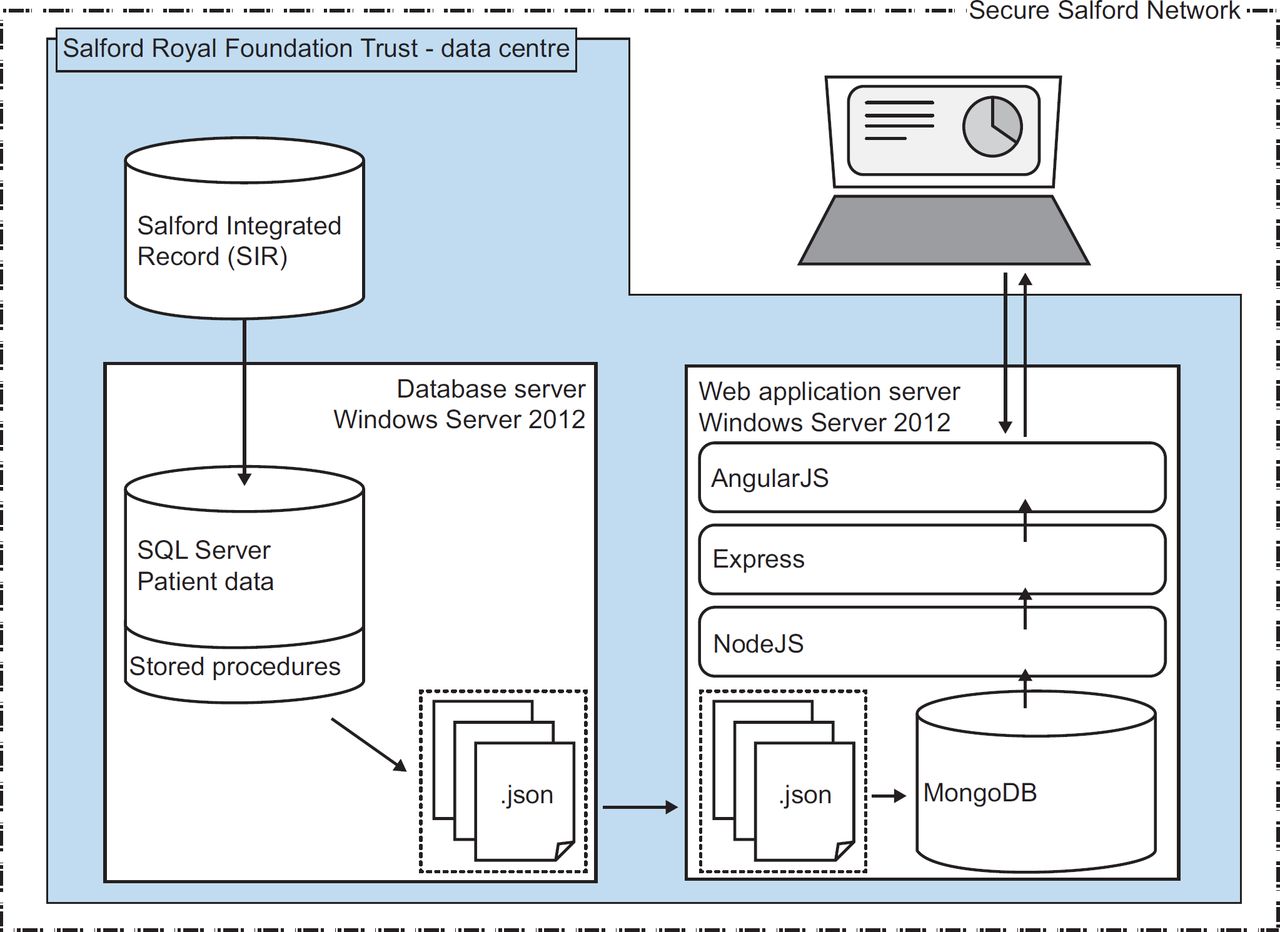
The system is deployed to two servers (see Figure 1), running Windows Server 2012, in the secure data centre of the SRFT. One server runs the main patient database using SQL Server 2012, and the other runs SMASH – the web application that the users access. SMASH is rendered on the client side with AngularJs,31 and is served with data via a RESTful API running on NodeJS32 and Express.33 It is available on the secure NHS N3 network meaning only people on that network can access the dashboard. Firewalls ensure that only recruited practices can view the dashboard. Users can access the site remotely using a virtual private network (VPN) connection to their practice.

Each day at midnight, the system receives data from primary care EHR data sources. Currently, this is SIR, a data warehouse containing all primary care data from Salford, though the system allows any suitable primary care data source to be incorporated. Once the data is updated, another batch runs to execute SQL stored procedures against the patient data to generate lists of at-risk patients for the front-end web application. These report data are copied to MongoDB34 on the web application server. The entire process takes about 2 hours.
Indicator development
We have developed computable representations of each indicator. Clinical code sets29 were created for each component of the indicator. For example, the indicator that looks for asthmatic patients who are prescribed a non-selective beta blocker required two main code sets: one code set to identify asthmatic patients and one to identify beta blocker prescriptions. In fact, a third set of codes for the event ‘asthma resolved’ was required so that patients whose asthma is no longer active would not be detected by the indicator.
To determine when a patient was prescribed to take a medication, we used two approaches. The first method was to count any patient with a prescription in the previous n months, where in our case, and for the current PINCER indicators, n = 3 months, but with longer periods for medications, such as combined hormonal contraceptives (n = 6 months), which often have longer prescriptions. The second approach was to reuse an algorithm that we had previously developed that considers the date of the prescription, the amount prescribed and the rate of medication usage (‘take 2 a day’) to determine when the patient has likely stopped the medication without the occurrence of another prescription.35
System functionality
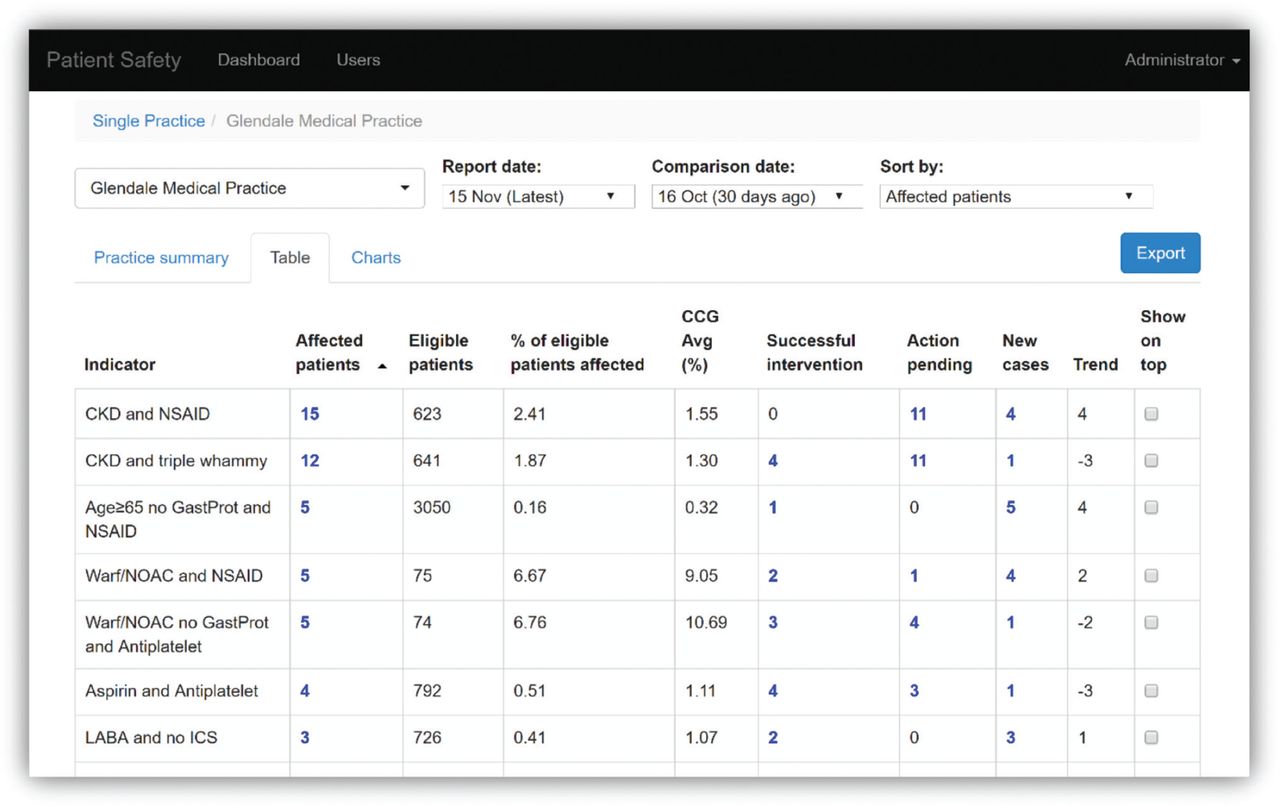
For users assigned to a single practice, the first screen after logging in presents a summary table for their practice on today’s date. For users with multiple practices, the user must first select a practice before viewing the summary. A second tab presents detailed information for each indicator (Figure 2 – all data in this and future screenshots is fictitious). The number of affected and eligible patients, the proportion of eligible patients affected and the current CCG average can be viewed here. A comparison date, defaulting to 30 days ago, allows the system to show the user: how many affected patients have been resolved; how many remain affected and how many new cases there have been since this comparison date. The user can: change the date of the report and the comparison date; sort the table by each column; select certain indicators to always appear on top irrespective of the sorting and drill down into lists of patients by clicking on any number within the table. A third tab displays this information in charts. One example visually compares the user’s practice with the average across the CCG (Figure 3). Another example, not displayed here, shows how the practice’s performance changes over time.

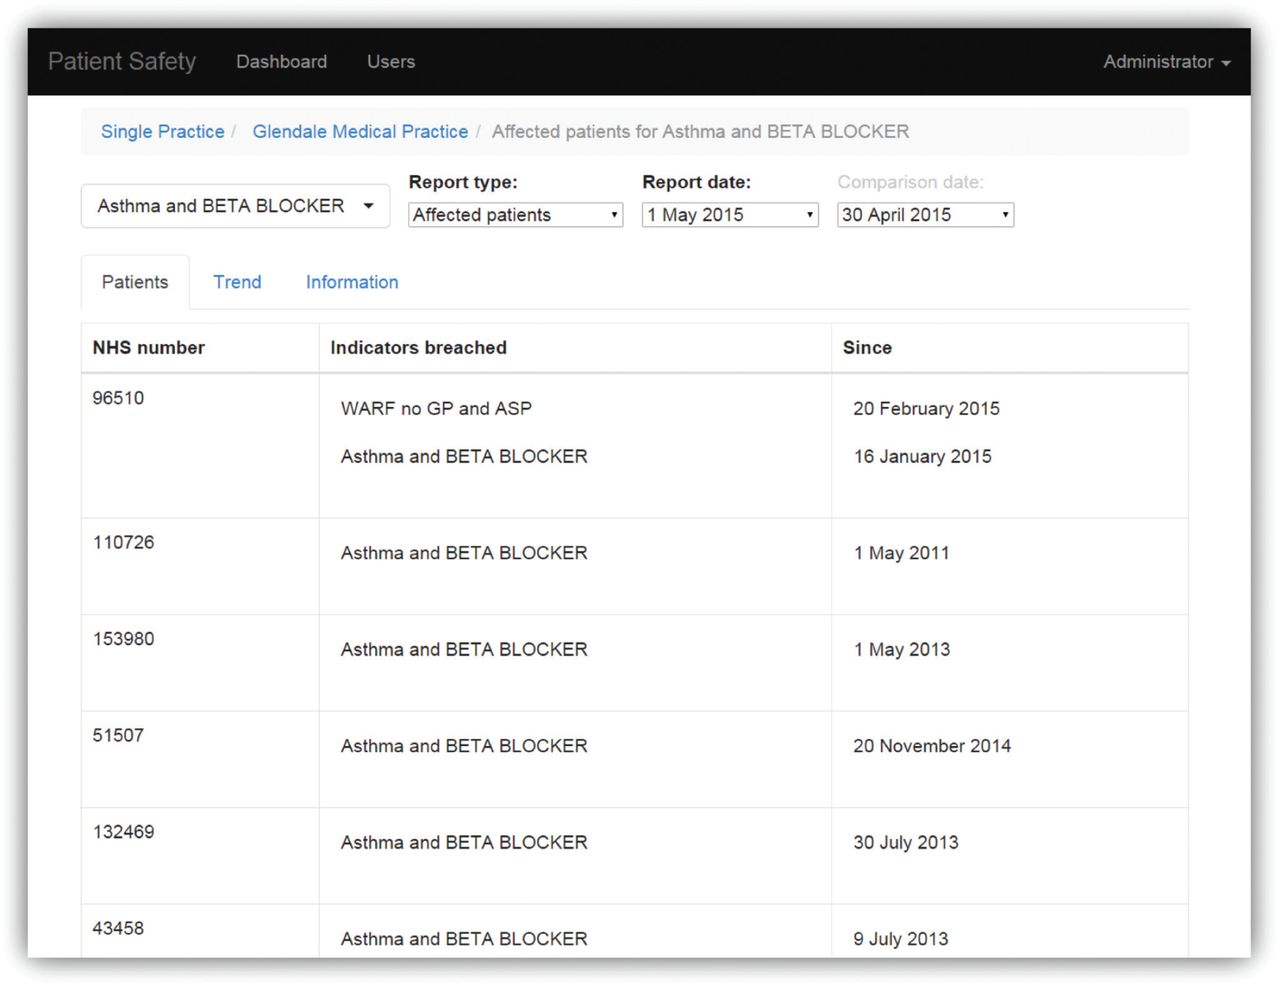
Selecting one of the hyperlinked numbers within the table in Figure 2 takes the user to a screen with a list of patients affected by the selected indicator on the selected date (Figure 4). For each patient, we display: their NHS number, which indicators they are breaching, and for how long they have been affected. The clinician can look up the patient in the practice’s EHR to determine an appropriate course of action. The selected indicator and date of interest can be changed.
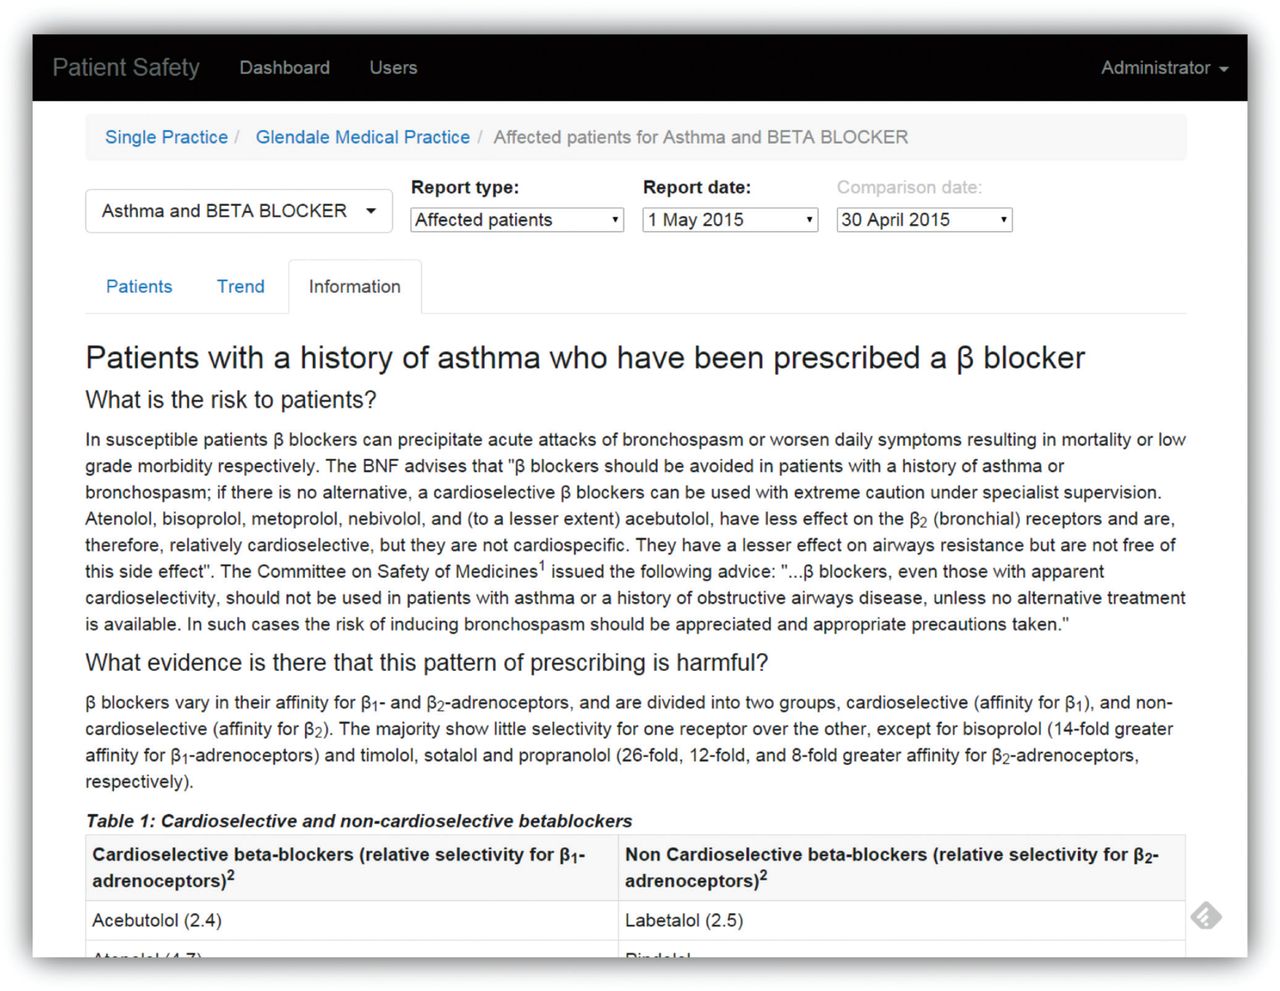
From the patient list (Figure 4), the user can select a tab named ‘Information’ to display a summary of the evidence supporting the selected indicator (Figure 5). This includes: the risk to patients; links to the academic literature supplying the evidence; the consequences of inaction and possible actions that could be taken.
Finally, some users are given the role of ‘CCG user’ which allows them to see summary performance measures across all practices within the CCG. They can view the proportion of at-risk patients in each practice for a single indicator, or for all indicators, in table or chart form (Figure 6).

Pharmacist and practice recruitment
By October 2017, 36 pharmacists, three pharmacy technicians and two CCG managers were trained to use the dashboard and how to introduce it to general practices. Although pharmacists and general practices were encouraged to focus on an initial 12-week ‘intensive’ period, in many cases, pharmacists continued to monitor and use the dashboard after this time.
We recruited 43 out of 44 general practices within Salford. The missing practice wanted to be involved but does not contribute to SIR and so was ineligible for the intervention. The first practice recruited completed the 12-month follow-up on 17 April 2017, and the last practice recruited will complete in September 2018. Effects on prescribing safety and adverse events will be evaluated thereafter in an interrupted time series analysis.
Usage
As of 17 November 2017, there are 135 registered users (51 pharmacists, 48 GPs and 36 other practice staff such as nurses and technicians) in the dashboard, excluding developers and research team members, with 28 users (all pharmacists) logging into the system in the last month (since 18 October 2017). In 2017, there have been an average of 91 user sessions per week (SD = 39), with an average duration of 17 minutes.
Preliminary findings
On 31 January 2017, we conducted an interim analysis comparing recruited practices with at least 1 month’s usage, with those practices not yet recruited or with less than 1 month’s usage. The number of at-risk patients in recruited practices (n = 32) had fallen from 1444 on 1 January 2016 to 882 on 31 January 2017. This is a mean reduction of 17.6 patients per practice and is significant (p = 0.0002) when compared with the mean reduction of 2.1 patients in practices not yet recruited (n = 12).
DISCUSSION
We have developed SMASH, a dashboard for displaying patients ‘at-risk’ of a serious adverse event, such as acute kidney injury or gastrointestinal bleeds, to pharmacists and GPs, and deployed it as part of a pharmacist-led intervention within Salford, UK. The system has seen high rates of adoption, with usage in all but one practice, and many users logging in each week.
Improving medication safety has become a major aim in all clinical settings. The potential for IT systems to contribute to this aim is substantial, but data on the effectiveness of IT interventions remains controversial. A systematic review of the effects of IT interventions on medication safety in primary care36 found that pharmacist-led IT interventions were successful in reducing medication errors. They suggest that the detection of unsafe medication by pharmacists together with feedback to and discussion with physicians may be an additional safeguard in the complex process of prescribing. Previously, a pragmatic, cluster randomised trial showed that the pharmacist-led PINCER intervention, on which SMASH is based, is an effective method for reducing medication errors in general practice. Recently, a cluster-randomized, stepped-wedge trial in 33 general practices in Tayside, Scotland, showed that a complex intervention combining professional education, informatics and financial incentives reduced the rate of high-risk prescribing of antiplatelet medications and NSAIDs.37
As noted by Ammenwerth et al.,38 any installation of health IT for medication safety must be based on an overarching medication safety strategy that is underwritten by the institution where the installation takes place. In line with this recommendation, we have worked in close collaboration with the local CCG in the development and roll-out of the SMASH dashboard, and they were instrumental in the roll-out becoming a success by resourcing pharmacist time and developing the strategy to recruit general practices and pharmacists.
The dashboard updates each night providing the users with up-to-date information whenever they choose to access it. Previous studies have shown that there is evidence that this immediate access to information may improve patient outcomes.20,39 SMASH conforms to most of the 15 suggestions for practice feedback interventions laid out by Brehaut et al.,39 such as: providing feedback in multiple ways (tables and graphs); providing individual rather than general data and recommending actions that are under the user’s control.
We have developed computable representations of evidence-based prescribing safety indicators, but it is challenging to determine whether a patient is currently prescribed a medication due to the absence of drug termination codes. The simple approach that looks for any prescriptions in the last 3 months is overly sensitive and flags up patients who have since stopped their medication. It also has the problem that there may be nothing actionable the GP or pharmacist can do to remove the patient from the dashboard – they must instead wait until their most recent medication is before the window of inspection. This has the potential to discourage usage of the dashboard and could also lead to extra work as users repeatedly review a patient’s record. The algorithmic approach is more promising, but requires additional pre-processing work to map drug codes to ingredients and strengths.
One limitation is that we have built a system external to the GPs standard EHR systems and so users are required to view patient lists within SMASH, before looking the patients up in a separate system. A more integrated approach would be easier for the end user, though given the high levels of usage that we have observed, it is a problem that the users are perhaps willing to overlook. Future versions of GP systems should consider incorporating safety indicators.
Over the coming years, we will: improve the existing dashboard based on feedback from the trial; deploy more indicators; roll out the system across Greater Manchester and working with industry partners and explore ways of allowing patients to interact with the system. The role of patients in their safe care is important40 and the ability for patients to discover when they are ‘flagged up’ by safety systems such as this will start to change the interactions between the patient and provider, and opens up several interesting avenues for future research.
Acknowledgements
This research was funded by the National Institute for Health Research Greater Manchester Patient Safety Translational Research Centre (NIHR Greater Manchester PSTRC). The views expressed are those of the author(s) and not necessarily those of the NHS, the NIHR or the Department of Health and Social Care. MRC Health eResearch Centre grant MR/K006665/1 supported the time and facilities of EK. Connected Health Cities is a Northern Health Science Alliance led programme funded by the Department of Health and delivered by a consortium of academic and NHS organisations across the north of England. The work uses data provided by patients and collected by the NHS as part of their care and support. The views expressed are those of the author(s) and not necessarily those of the NHSA, NHS or the Department of Health.